━━━━━━━━━━━━━━━━━━━━━━━━
2020年7月30日 鳥島近海の地震
━━━━━━━━━━━━━━━━━━━━━━━━
緊急地震速報が発表された原因として、
(1) 地震の場所を誤って予測し、実際の震源より400㎞以上北側に決めてしまったこと
(2) おそらく、上の誤った震源により、マグニチュードを過大評価してしまったこと
が挙げられます。なぜ地震の場所を誤って予測したのかは、様々な原因が考えられますが、現時点では良く分かりません。
防災科学技術研究所のHi-netとS-netのデータを利用して、現在の緊急地震速報と同じ手法(IPF法)で解析したところ、震源の誤差は30km程度とほぼ正確に決定できることが分かりました。予想されるマグニチュードも5.8と正しく推定できることが分かりました。
計算開始直後は、観測点の情報が少ないために、正しい震源から200kmほど北側に決まっていますが、 震源が近いとマグニチュードは小さく予測されるため、震度は正しく予測できています。 時間の経過に伴って予測震源は正しい場所に移動していき、計算開始後約20秒でほぼ正しい場所に収束しています。
1.地震について (Earthquake Information)
----------------------------------------------------2020/07/30,09:35:56 30.64 141.89 55.0 5.8
----------------------------------------------------
Table1. Earthquake information. Origin time, Epicentral latitude, longitude, depth, and JMA magnitude from the left.(ref. JMA catalog)
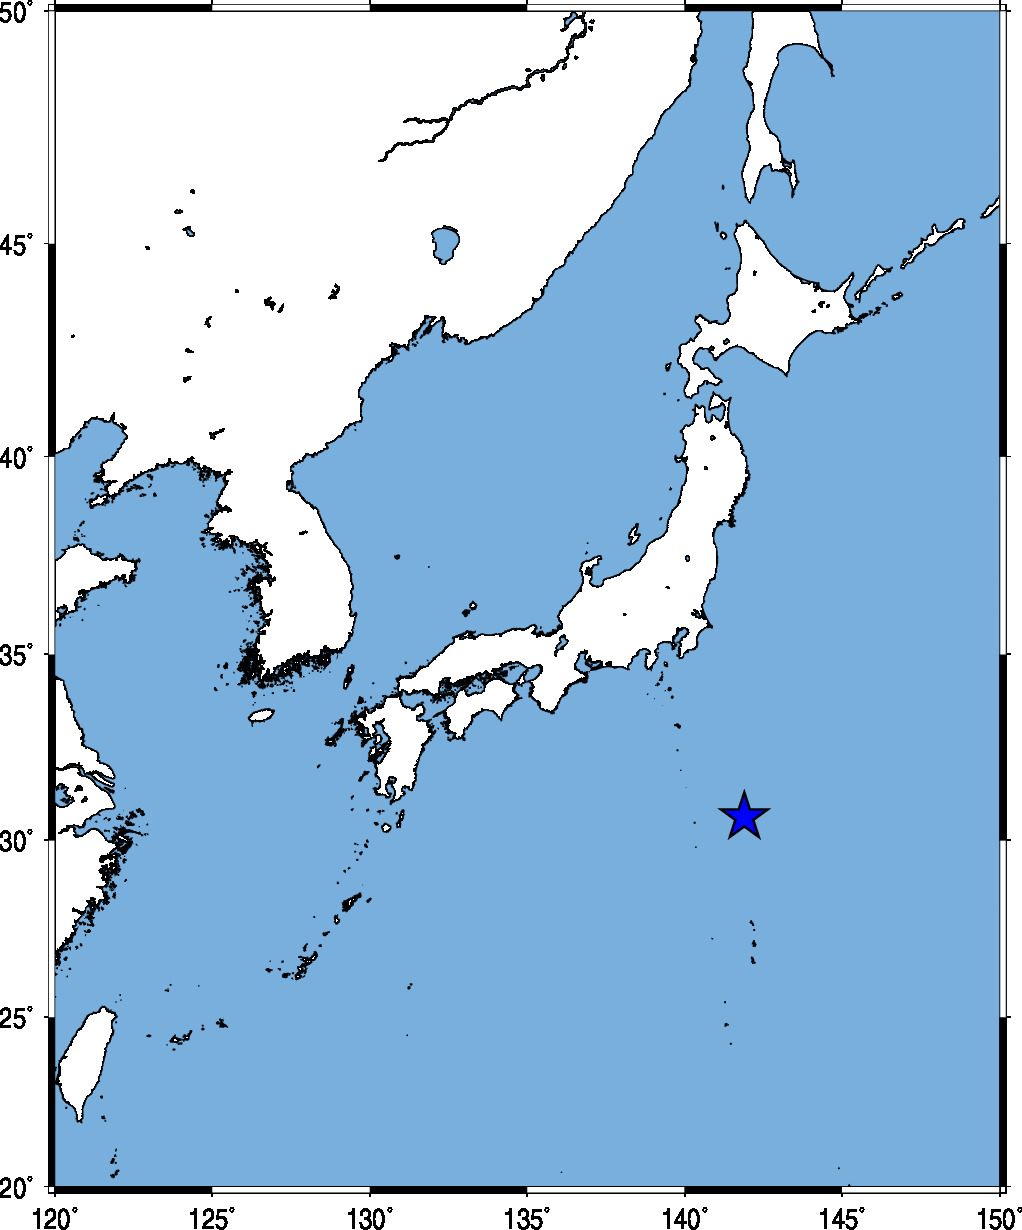
Fig.1. Event location.
2.観測点分布 (Station Distribution)
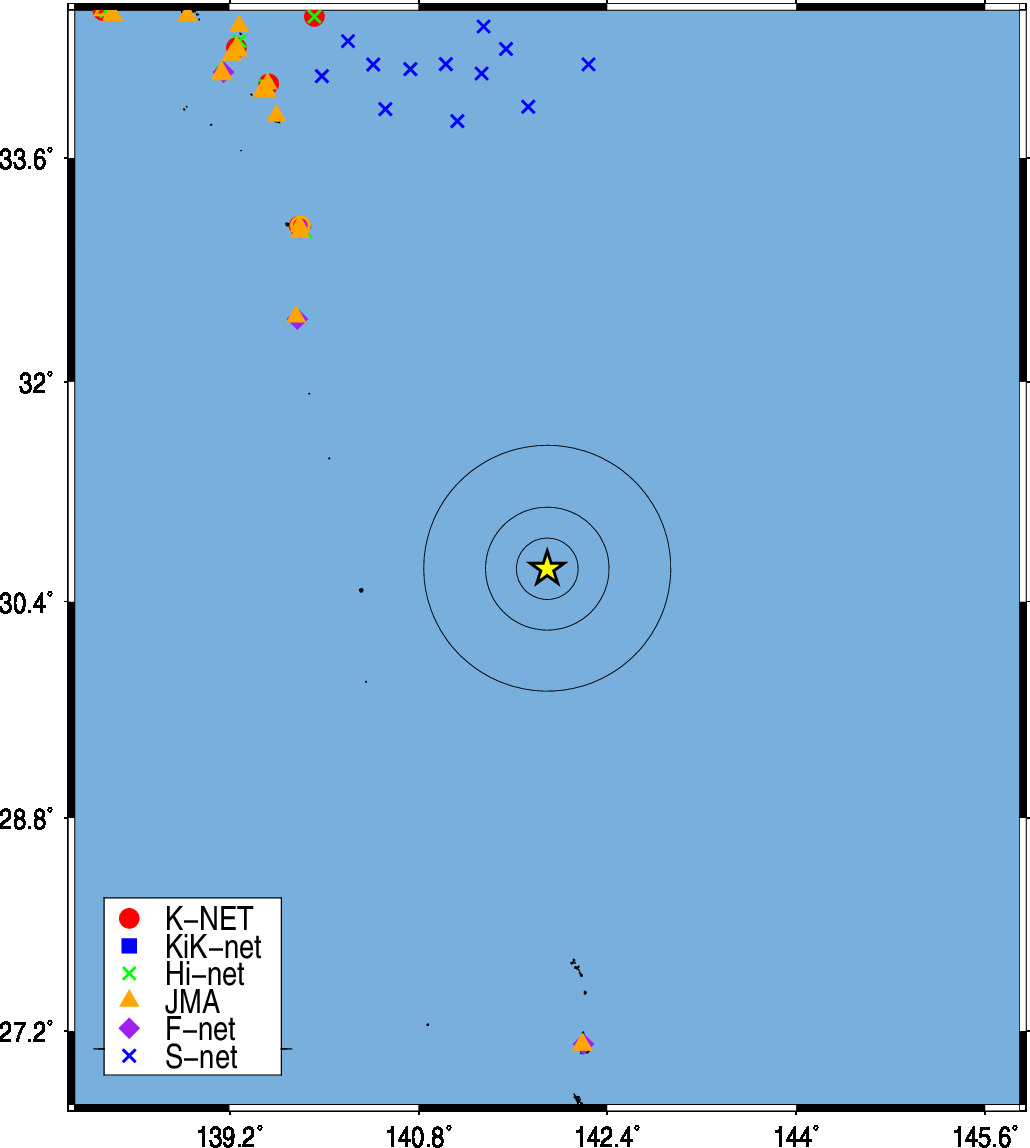
Fig.2. Station Distribution.
3.緊急地震速報発信状況 (Earthquake Early Warning Report)
-------------------------------------------------------------------[01] 20/07/30-09:36:51 02 M3.6 34.3N 140.0E 050km (20/07/30-09:37:33)
[02] 20/07/30-09:36:51 02 M3.9 34.3N 140.0E 050km (20/07/30-09:37:53)
[03] 20/07/30-09:36:51 02 M3.9 34.3N 140.0E 050km (20/07/30-09:38:13)
[04] 20/07/30-09:36:51 02 M3.9 34.3N 140.0E 050km (20/07/30-09:38:33)
[05] 20/07/30-09:36:51 5+ M7.3 34.3N 140.0E 050km (20/07/30-09:38:52)
[06] 20/07/30-09:36:51 5+ M7.3 34.3N 140.0E 050km (20/07/30-09:39:12)
[07] 20/07/30-09:36:51 5+ M7.3 34.3N 140.0E 050km (20/07/30-09:39:21)
---------------------------------------------------------------------
(左から順に情報番号,震源時,最大予測震度,マグニチュード, 震央緯度,震央経度,震源深さ,電文発表時刻) from CEORKA
-------------------------------------------------------------------
Table2. Earthquake early warning reports. Information ID, Origin time, Maximum Intensity, JMA magnitude, Epicentral latitude, longitude, depth, and time to issue the report from the left.(ref. The Committee of Earthquake Observation and Research in the Kansai Area)
気象庁による緊急地震速報の内容
4.観測記録 (Observed Records)

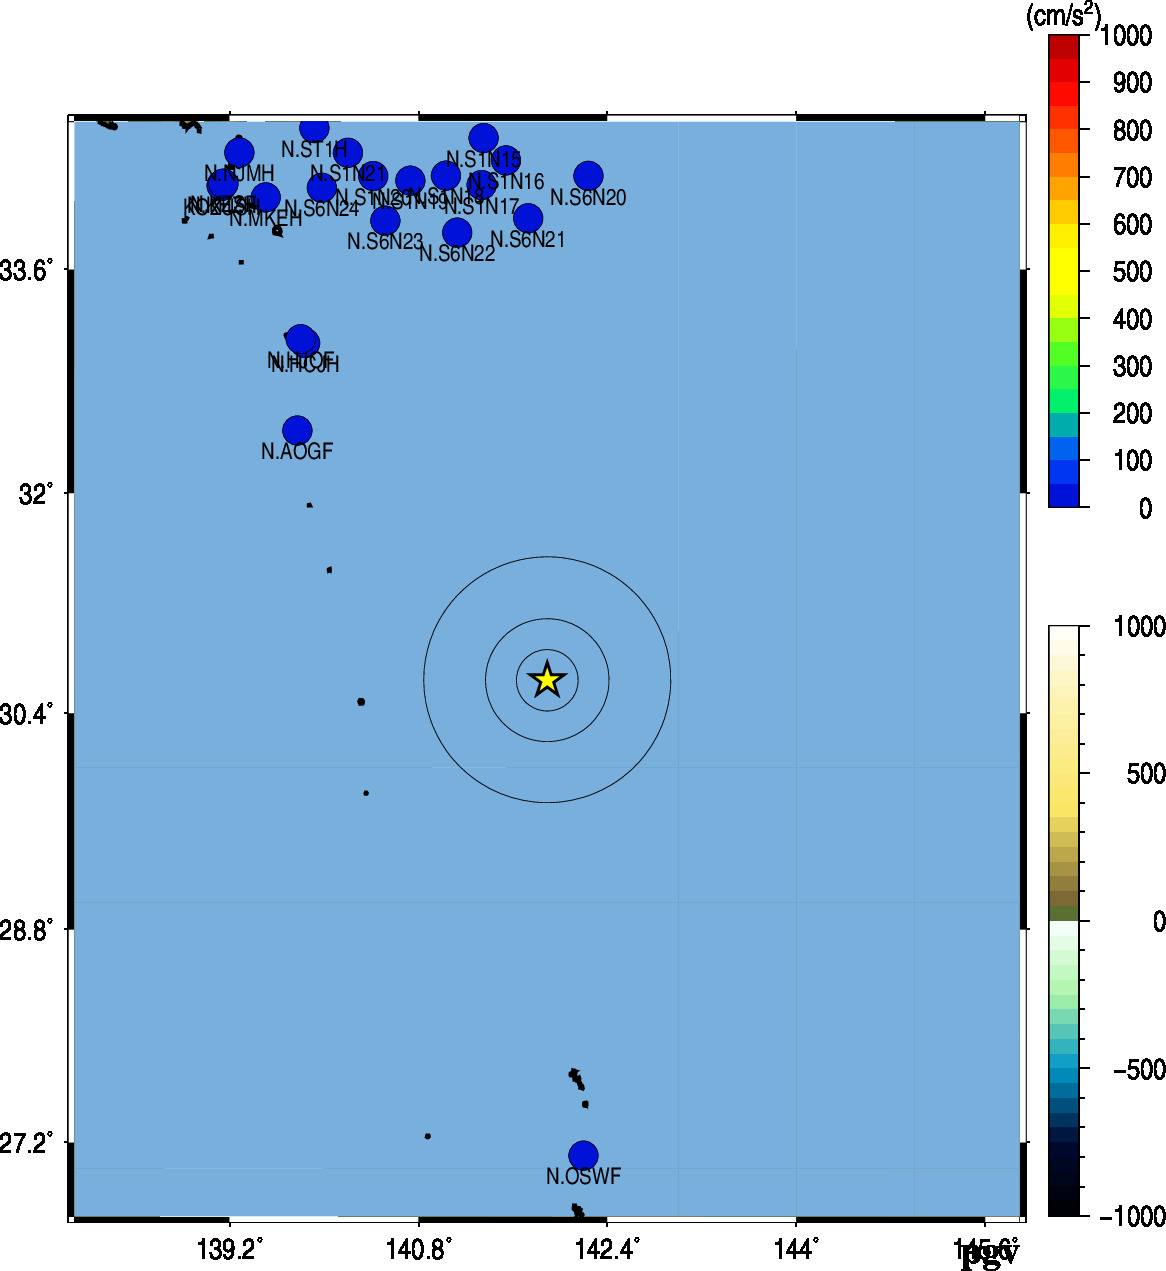
Fig.2. Peak Ground Acceleration (left) and Peak Ground Velocity (right).
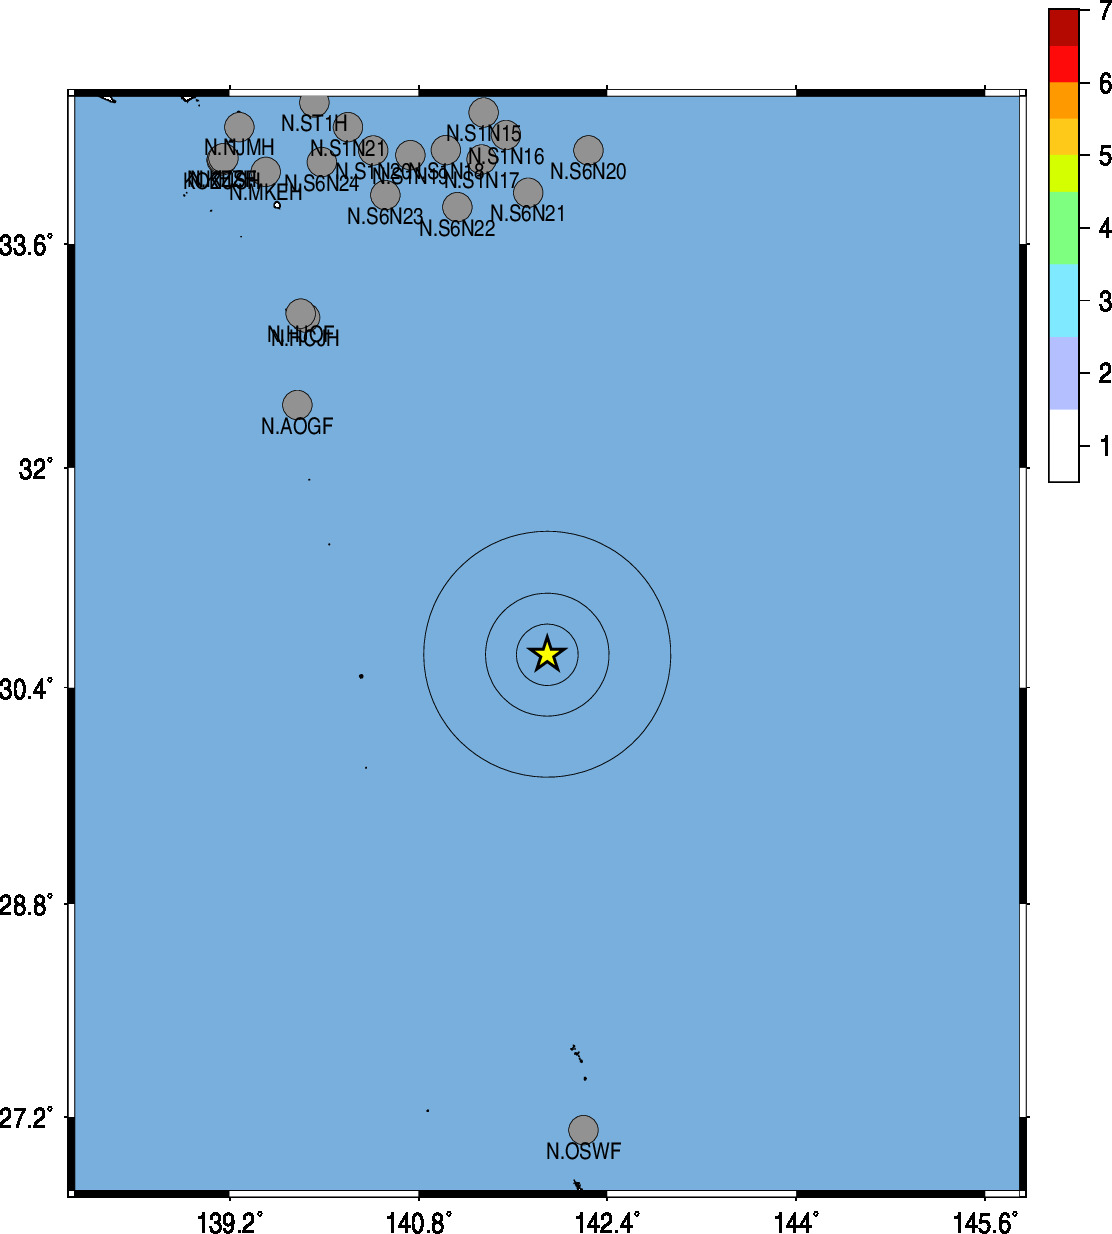
Fig.3. JMA shaking intensity.
5.解析結果 (Analytical Result)
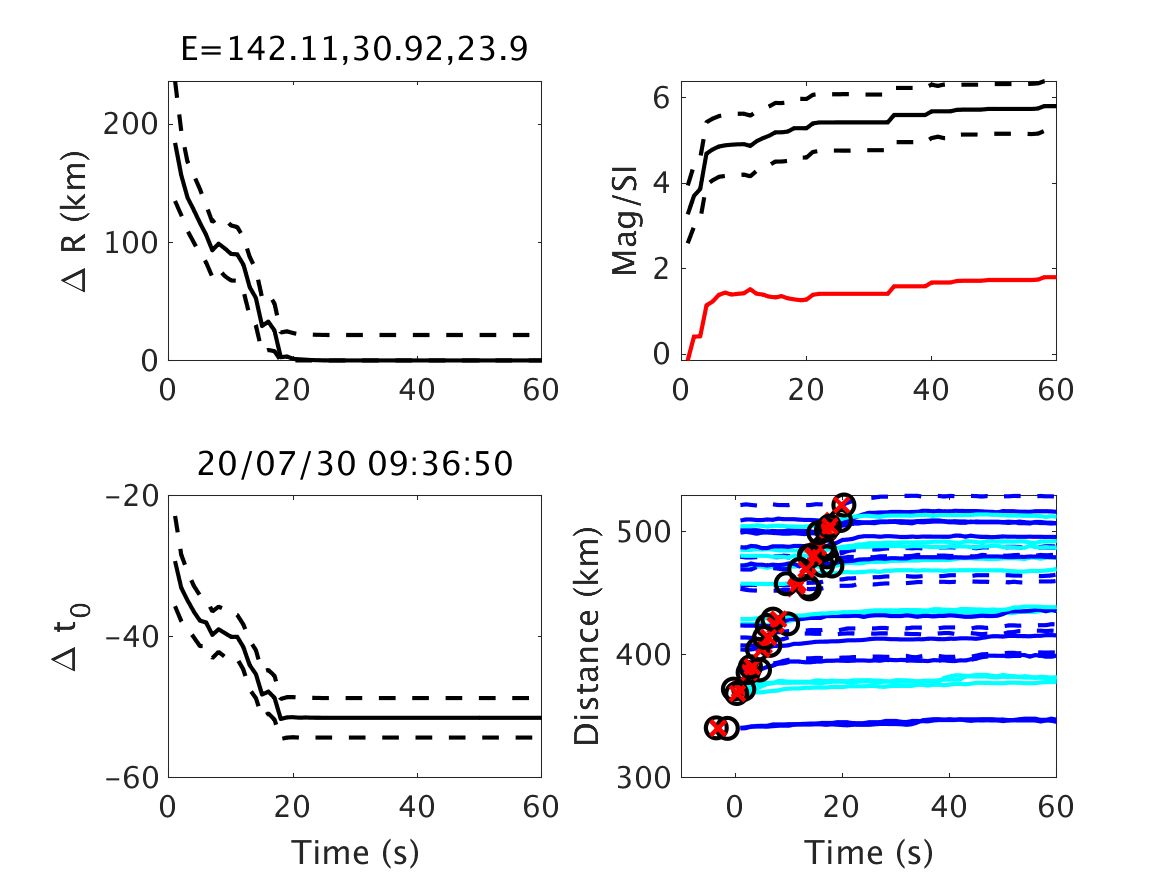
Fig.4. Time history of the estimates for source parameters by the IPF method. The error of epicenter, error of origin time, JMA magnitude/Shaking intensity (red line), automatic pick times are shown. The horizontal axis shows the time of processing.
Fig.5. Simulation of IPF method. The triangles show seismic stations, and colored triangles are triggered stations. The star shows the estimated location of an earthquake. The color of the samples is proportional to the likelihood of the hypocenter location.
Acknowledgements:
気象庁の震度情報、防災科学技術研究所のK-NET,KiK-net,Hi-net,S-netの波形、気象庁の強震波形、一元化震源カタログを利用しました。
緊急地震速報を発表した地震の解析結果
山田真澄 ホーム