JMA Seismic Intensity
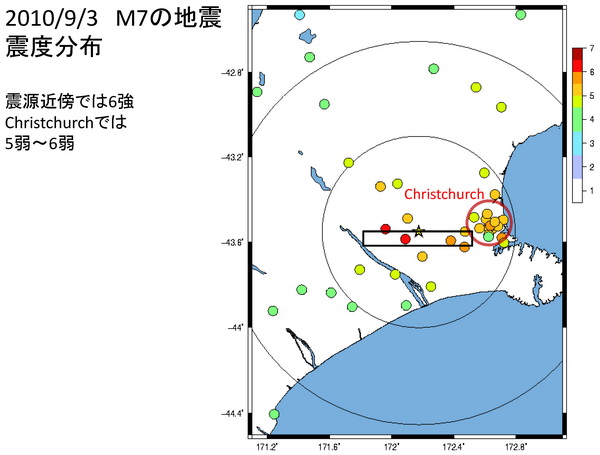
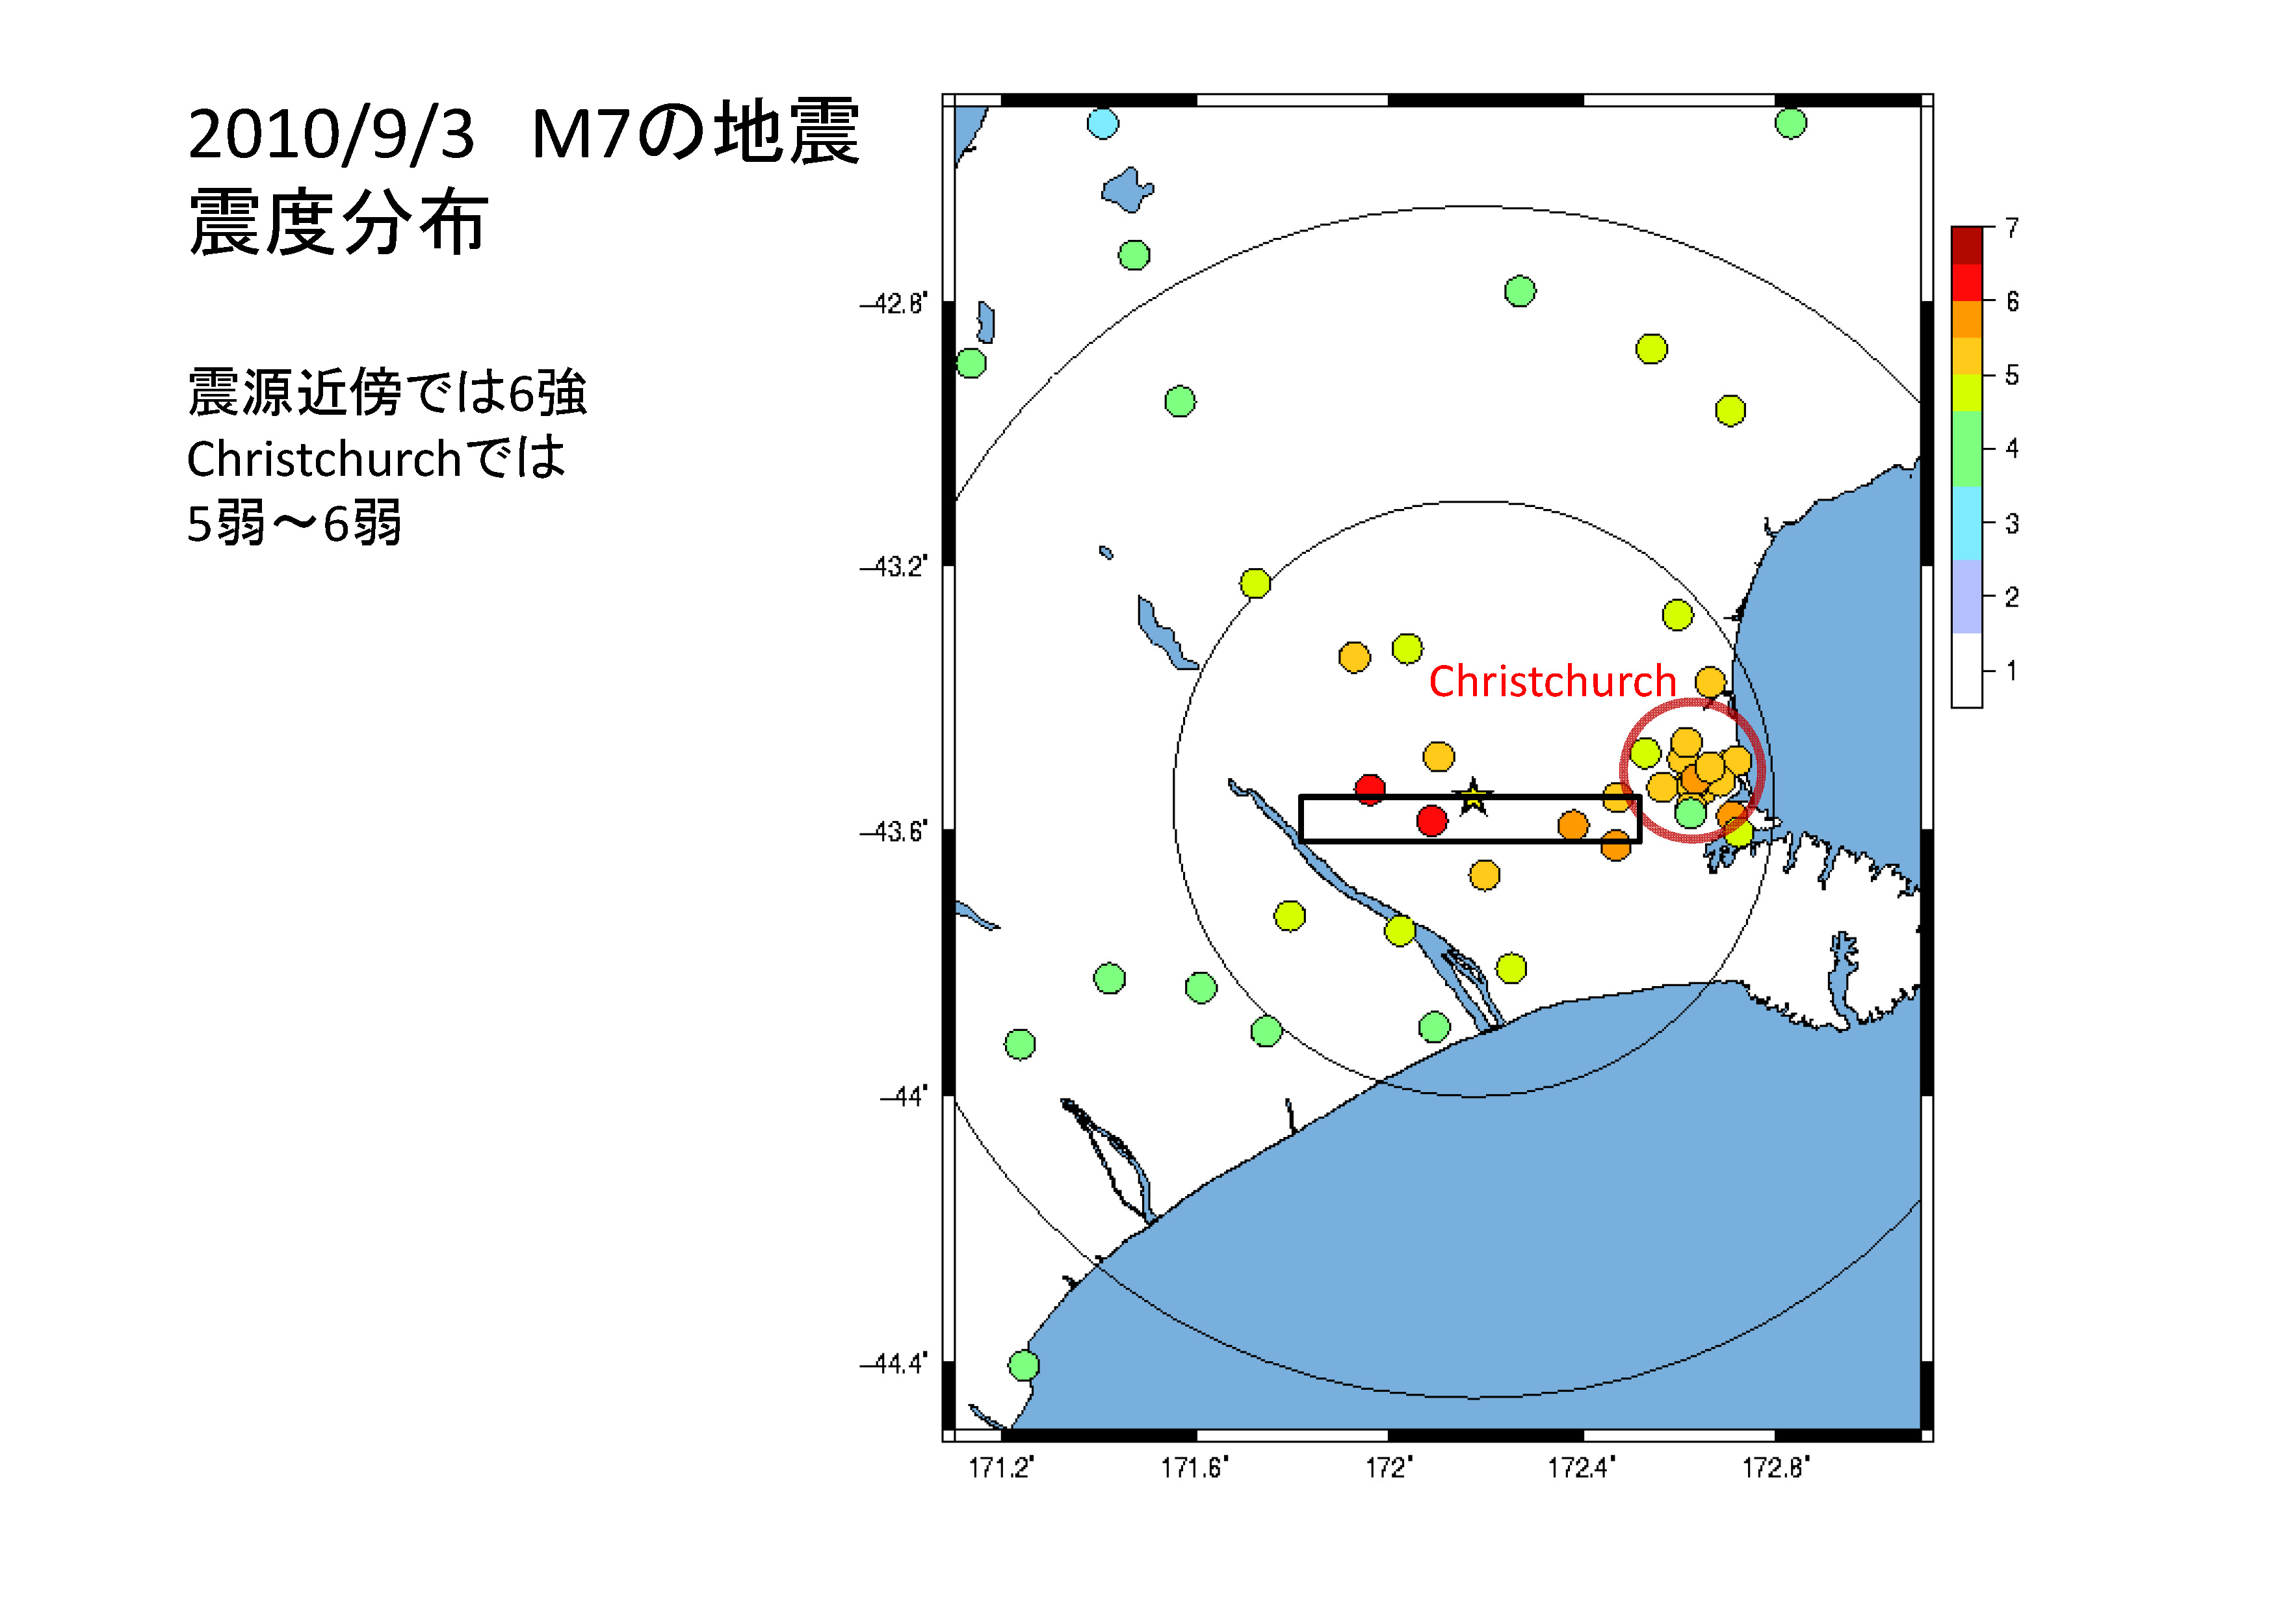
Fig 1 : Equivalent JMA (Japanese Meteorological Agency) seismic intensities of the September 3, 2010 Darfield earthquake (Mw7.0). JMA Intensity 6+ was recorded near the epicenter, but the intensities in Christchurch were around 5- to 5+. JMA intensities were calculated from the strong motion recordings of GNS. The table below shows a comparison of JMA and MM intensities.

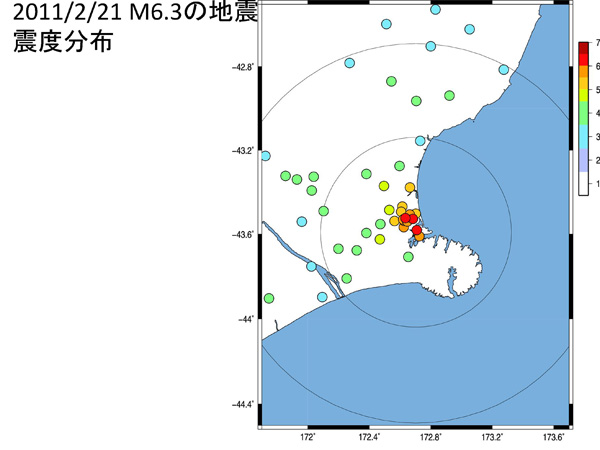
Fig 2 : Equivalent JMA seismic intensities of the February 21, 2011 Christchurch earthquake (Mw6.3). The epicenter is located in the eastern part of the aftershock area of the 2010 event. JMA Intensity 6+ was recorded at Heathcote Valley Primary School (HVPS)), Christchurch Resthaven (REHS) and Pages Road Pumping Station (PRPS).
Strong Motion Records
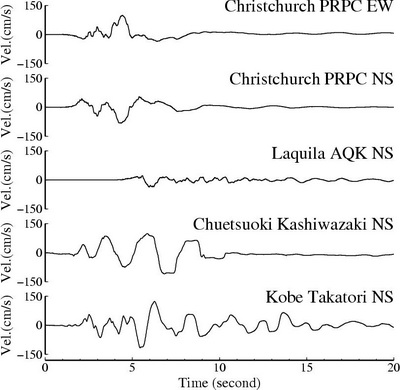
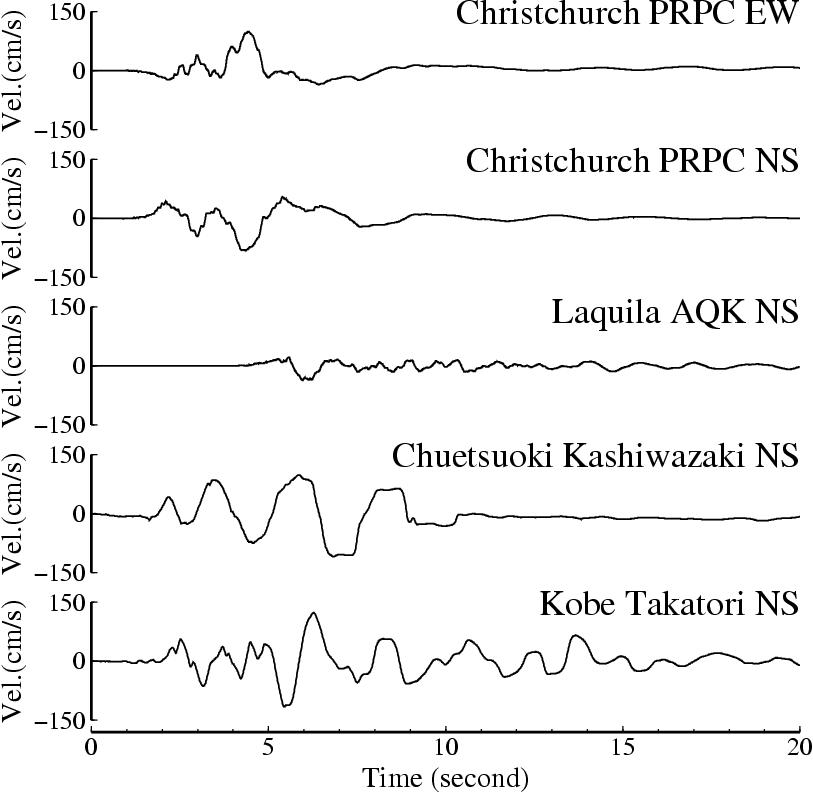
Fig 3 : Near-field velocity waveforms for several past earthquakes that have produced severe damage. The maximum velocity of the 2011 Christchurch earthquake is about 100 cm/s. This is about the same as that of 1995 Kobe and 2007 Chuetsu-oki earthquakes. A large pulse with periods of 1 to 2 second is observed for the Christchurch earthquake. This pulse may produce severe damage on structures. Even though the magnitude of the Christchurch earthquake is smaller than the Chuestoki (Mw6.6) and Kobe (Mw6.9) earthquakes, the character and amplitude of the ground velocity likely contributed to the large building damage.
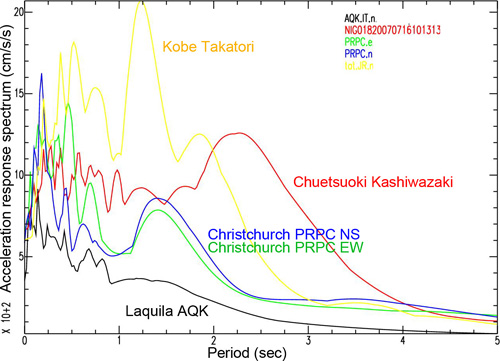
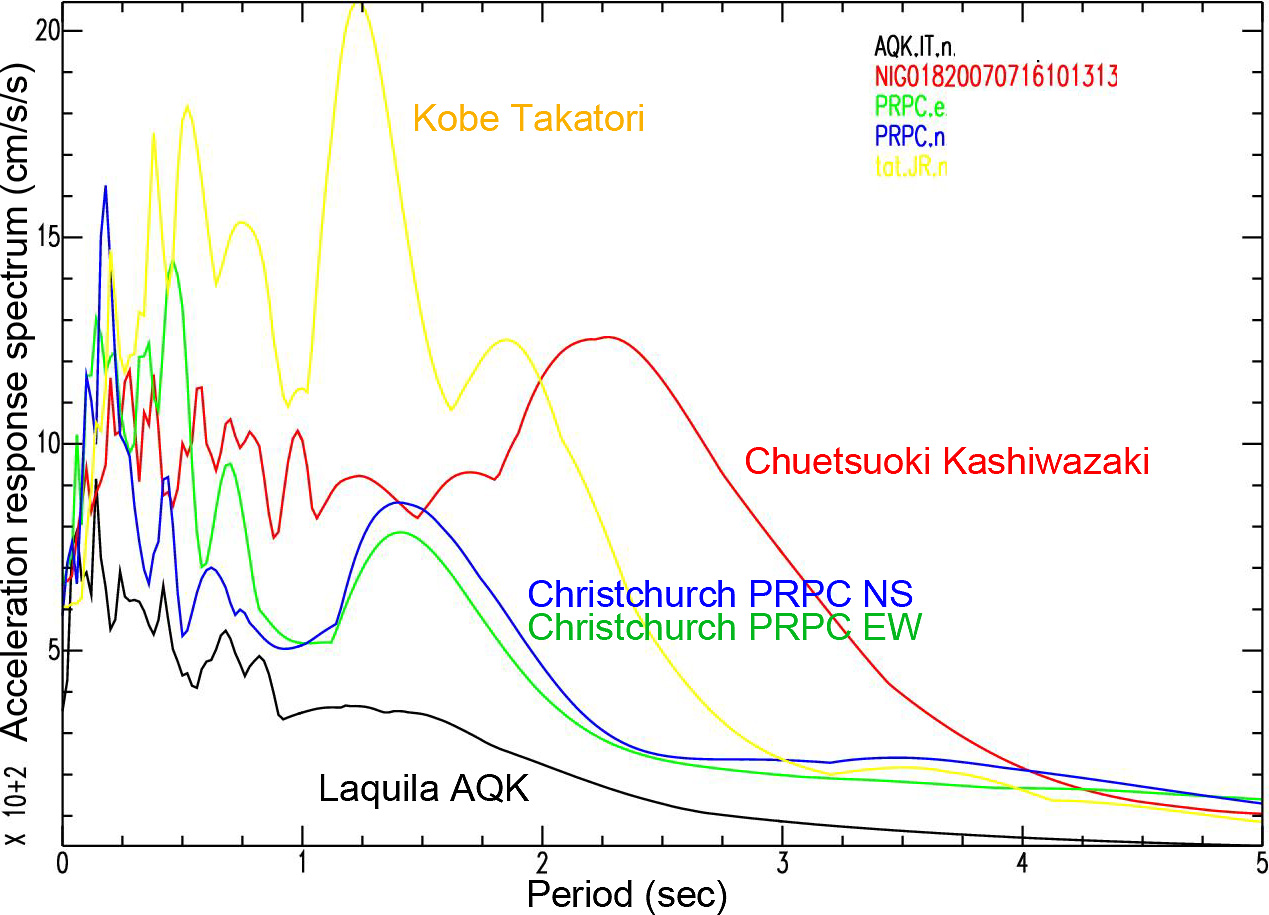
Fig 4 : Acceleration response spectra of records in Fig 3 (damping 5%).
Asymmetric Accelerations
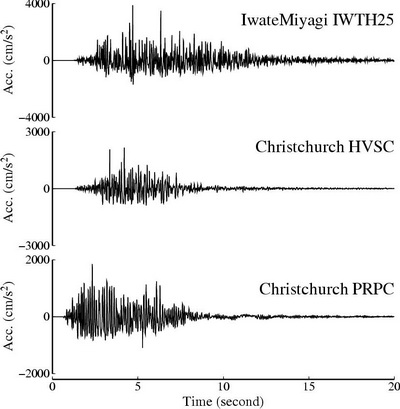
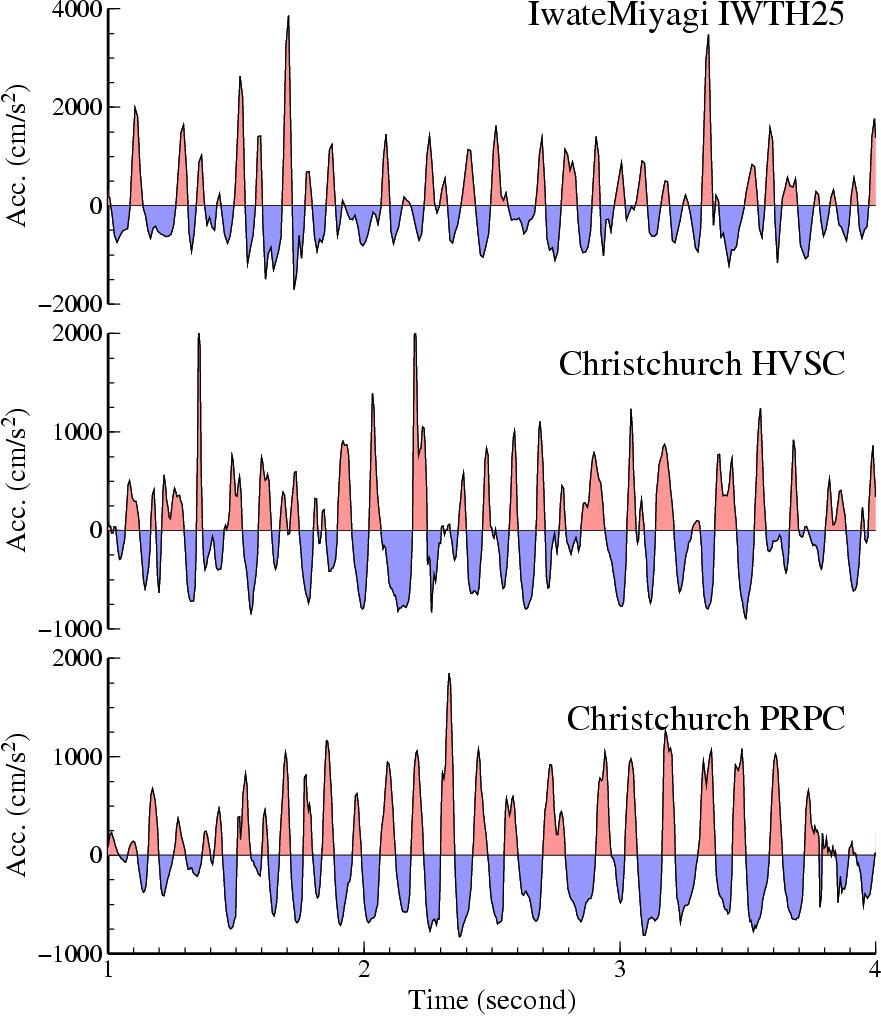
Fig 5 : Acceleration waveforms of large amplitude vertical records. For the 2011 Christchurch earthquake, asymmetric waveforms were observed with upward accelerations larger than downward accerlations. This is similar to the records from the 2008 Iwate-Miyagi Nairiku earthquake in Japan. Asymmetric waveforms may be produced when a near-surface layer slightly separates and then returns, striking the separation surface (Yamada et al., 2009, SRL).
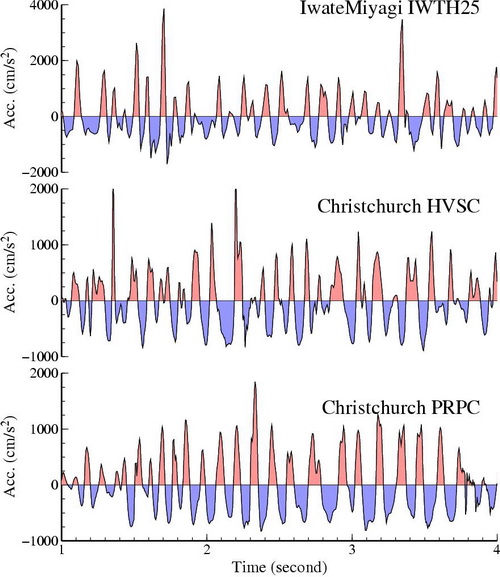
Fig 6 : Magnified view of waveforms in Fig 5. The upward accelerations (red) show narrow pulses with large amplitude, while the downward pulses (blue) are broader with smaller amplitude.
Historical Buildings
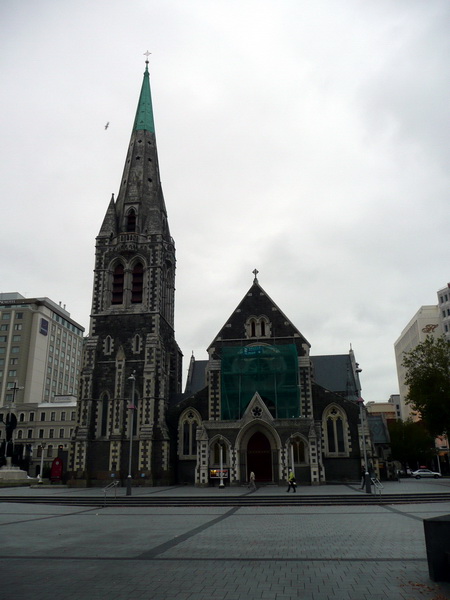
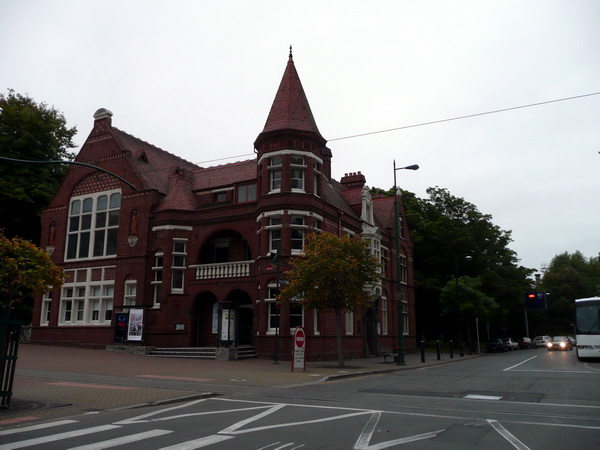
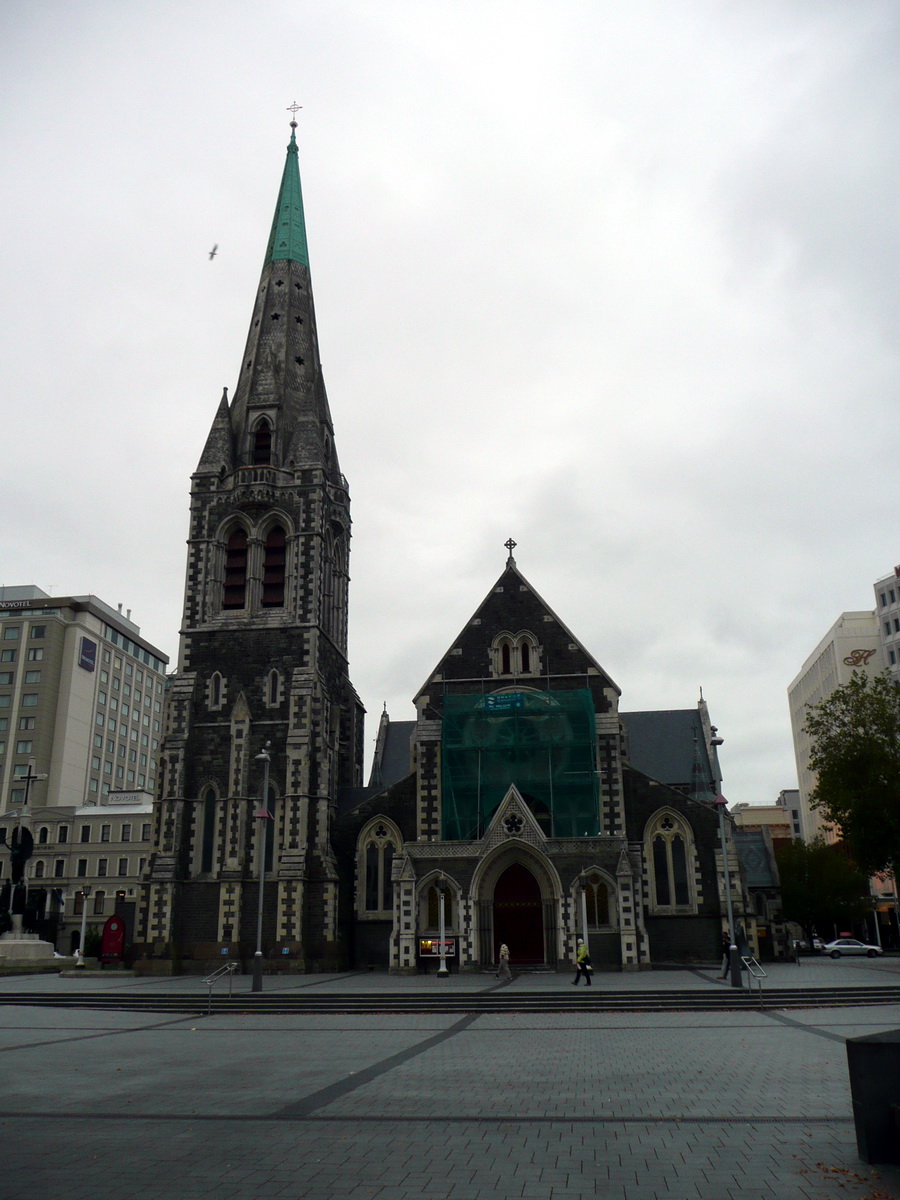
Photo : Historical buildings in Christchurch before the earthquake.
Acknowledgement : We used the data from GNS Science, NIED, and JR.
Reference:
- Yamada, M., J. Mori, and T. Heaton (2009).
The Slapdown Phase in High Acceleration Records of Large Earthquakes. Seismological Research Letters, No.80-4, pp. 559-564.
Masumi Yamada and Jim Mori(Kyoto University)
|