 Back Projection of the Rupture for the
2008 Eastern Sichuan
Earthquake
P
waveforms from about 700 Hi-Net stations in Japan were used in a back projection
analyses of the rupture for the May 12, 2008 Eastern Sichuan, China earthquake.
The stations in Japan are at a distance of about 25 to 30 degrees from the
earthquake. The data are low-passed at 0.2 hz.
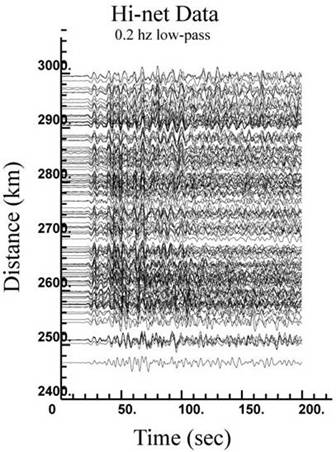
Fig. 1. Hi-net data for the P-wave
recorded in Japan. The waveforms have been aligned on the first arrival.
Method
The back-projection method
determines tests a grid of points to determine which is the best location for
the source of seismic radiation in each designated time window of the P wave.The
initial arrival of the first time window was assumed to come from the grid
point corresponding to the earthquake hypocenter. For each subsequent time
window (itim), the data were stacked assuming a source at each grid point (igrid) using the equation,
. 
where
s(igrid, itim) is the stack amplitude and t(ista, ipt) are time
series for each station, ista., that has time points, ipt..
Relative time shifts for each time series were calculated using the theoretical
travel times from the station to the grid point, using the IASPEI91
model. The
grid of the 290 tested source locations for each time window is shown below.
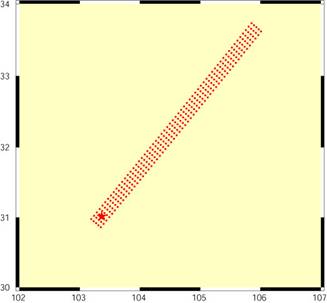
Figure 2. Grid of source locations tested
for each time window.
Results
The
results in the animation below show the rupture progresses from the epicenter
in the southwest toward the northeast. The rupture velocity appears to be
variable with an average speed of about 3 km/second.
Figure 3.
Animation of the rupture propagation.
Mori top page