 Back Projection of the Rupture for the
2006 West Java Earthquake
The July 17, 2006 earthquake (Mw7.7) off the
southern coast of West Java, Indonesia has been recognized as a tsunami
earthquake. The levels of high
frequency radiation were relatively low for the large moment of the event. Because the shaking was only felt weakly
or not at all in the coastal areas of southern Java, people did not leave the
beaches immediately following the earthquake, which resulted in over 600 deaths
from the large tsunami. This back
projection analysis shows the slow rupture speed for this tsunami earthquake.
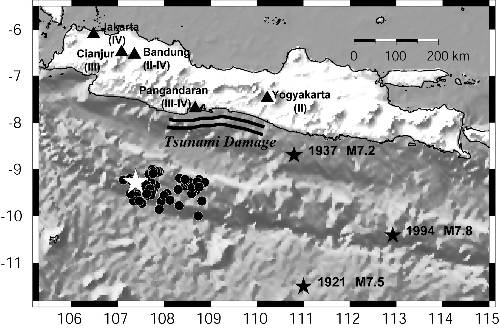
Fig. 1. White star and black circles show the locations
of the mainshock and aftershocks, respectively, of the West Java earthquake.
Roman numerals show the level of intensity at location on Java. Black stars
show locations of other significant events in the region.
Data
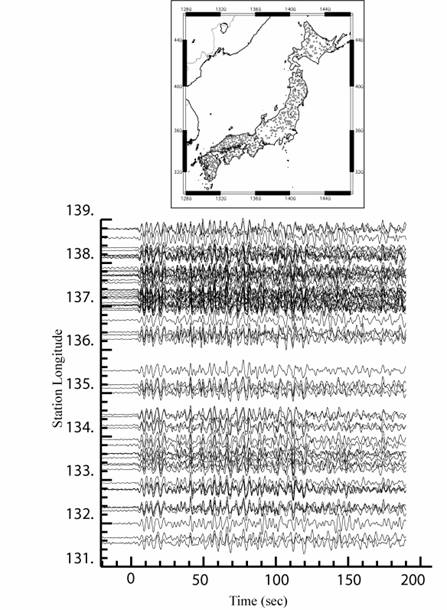
P
waveforms from about 700 Hi-Net stations in Japan were used in a back
projection analyses of the rupture for the earthquake. The stations in Japan
are at a distance of about 52 to 70 degrees from the earthquake. The data are
low-passed at 0.2 hz.
![]()
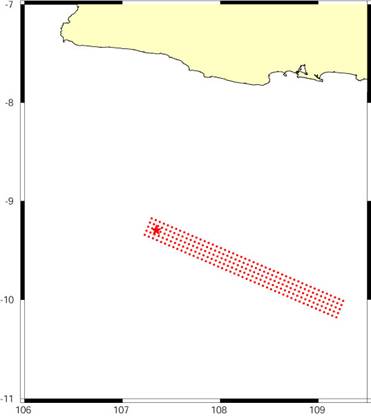
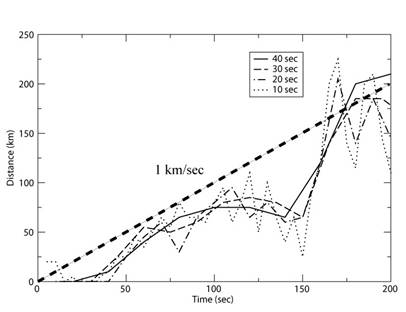
Fig. 5.
The position of the rupture front as a function of time. The different lines are for different
length time windows in the analysis. The dotted line shows a rupture
propagation of 1 km/sec.