Rupture Process of the April 11,
2012 Sumatra (Mw 8.6) Earthquake
Imaged with Back-Projection of
Hi-net data.
Dun Wang and Jim Mori
(GRL, in press)
Methods and Data
We applied a back-projection analysis
to study the rupture process. The back-projection was done using the same
method described in Wang and Mori (2011).
P waveforms from Hi-net stations
were used in a back projection analysis of the rupture for this earthquake. We
used unfiltered Hi-net data (vertical components) for the back projection. The stations in Japan at distances of about 41 to 61 degrees from
the earthquake epicenter. The azimuth is about 45 degrees.
Results
The
results show a complex pattern of four conjugate faults over about 180 sec
(see Figure 1).
There is a striking correspondence between the lengths and orientations of our
rupture pattern with the distribution of aftershocks. Each of the first three
stages of the rupture corresponds to a clear lineation in the aftershocks, with
lengths of 200 to 400 km
(Figure 2).
Rupture speeds for several of the fault segments were very high, about 5 km/s, and exceed the local S-wave velocity (Figure 3). This is the first example of an
oceanic earthquake with supershear rupture speed
Figure
1. Animation of the rupture propagation.
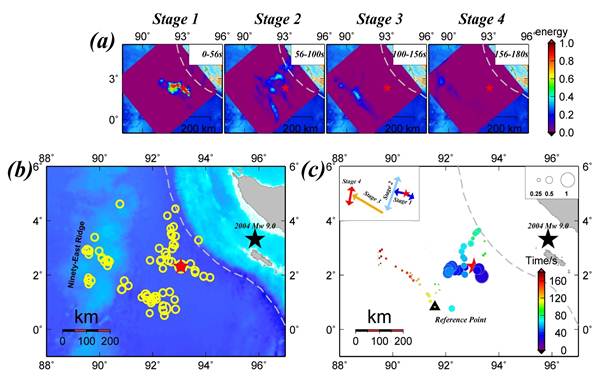
Figure 2. Rupture propagation
and radiated energies. (a) Cumulative short-period radiated energy of the 2012
Mw 8.6 Sumatra earthquake for Stage 1, 2, 3 and 4. (b) Locations of aftershocks
(yellow open circle) that occurred two days following the mainshock.
The red and black stars indicate the USGS determined epicenters for the 2012
Off Northern Sumatra (Mw 8.6) and 2004 Sumatra-Andaman (Mw 9.1),
respectively. (c) Locations, timings and amplitudes for the stack with the
maximum correlation at each time step (2 s). The dashed gray line is the
Sumatra trench. The black triangle indicates the reference point for
calculating the rupture speed for Stages 3 and 4. Left small inset shows a
model for the four Stages.
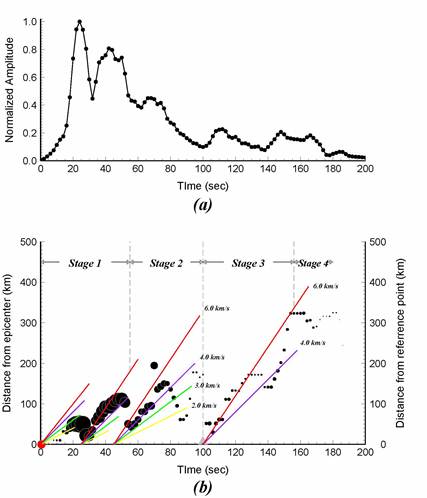
Figure 3. Rupture speed and
energy release. (a) Normalized value of the maximum amplitudes (sums of squared
amplitude stacks) in each time window as a function of time. (b) Distance as a function
of time for the locations of the maximum stack amplitude in each time window,
as measured from the epicenter for the first 100 s and from the location of the
reference point shown in Figure 2c after 100 s. The colored lines show the
slopes of rupture speeds for reference.
References
Wang, D. J. Mori, and T. Uchide (2012), Supershear rupture on multiple
faults for the Mw 8.6 Off Northern Sumatra, Indonesia earthquake of April
11, 2012, Geophys. Res. Lett., 39, L21307,
doi:10.1029/2012GL053622.
Wang, D. and J.
Mori, Rupture Process of the 2011 off the Pacific Coast of
Tohoku Earthquake (Mw 9.0) as Imaged with Back-Projection of Teleseismic P-waves, Earth, Planets and Space,
63, 603-608, doi:10.5047/eps.2011.05.029, 2011.