Reports on fieldworks of damaged area caused by
September 2, 2009
Mw 7.0
Andri Dian Nugraha, Kyoto University
The earthquake occurred on September 2, 2009, at 14.55 PM local time in the southern part of West Java Indonesia with magnitude of 7.0 (Mw) and depth of 46.2 km determined by USGS (Fig 1 and 2). This event has reverse fault faulting with striking NE-SW direction. In the southern part of Java, the oceanic India-Australia plate subducts North-Northeastward beneath Sunda plate with a relative velocity about 60 cm/year.
In order to investigate and understanding the effect of this event, We conducted fieldworks in the damaged area. We conducted survey from September 9, 2009 up to September 16, 2009. First, before go to the fieldworks We visited Bandung Institute of technology (ITB) to discuss about this event with Prof Sri Widiyantoro (Geophysics Group ITB), Afnimar PhD (Geophysic Group ITB), and Dr Irwan Meilano (Geodesy Group ITB).
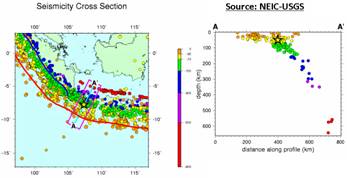
Figure 1. Figure shows seismicity in the
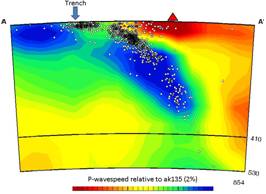
Figure 2. Figure shows P-wave velocity
perturbation structure [Widiyantoro,
2009, In Preparation] along with
seismicty (white circles) and Mw 7.0 event (filled red star) through vertical
cross section AA’ (In Figure 1). Blue colors indicate high velocity
India-Australia oceanic plate subducting beneath Sunda plate.
This earthquake caused small Tsunami, severe damaged, people killed, landslide, and trigger small mud volcano.
A. Tsunami
Badan Meteorologi Klimatologi dan Geofisika Indonesia (BMKG) issued Tsunami Early Warning (TEW) about 3 minutes 44 seconds after this earthquake occurred. However, after 1 hour 10 minutes 54 seconds, the Tsunami warning lifted. BMKG observed the Tide Gauge station in Pelabuhan Ratu and Pameungpeuk. At 15.02 PM local time, Tide Gauge station in Pameungpeuk (Figure 3) recorded anomaly of mean sea level of about 100 cm while in Pelabuhan Ratu station recorded anomaly of about 20 cm at 15.18 PM local time.
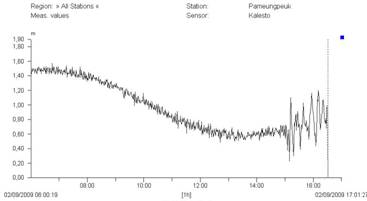
Figure 3. Figure shows Tsunami wave
recorded in Pameungpeuk [Source: BAKOSURTANAL Indonesia].
This earthquake also triggered large landslide in Cikangkareng-Cianjur (Figure 4) that caused about 43 people killed, 20 people missing, severe damage, and 13 houses buried.
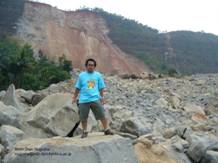

Figure 4. Figure shows large landslide that
are triggered by the earthquake in Cikangkareng-Cianjur. 43 people killed (20
people still missing) and 13 houses buried.
Location on the Google Map
C.
Damaged Houses, Damaged Buildings, Damaged School, and Victims
We visited the area which suffered severe damaged such as Pangalengan, Cikangkareng-Cianjur, Sindangbarang-Cianjur, Cikelet-Garut, Pameungpeuk-Garut, Cisompet-Garut, Cigalontang-Tasikmalaya, Darmacaang Cikoneng Ciamis, and Sukahening-Tasikmalaya. We conducted observation and correspondence with a local people to estimate intensity and damage house relative index. We show here our estimation of intensity for observation point during fieldworks (Figure 5).
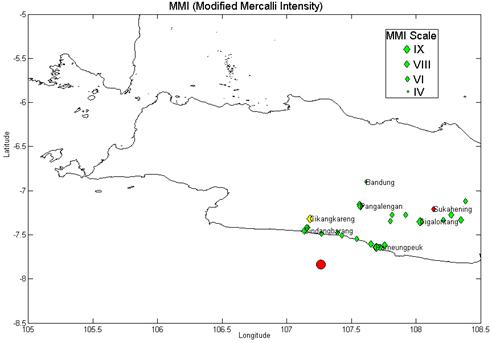
Figure 5. Figure shows estimation of
intensity map (MMI Scale) for observation point during the field work. Red
circle indicates the epicenter of earthquake. Green diamonds with different
sizes indicate intensity scale for each observation point. Yellow diamond
indicates the region where landslide occurred in Cikangkareng-Cianjur while red
diamond indicates the place where small mud volcano erupted after the
earthquake.
We can see clearly from Figure 5 that Pangalengan, Cikangkareng, Sindangbarang, Pameungpeuk, and Cigalontang has severe damaged with high intensity (MMI). There are many houses collapse and people killed. Interestingly, even though Pangalengan and Cigalontang relatively far distant from the epicenter show severe damage locally and ground cracked. These phenomenon need further investigation and collaboration with others study.
I also calculated damaged house relative index (DHRI) ranging from slight, moderate, and heavy damage (Figure 6). This estimation based on visual inspection during the fieldworks.
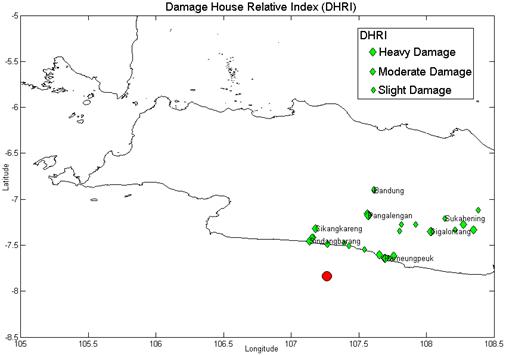
Figure 6. Figure shows estimation of DHRI
map for observation point during the field work. Red circle indicates the
epicenter of earthquake. Green diamonds with different sizes indicate DHRI
scale for each observation point.
The heaviest damage house regions occur in Pangalengan, Pameungpeuk-Garut, and Cigalontang-Tasikmalaya. Below are some photographs that were taken during the field works.
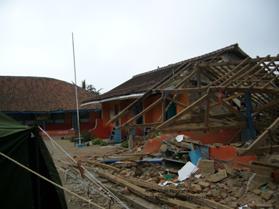
Figure 7. Damaged elementary school in
Pangalengan
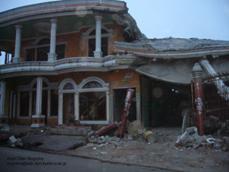
Figure 8. Damaged house in Pangalengan
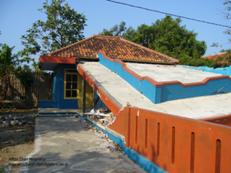
Figure 9. Damaged house in Cikelet-Garut
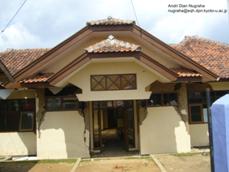
Figure 10. Damaged house in
Cigalontang-Tasikmalaya
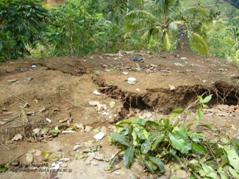
Figure 11. Ground Cracked in
Cigalontang-Tasikmalaya after the earthquake
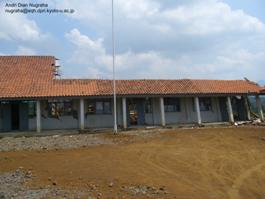
Figure 12. Damaged Senior High School in
Cigalontang-Tasikmalaya
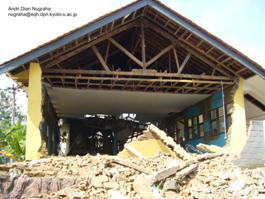
Figure 13. Damaged
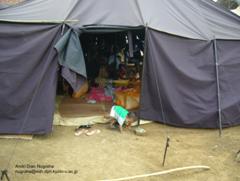
Figure 14. Tents
in Cigalontang-Tasikmalaya

Figure 15. Damaged
According to Badan Nasional Penanggulangan Bencana (BNPB) has reported up to September 13, 2009 at 16.00 PM local time, there are 81 people died, 45 people missing, 1238 injured, and 177,490 evacuated in West Java. Also for Damaged houses and building, they reported as follows:
- Houses (Heavy damage: 65,738; Moderate damage: 36,336; Slight Damage: 122,977)
- Praying Place (Heavy damage: 2,417; Moderate damage: 569; Slight Damage: 2847)
- School (Heavy damage: 2,109; Moderate damage: 1,049; Slight Damage: 2,106)
- Pesantren (Heavy damage: 13; Slight damage: 55)
D.
Small Mud Volcano
This earthquake also has been reported triggered a small mud volcano in Sukahening-Tasikmalaya. I also visited this place. Figure 16 shows the location of small mud volcano. This small mud volcano erupted after the earthquake occurred and the height of blow up reached 2 meters soon after the earthquake on September 2, 2009, however, it is getting lower now.


Figure 16. Figure shows the location of
small mud volcano that are triggered by this event in Sukahening-Tasikmalaya.
E. Summary
The September 2, 2009 Mw 7.0 Tasikmalaya Earthquake caused:
- Severe damage in houses, office building, prayer place, and school especially in Pangalengan, Sindangbarang-Cianjur, Cikelet-Garut, Pameungpeuk-Garut, Cigalontang-Tasikmalaya, Darmacaang-Cikoneng-Ciamis.
- At least 81 people died due to this earthquake in
- Landslide in Cikangkareng-Cianjur.
- Small Tsunami wave about 16 cm in Pelabuhan Ratu and 100 cm in Pameungpeuk. BMKG Indonesia issued Tsunami Early Warning 3 minutes 44 seconds after this earthquake occurred.
- Small Mud Volcano in Sukahening-Tasikmalaya. After the earthquake, the height of small mud volcano reached 2 meter and it’s getting lower now.