━━━━━━━━━━━━━━━━━━━━━━━━
2022年3月16日 福島県沖の地震 (M7.4)
━━━━━━━━━━━━━━━━━━━━━━━━
地震波検知時刻は地震発生の13秒後、一般向けの緊急地震速報発表時刻はその10秒後でした。 地震の検知自体はできましたが、震源の場所やマグニチュードは初期値から変化していません。震源決定ができなかった場合、仮想震源を最初に地震を検知した観測点の場所に、マグニチュードを1とするように決められています(参考:p.12)。そのため、この地震は震源決定はできていない可能性があります。 この地震は、地震波の伝播をモニタリングするPLUM法のみで検知し、IPF法による震源決定はうまく機能しなかったようです。
我々も防災科学技術研究所のHi-netとS-netのデータを利用して、現在の緊急地震速報と同じ手法(IPF法)で解析しました。地震の検知時刻は気象庁のシステムよりも4秒程度早く、震源の場所も最初の推定から精度よく決められました。IPF法による震源決定が適切に行われていれば、より早い時間に一般向けの緊急地震速報を出せた可能性があります。
1.地震について (Earthquake Information)
----------------------------------------------------2022/03/16,23:36:32.63 37.697 141.623 56.6 7.4
----------------------------------------------------
Table1. Earthquake information. Origin time, Epicentral latitude, longitude, depth, and JMA magnitude from the left.(ref. JMA catalog)
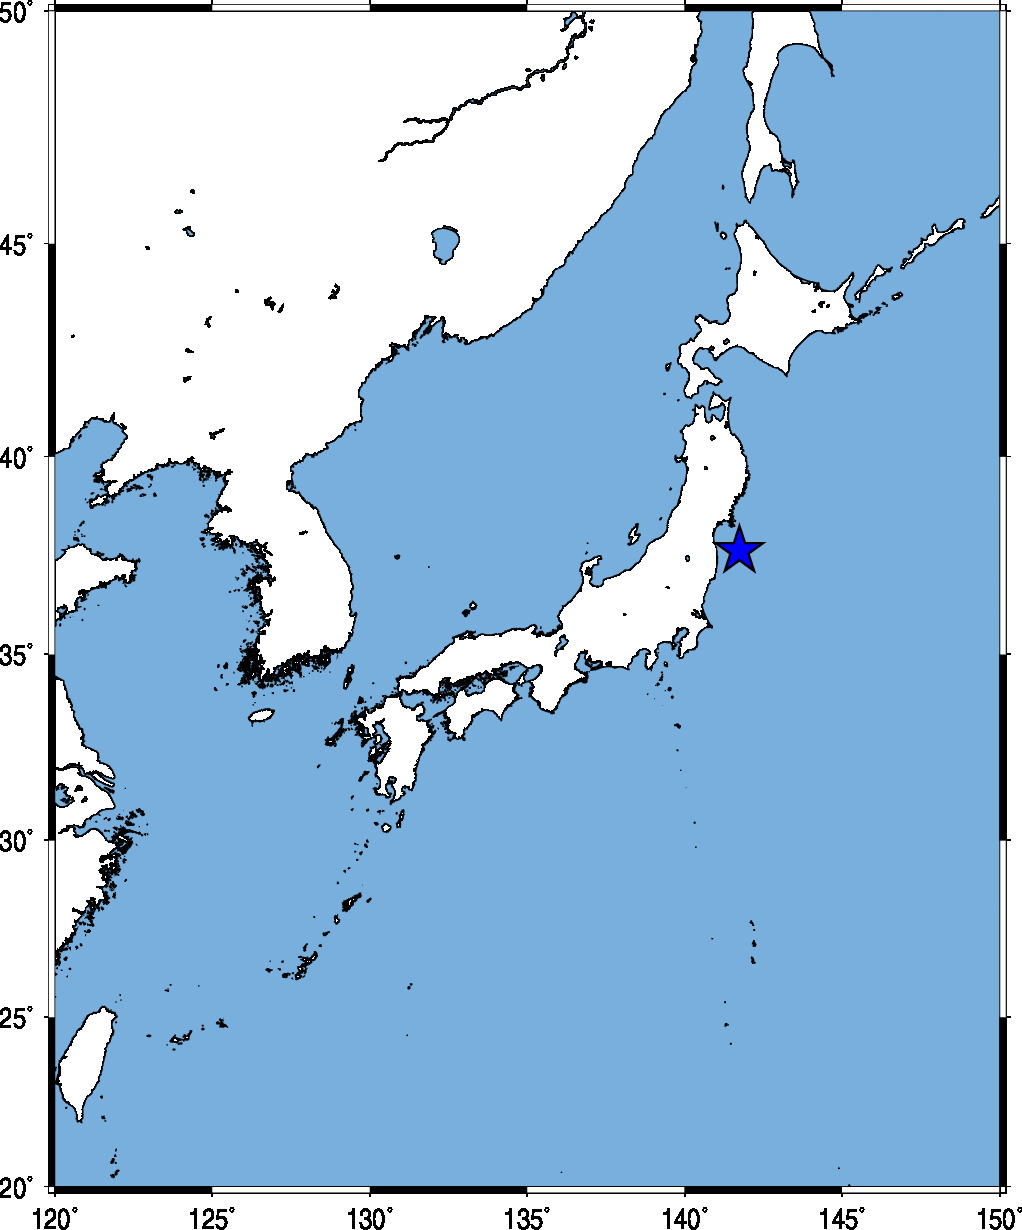
Fig.1. Event location.
2.観測点分布 (Station Distribution)
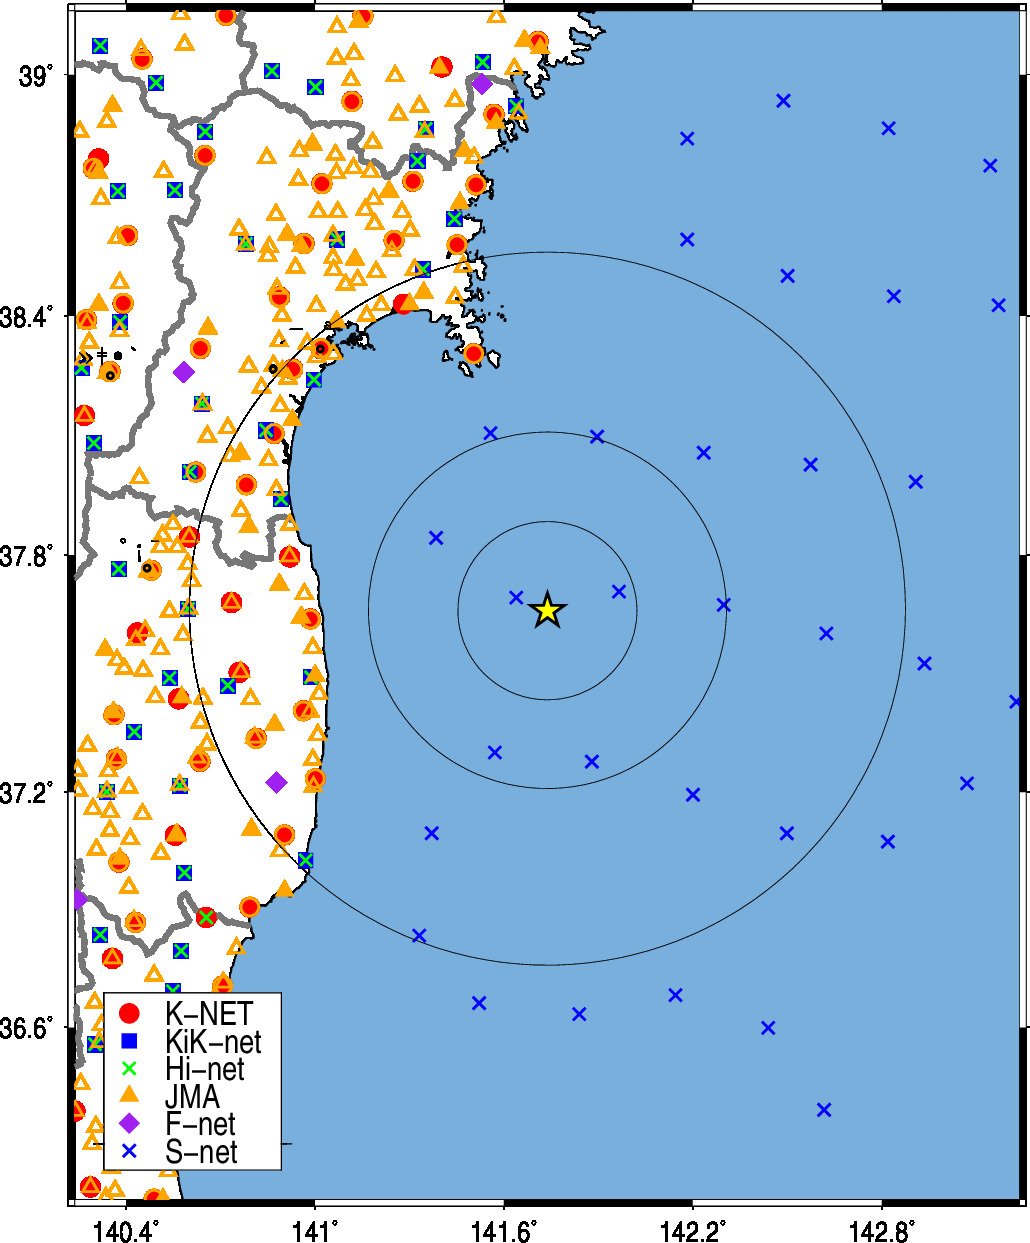
Fig.2. Station Distribution.
3.緊急地震速報発信状況 (Earthquake Early Warning Report)
-------------------------------------------------------------------[62] 22/03/16-23:36:44 6+ M1.0 37.5N 141.0E 010km (22/03/16-23:38:33)
[70] 22/03/16-23:36:44 6+ M1.0 37.5N 141.0E 010km (22/03/16-23:41:12)
---------------------------------------------------------------------
(左から順に情報番号,震源時,最大予測震度,マグニチュード, 震央緯度,震央経度,震源深さ,電文発表時刻) from CEORKA
-------------------------------------------------------------------
Table2. Earthquake early warning reports. Information ID, Origin time, Maximum Intensity, JMA magnitude, Epicentral latitude, longitude, depth, and time to issue the report from the left.(ref. The Committee of Earthquake Observation and Research in the Kansai Area)
気象庁による緊急地震速報の内容
4.観測記録 (Observed Records)
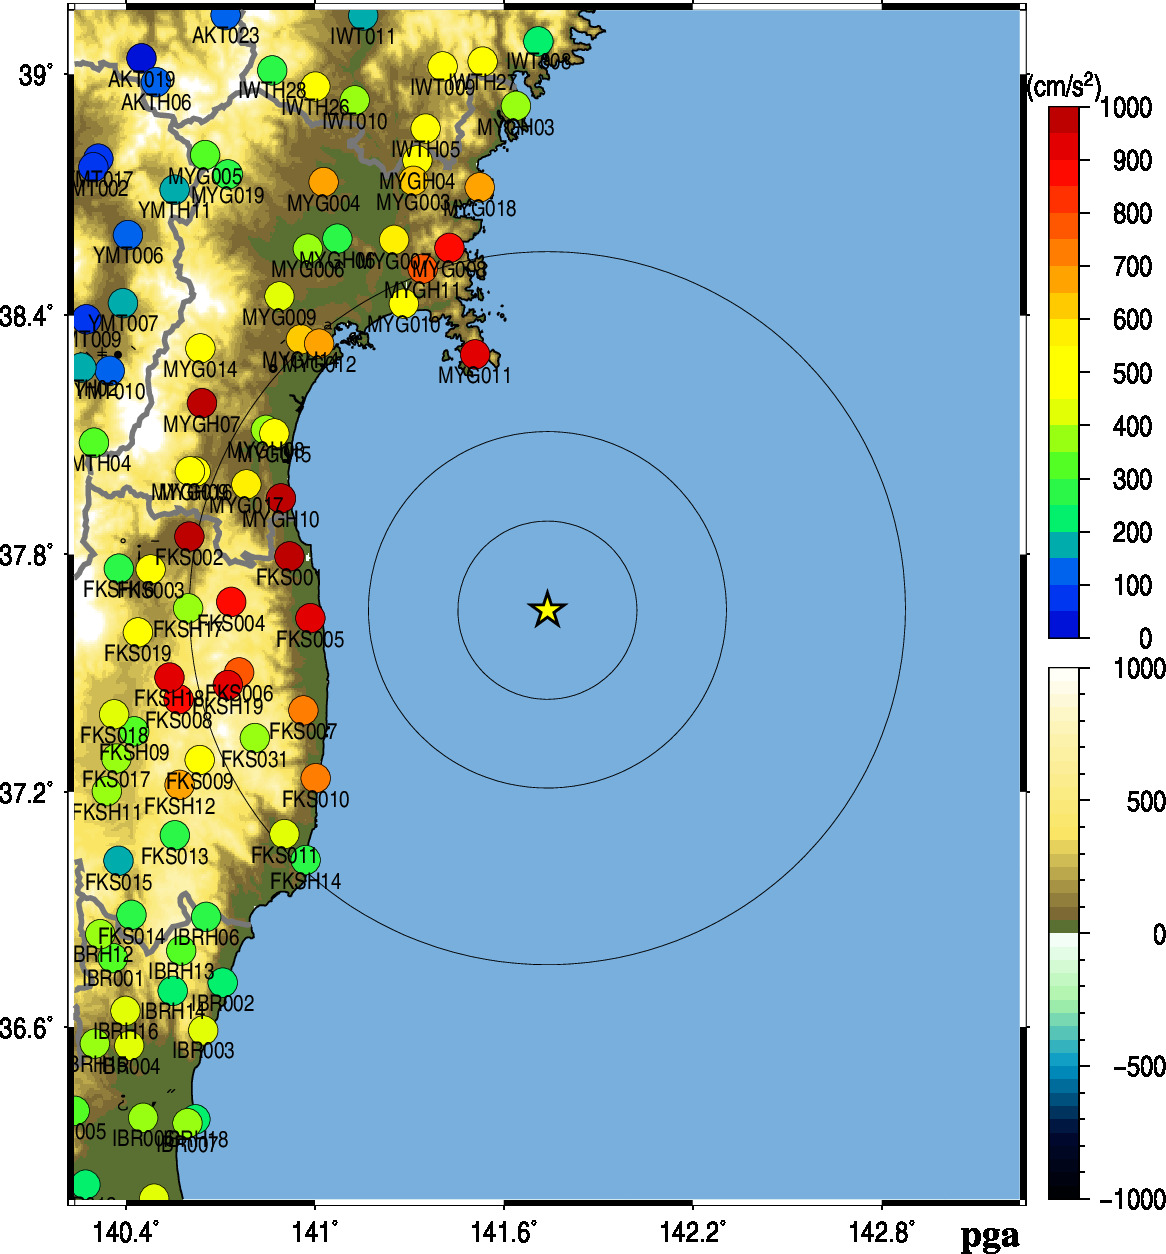
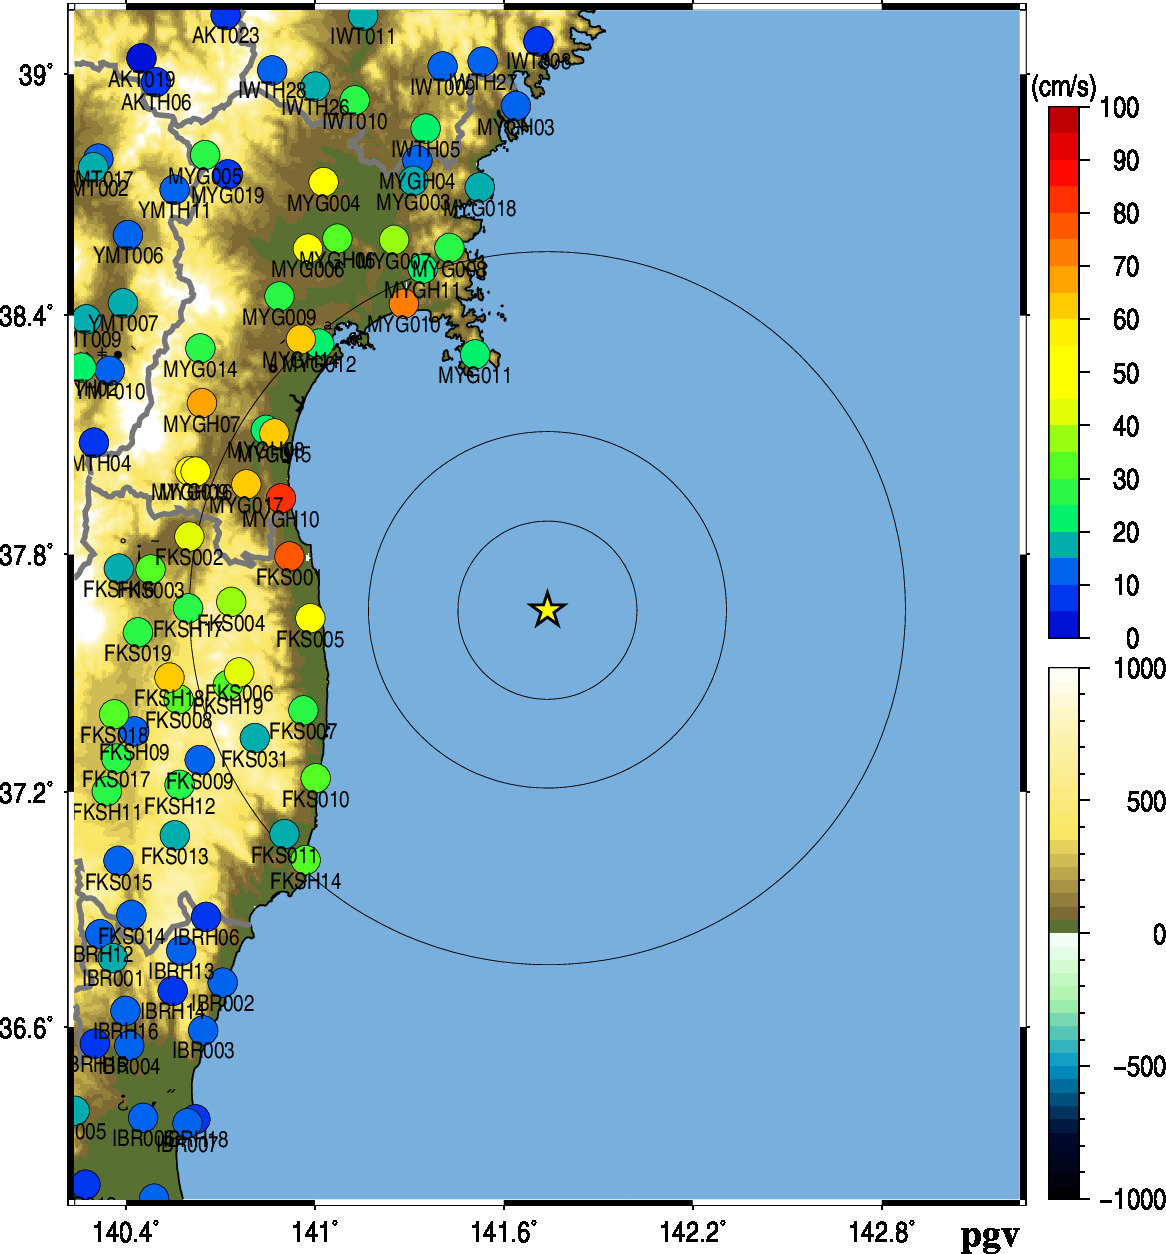
Fig.2. Peak Ground Acceleration (left) and Peak Ground Velocity (right).
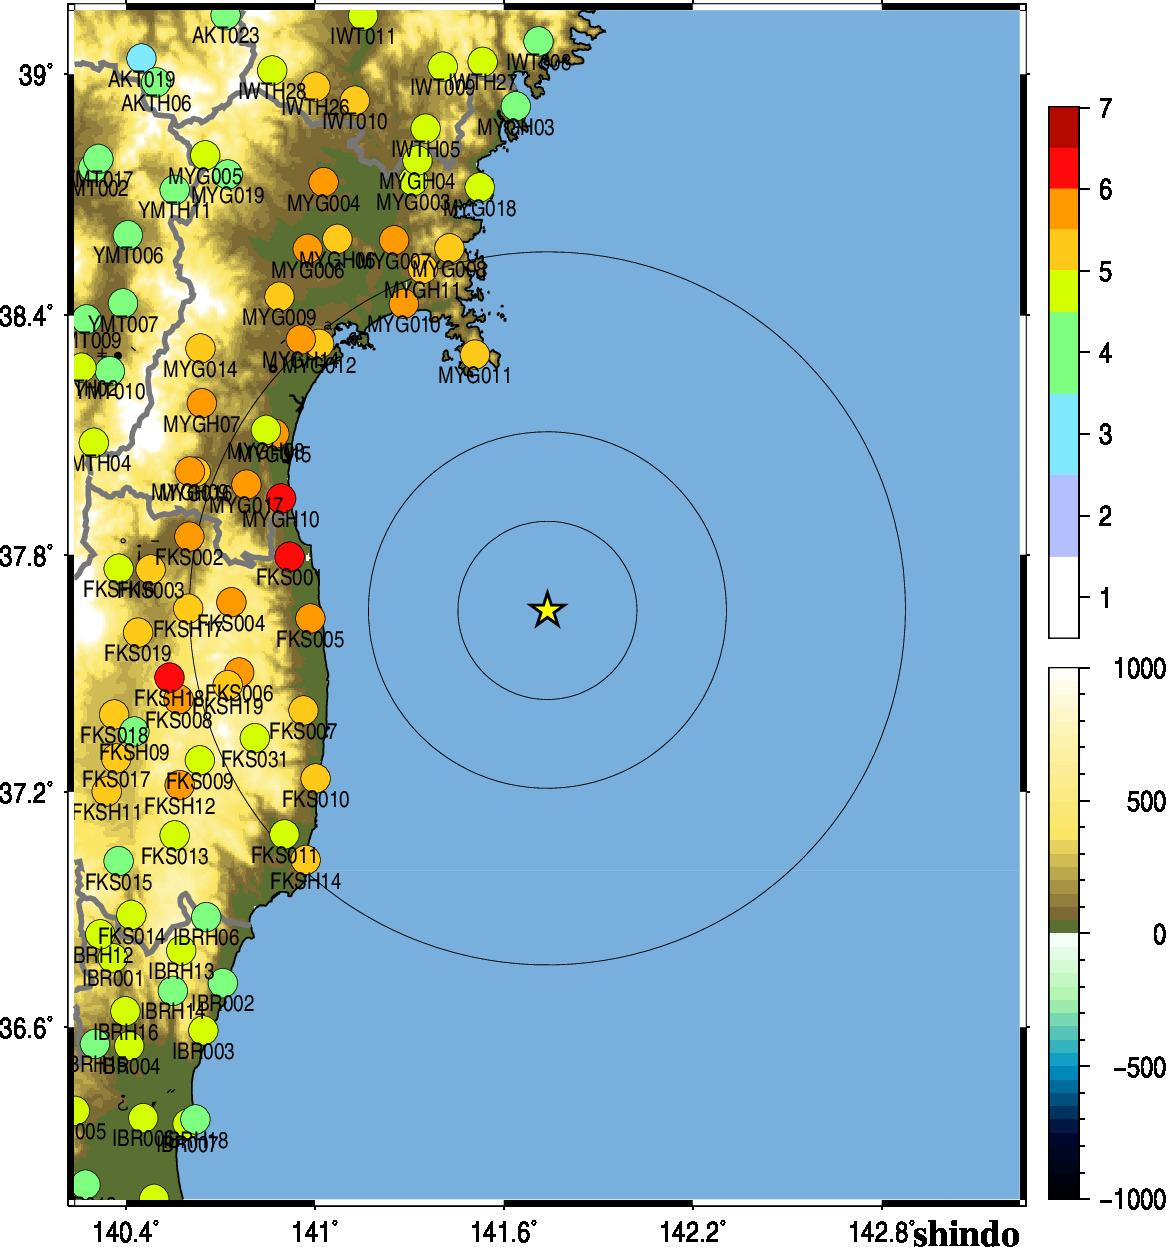
Fig.3. JMA shaking intensity.
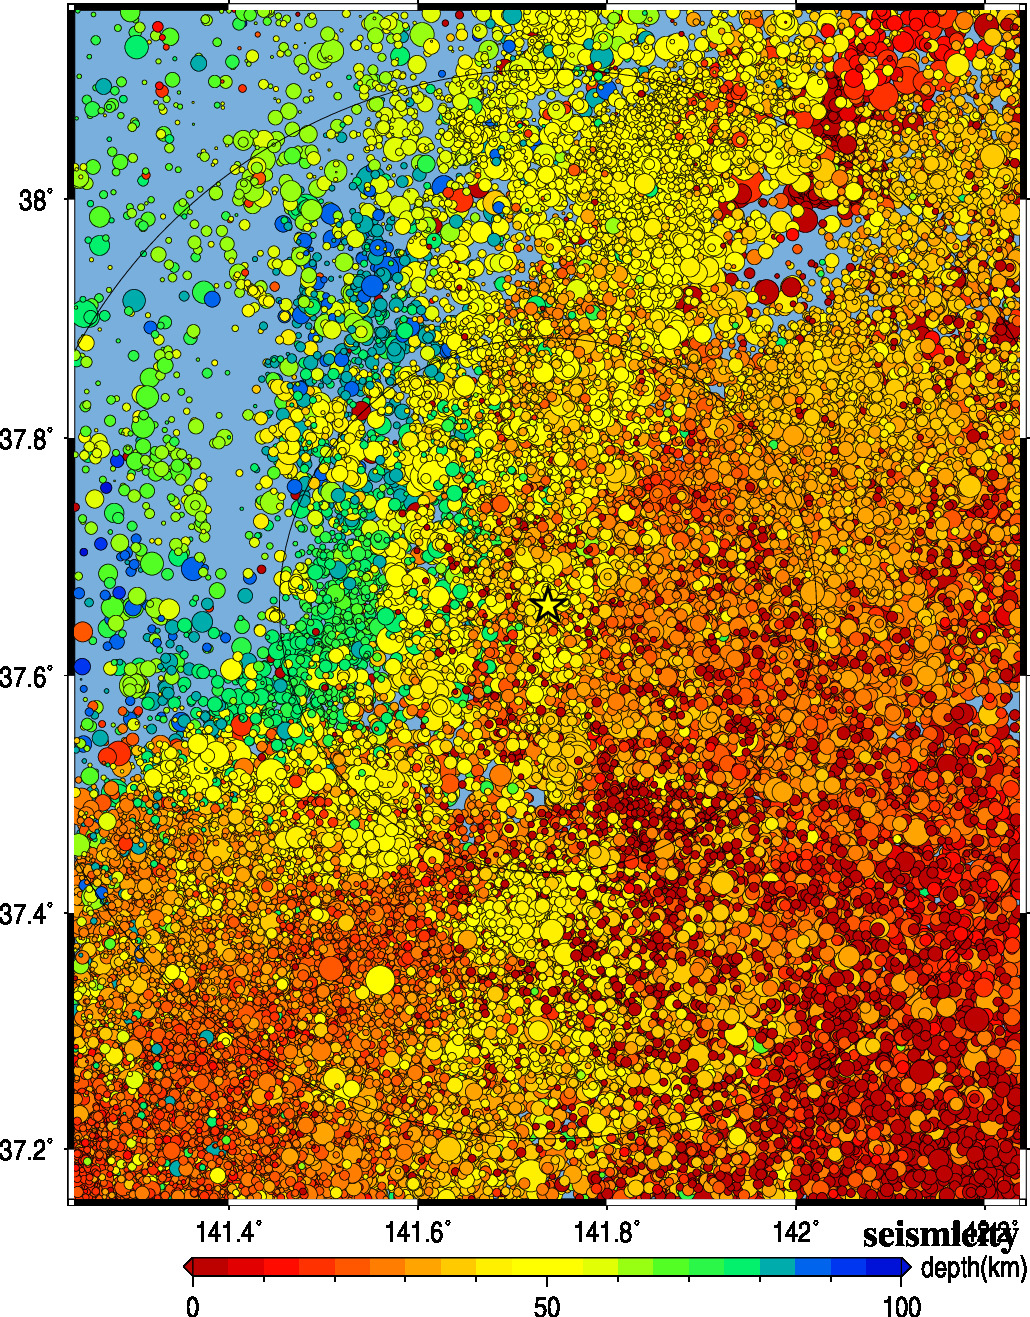
Fig.4. Seismic activity of past 40 years.
5.解析結果 (Analytical Result)
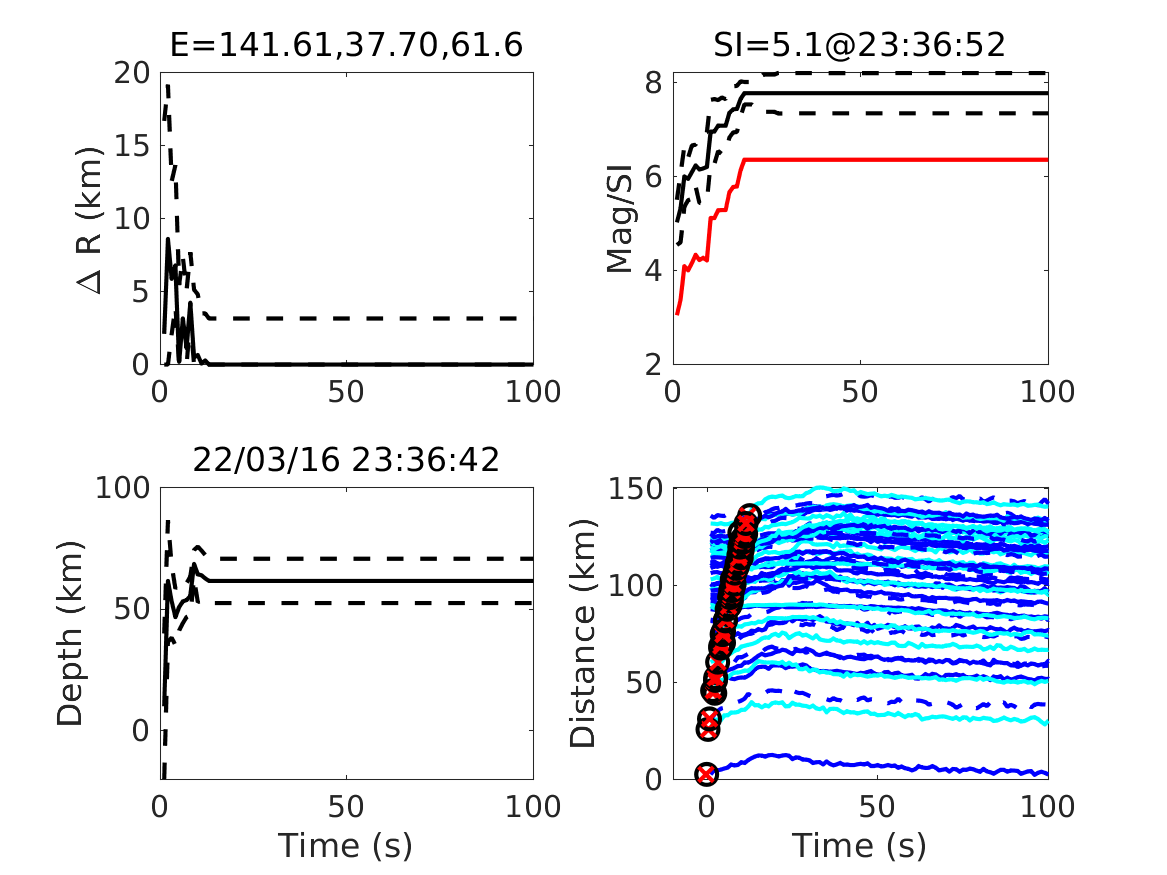
Fig.5. Time history of the estimates for source parameters by the IPFx method. The horizontal axis shows the time of processing.
- upper left: error of epicenter against the final estimation
- upper right: JMA magnitude (black) and maximum estimated shaking intensity (red)
- lower left: epicenter depth
- lower right: automatic picking time (black) and theoretical arrival time (red)
Fig.6. Simulation of the IPFx method. The triangles show seismic stations, and colored triangles are triggered stations. The star shows the estimated location of an earthquake. The color of the samples is proportional to the likelihood of the hypocenter location.
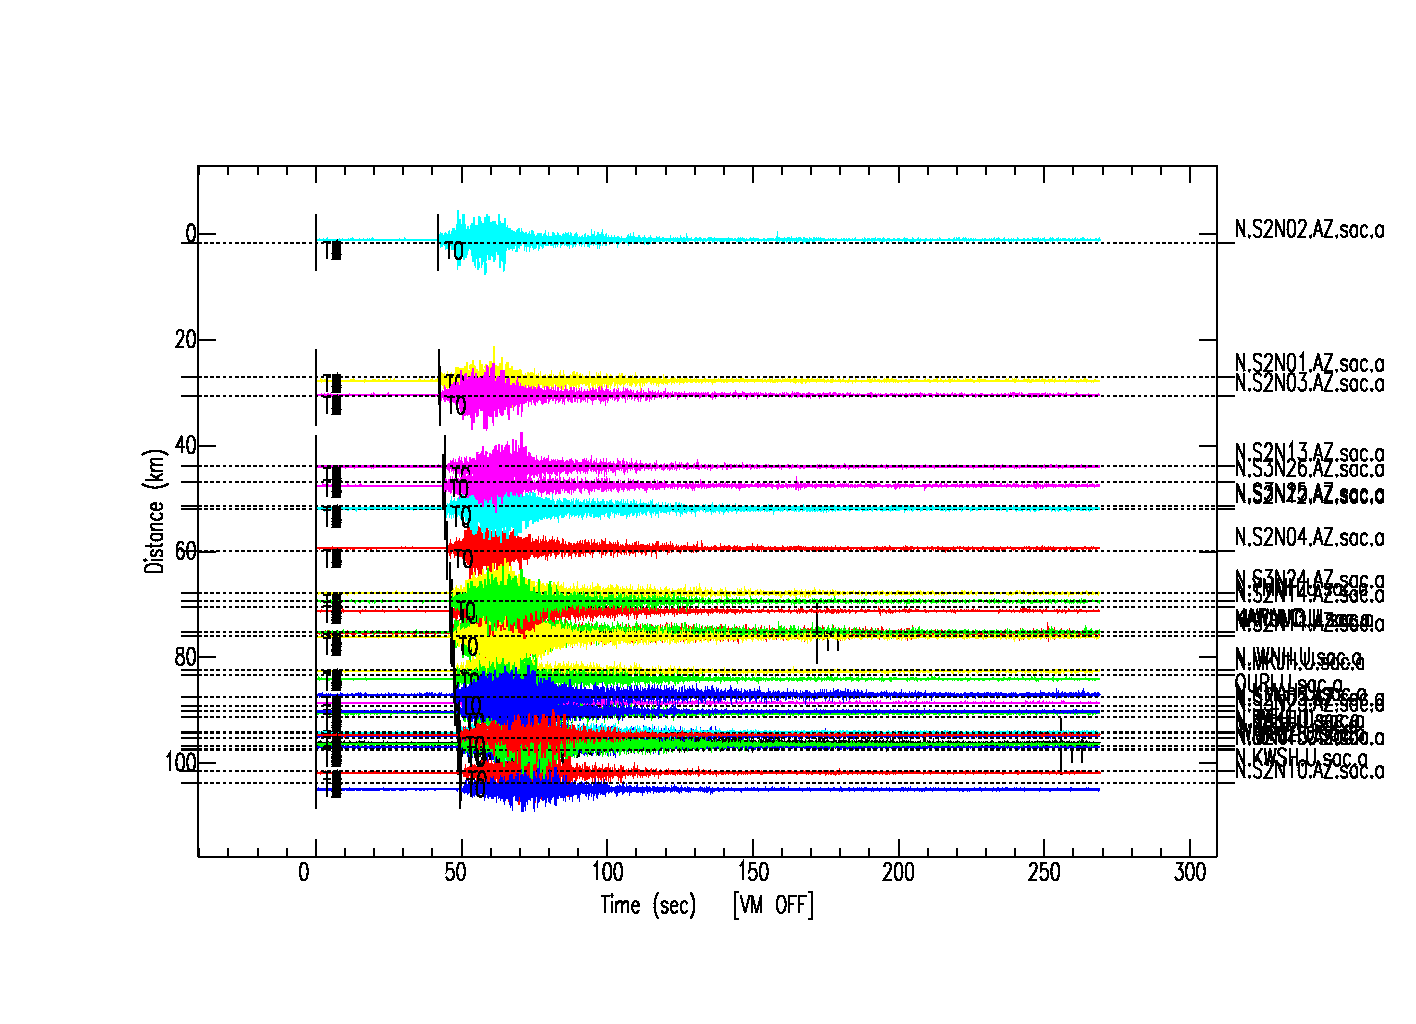
Fig.7. The waveforms aligned from the epicenter estimated by the IPFx method.
Acknowledgements:
気象庁の震度情報、防災科学技術研究所のK-NET,KiK-net,Hi-net,S-netの波形、気象庁の強震波形、一元化震源カタログを利用しました。
緊急地震速報を発表した地震の解析結果
山田真澄 ホーム