━━━━━━━━━━━━━━━━━━━━━━━━
2021年10月6日 岩手県沖の地震
━━━━━━━━━━━━━━━━━━━━━━━━
我々も防災科学技術研究所のHi-netとS-netのデータを利用して、現在の緊急地震速報と同様の手法(IPFx法)で解析しました。地震の検知時刻は気象庁のシステムよりも4秒程度早くなりましたが、一般向けの基準を超えたのはほぼ同時刻でした。
推定された震源の場所については、気象庁と我々の解析結果のどちらも最初から誤差は小さく、最終的な推定場所と比較して10km以下に収まっています。緊急地震速報が想定通り、適切に発表された事例と言えます。
1.地震について (Earthquake Information)
----------------------------------------------------2021/10/06,02:46:02.33 40.007 142.255 56.2 5.9
----------------------------------------------------
Table1. Earthquake information. Origin time, Epicentral latitude, longitude, depth, and JMA magnitude from the left.(ref. JMA catalog)
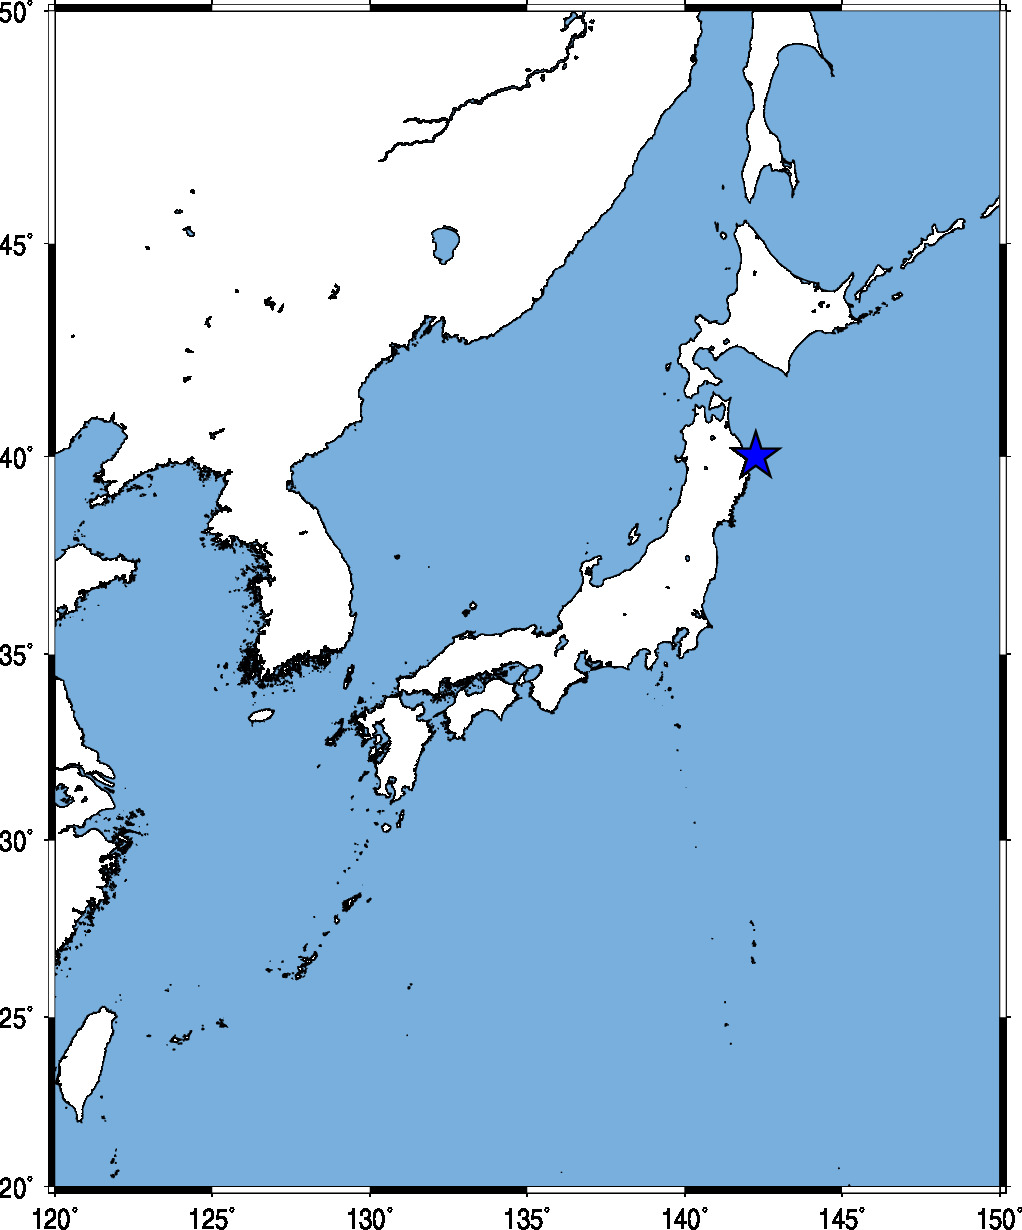
Fig.1. Event location.
2.観測点分布 (Station Distribution)
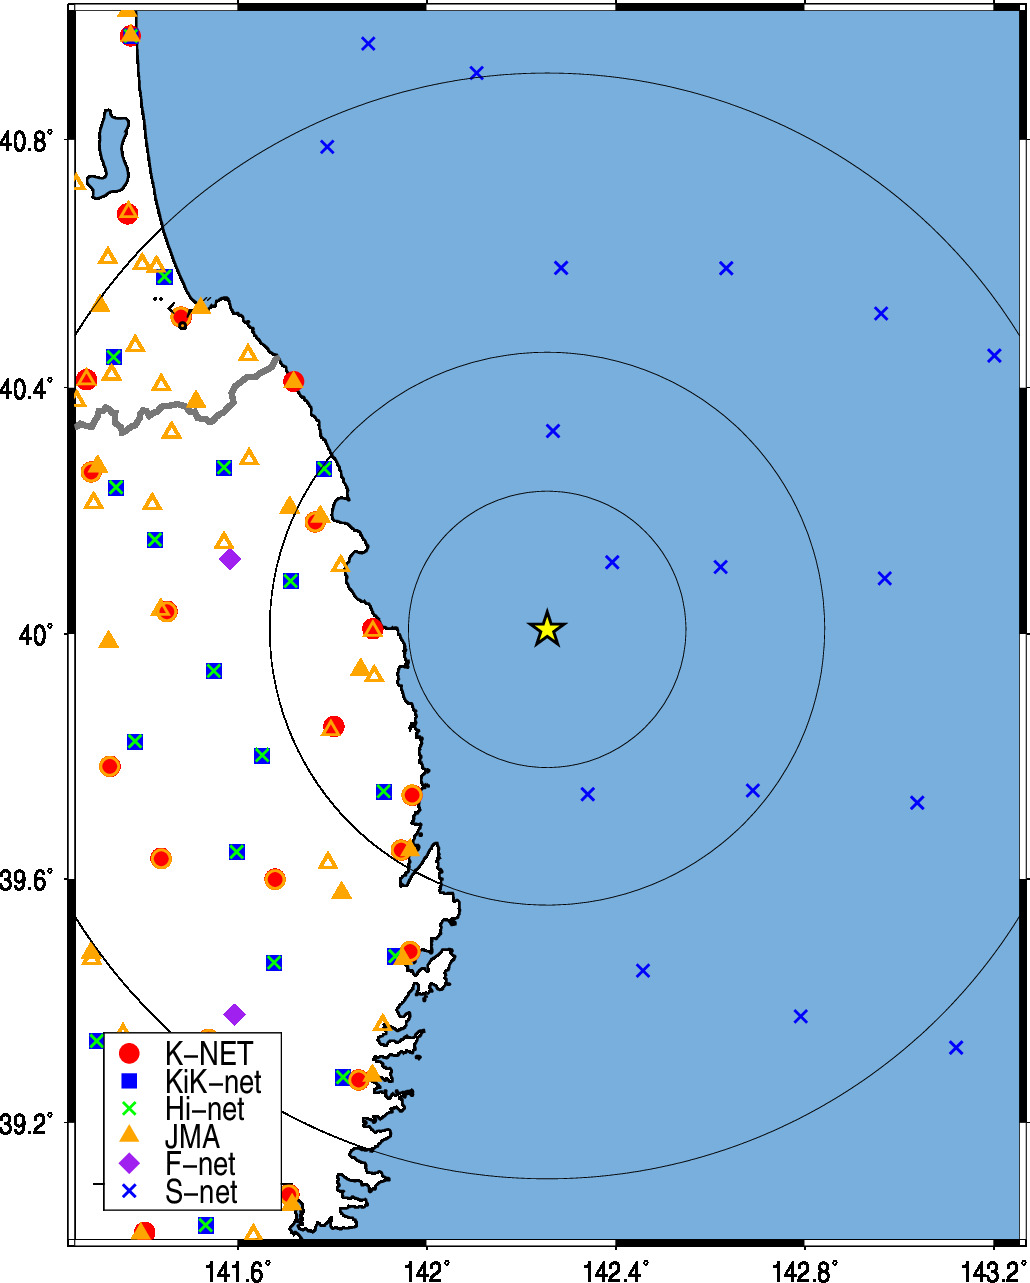
Fig.2. Station Distribution.
3.緊急地震速報発信状況 (Earthquake Early Warning Report)
-------------------------------------------------------------------[02] 21/10/06-02:46:05 04 M5.5 40.0N 142.2E 030km (21/10/06-02:46:16)
[12] 21/10/06-02:46:02 5- M5.8 40.0N 142.4E 050km (21/10/06-02:46:41)
[16] 21/10/06-02:46:02 5- M5.8 40.0N 142.3E 050km (21/10/06-02:47:27)
---------------------------------------------------------------------
(左から順に情報番号,震源時,最大予測震度,マグニチュード, 震央緯度,震央経度,震源深さ,電文発表時刻) from CEORKA
-------------------------------------------------------------------
Table2. Earthquake early warning reports. Information ID, Origin time, Maximum Intensity, JMA magnitude, Epicentral latitude, longitude, depth, and time to issue the report from the left.(ref. The Committee of Earthquake Observation and Research in the Kansai Area)
気象庁による緊急地震速報の内容
4.観測記録 (Observed Records)
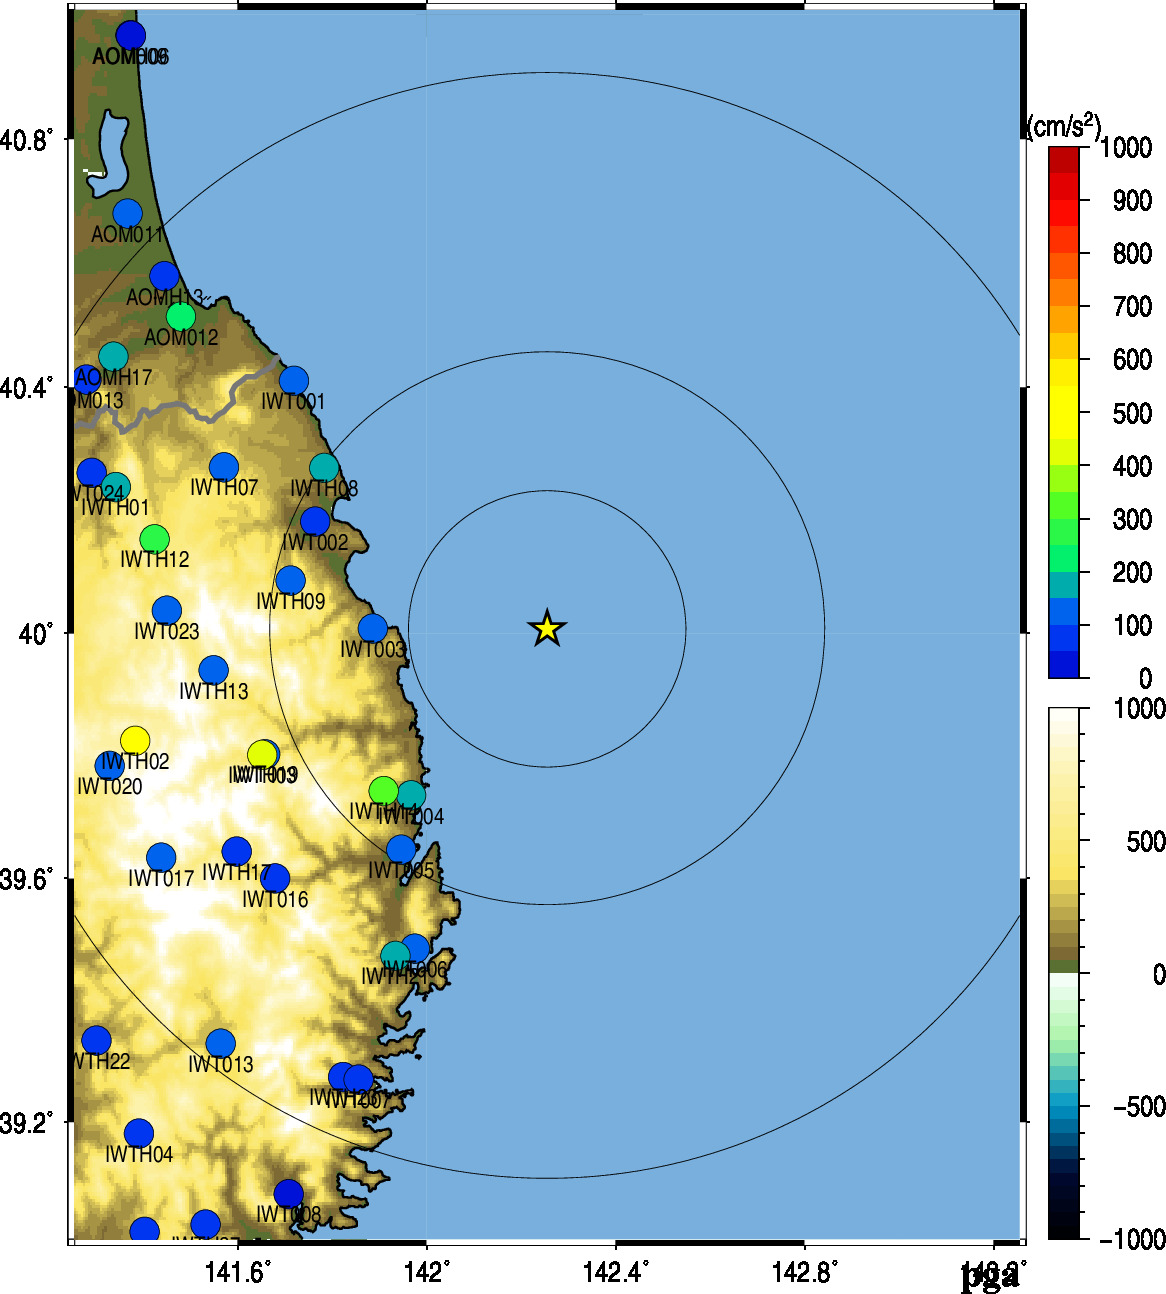
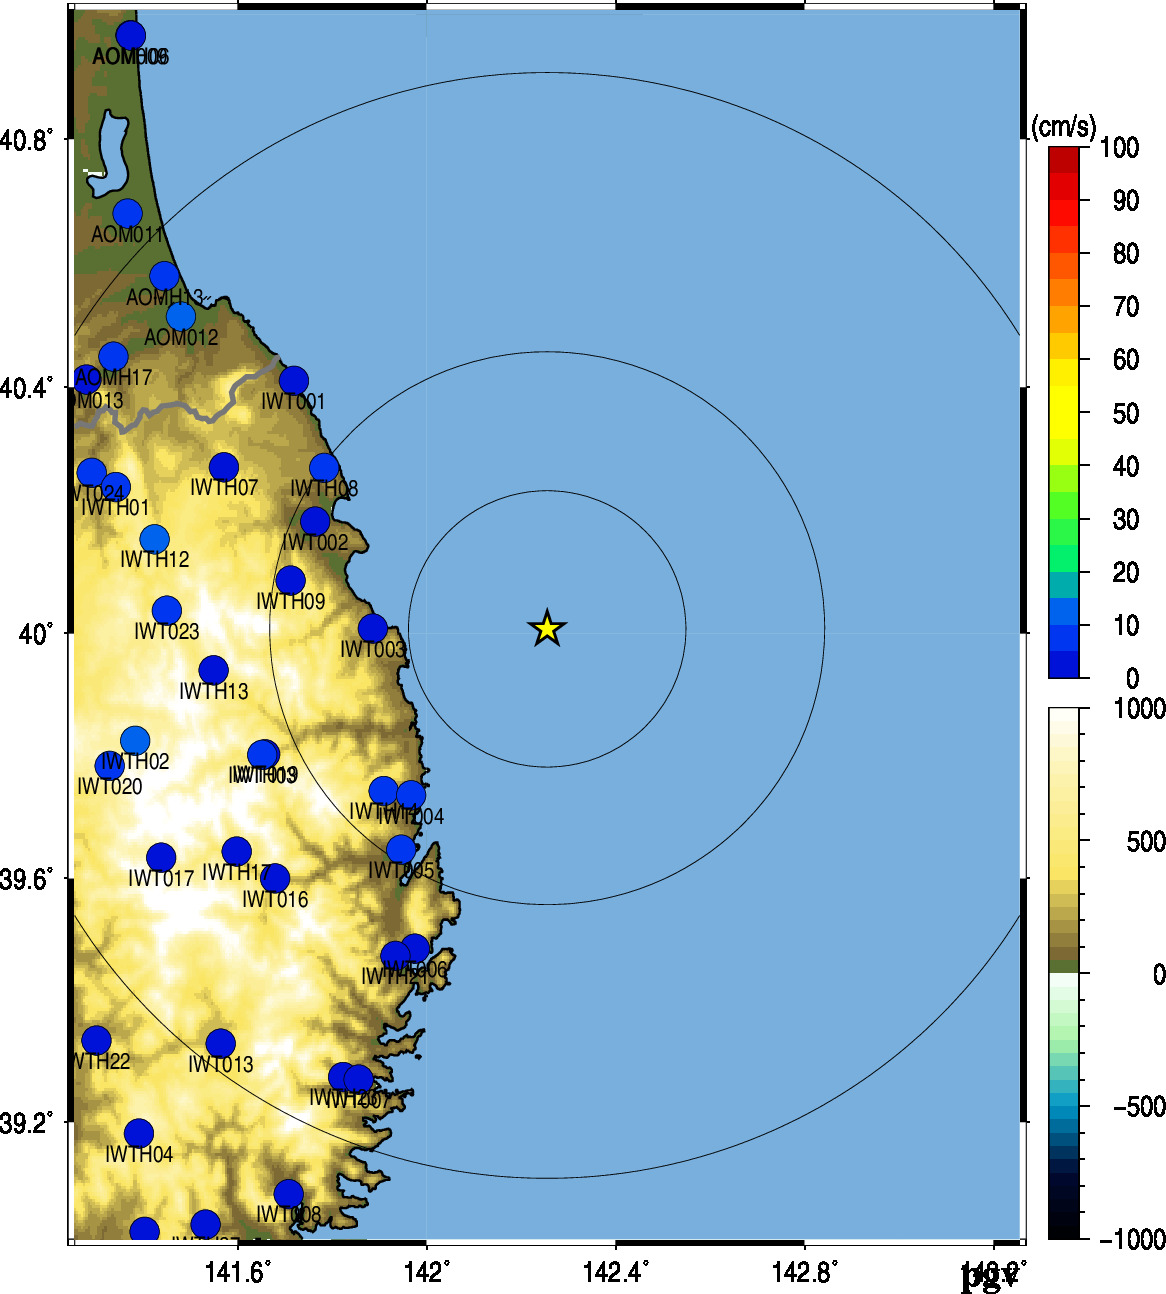
Fig.2. Peak Ground Acceleration (left) and Peak Ground Velocity (right).
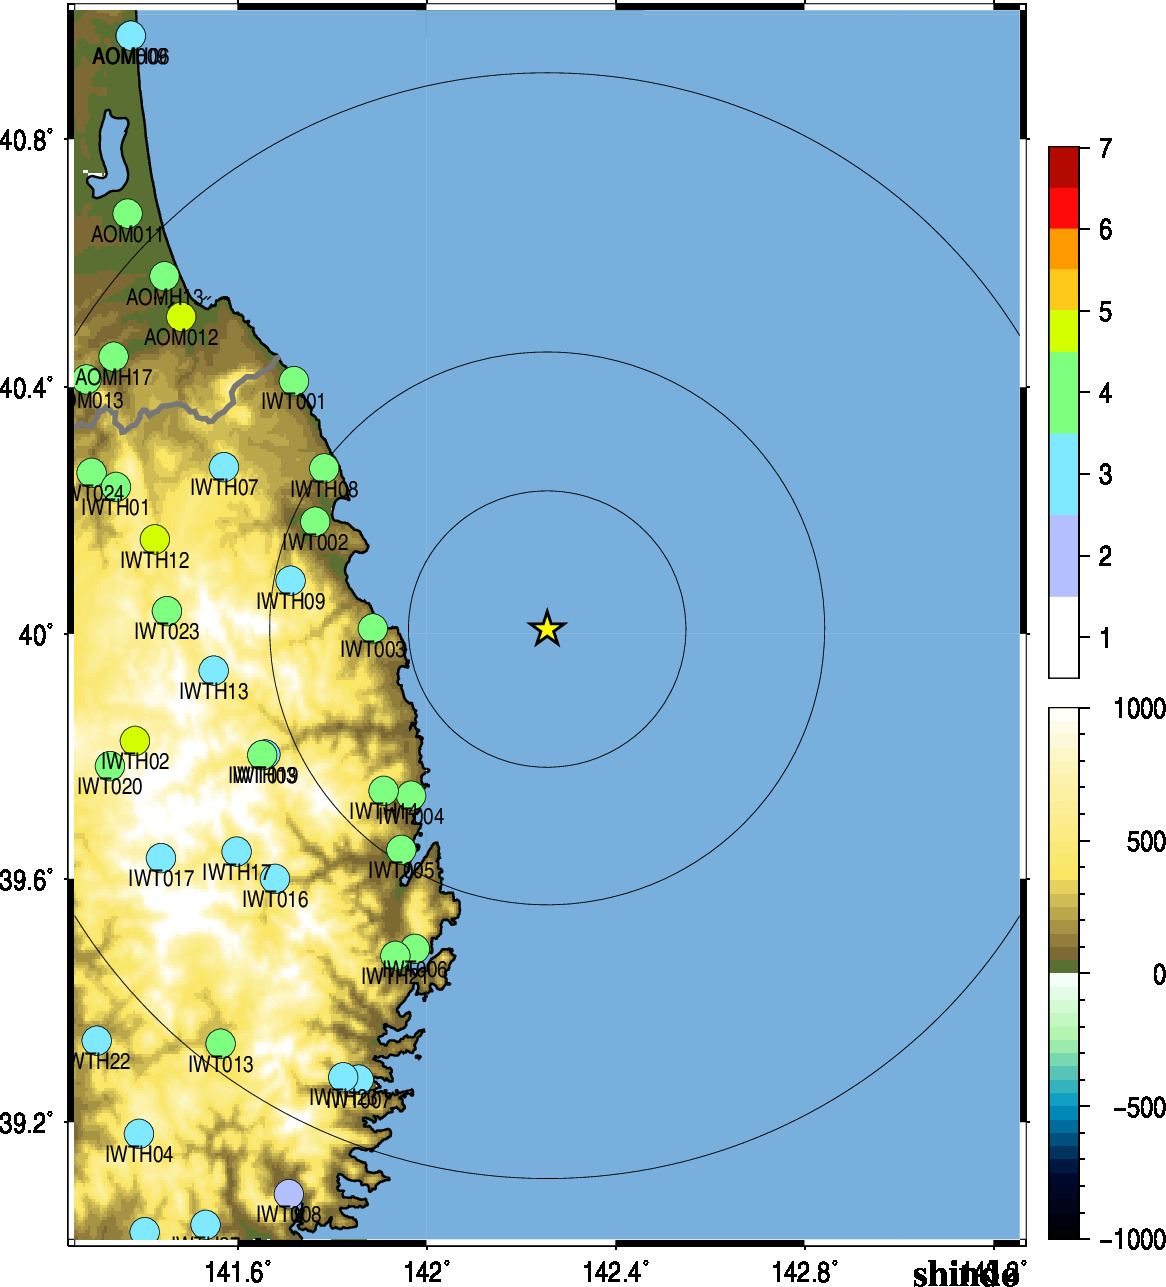
Fig.3. JMA shaking intensity.
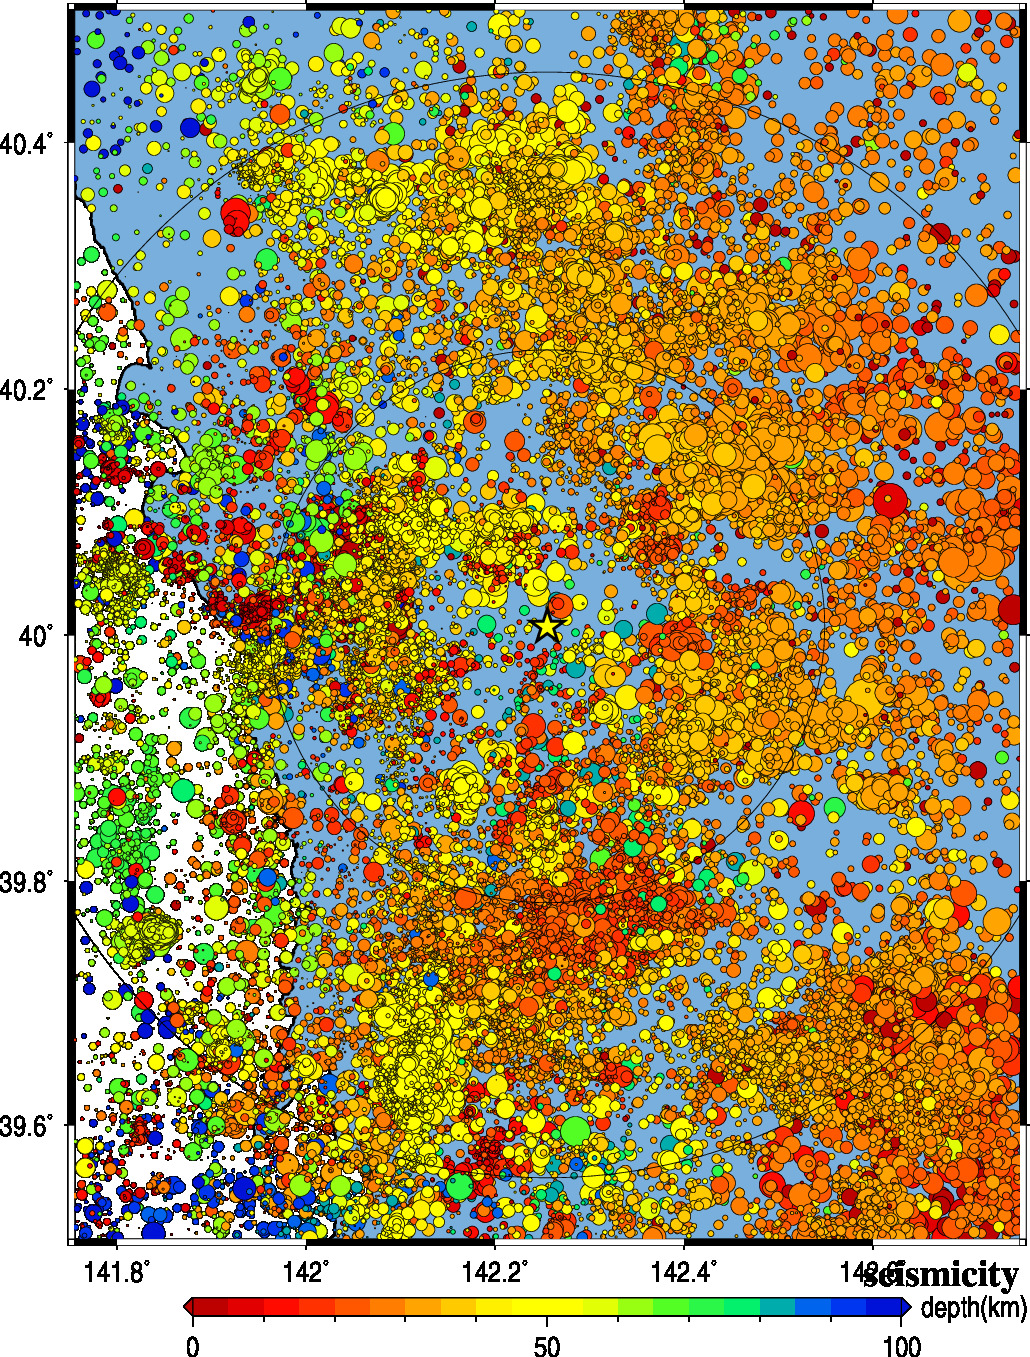
Fig.4. Seismic activity of past 40 years.
5.解析結果 (Analytical Result)
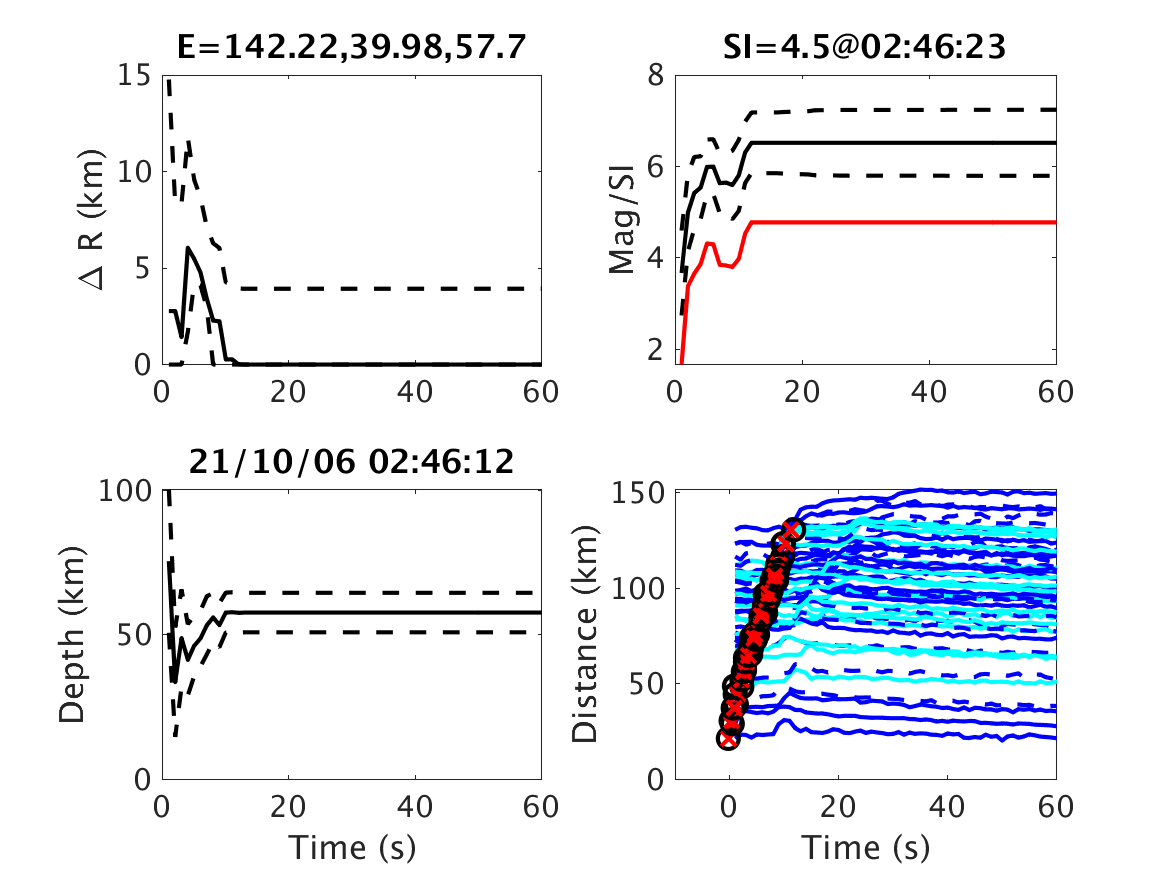
Fig.5. Time history of the estimates for source parameters by the IPFx method. The horizontal axis shows the time of processing.
- upper left: error of epicenter against the final estimation
- upper right: JMA magnitude (black) and maximum estimated shaking intensity (red)
- lower left: epicenter depth
- lower right: automatic picking time (black) and theoretical arrival time (red)
Fig.6. Simulation of the IPFx method. The triangles show seismic stations, and colored triangles are triggered stations. The star shows the estimated location of an earthquake. The color of the samples is proportional to the likelihood of the hypocenter location.
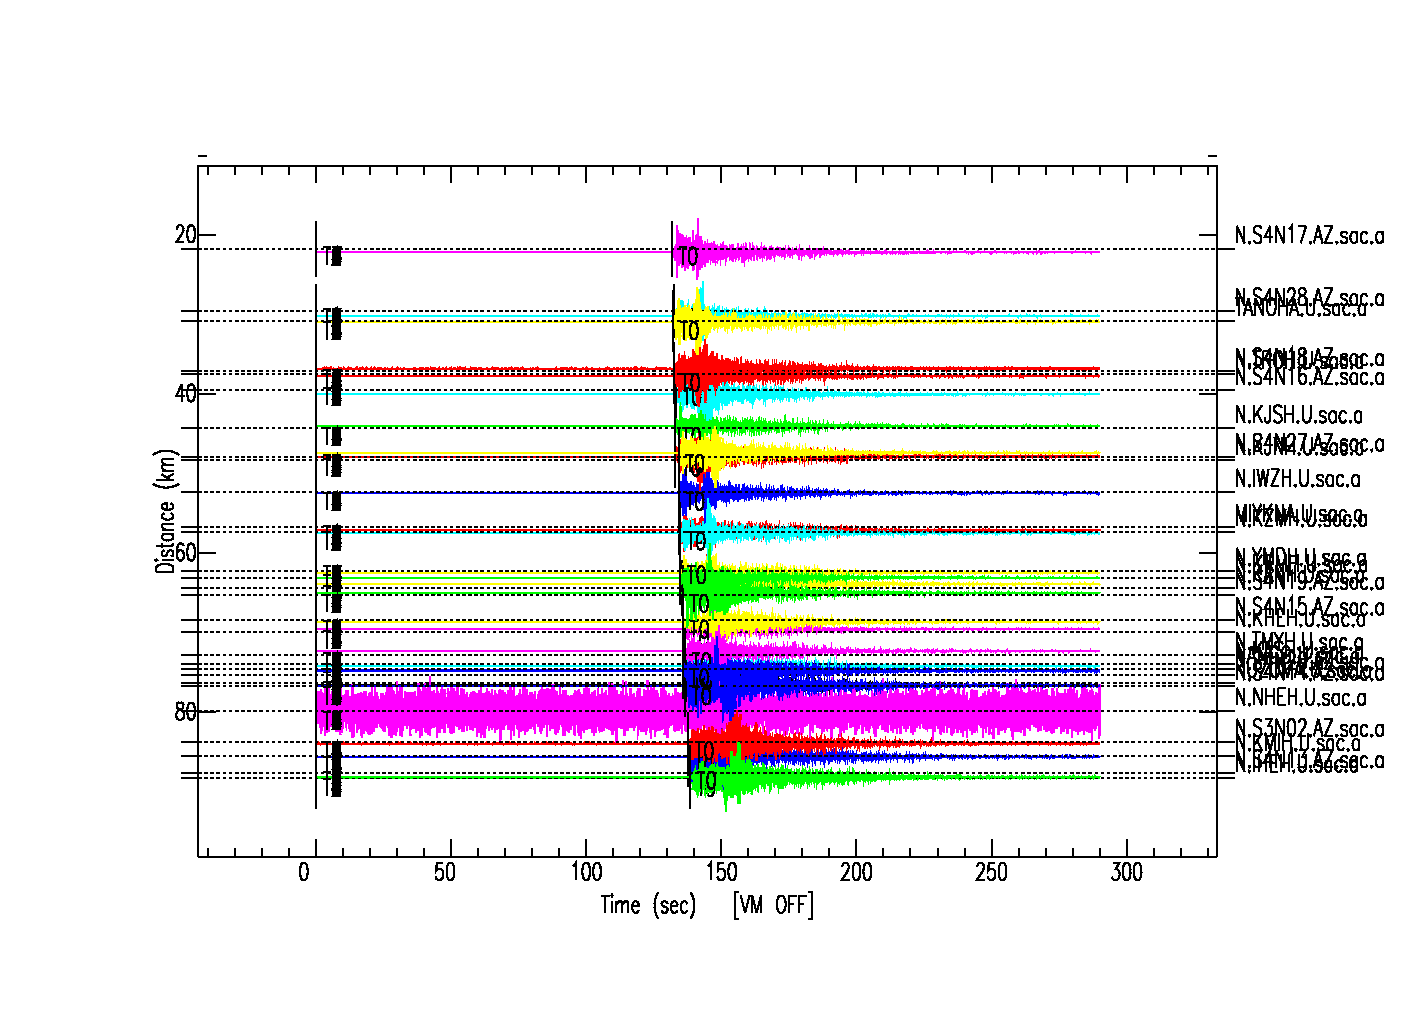
Fig.7. The waveforms aligned from the epicenter estimated by the IPFx method.
Acknowledgements:
気象庁の震度情報、防災科学技術研究所のK-NET,KiK-net,Hi-net,S-netの波形、気象庁の強震波形、一元化震源カタログを利用しました。
緊急地震速報を発表した地震の解析結果
山田真澄 ホーム