━━━━━━━━━━━━━━━━━━━━━━━━
2010年2月27日 沖縄本島の地震
━━━━━━━━━━━━━━━━━━━━━━━━
1.地震について (Earthquake Information)
----------------------------------------------------
2010/02/27,05:31:25.92 25.919 128.680 37. 7.4
----------------------------------------------------
Table1. Earthquake information. Origin time, Epicentral latitude, longitude, depth, and JMA magnitude from the left.(ref. JMA source mechanism)
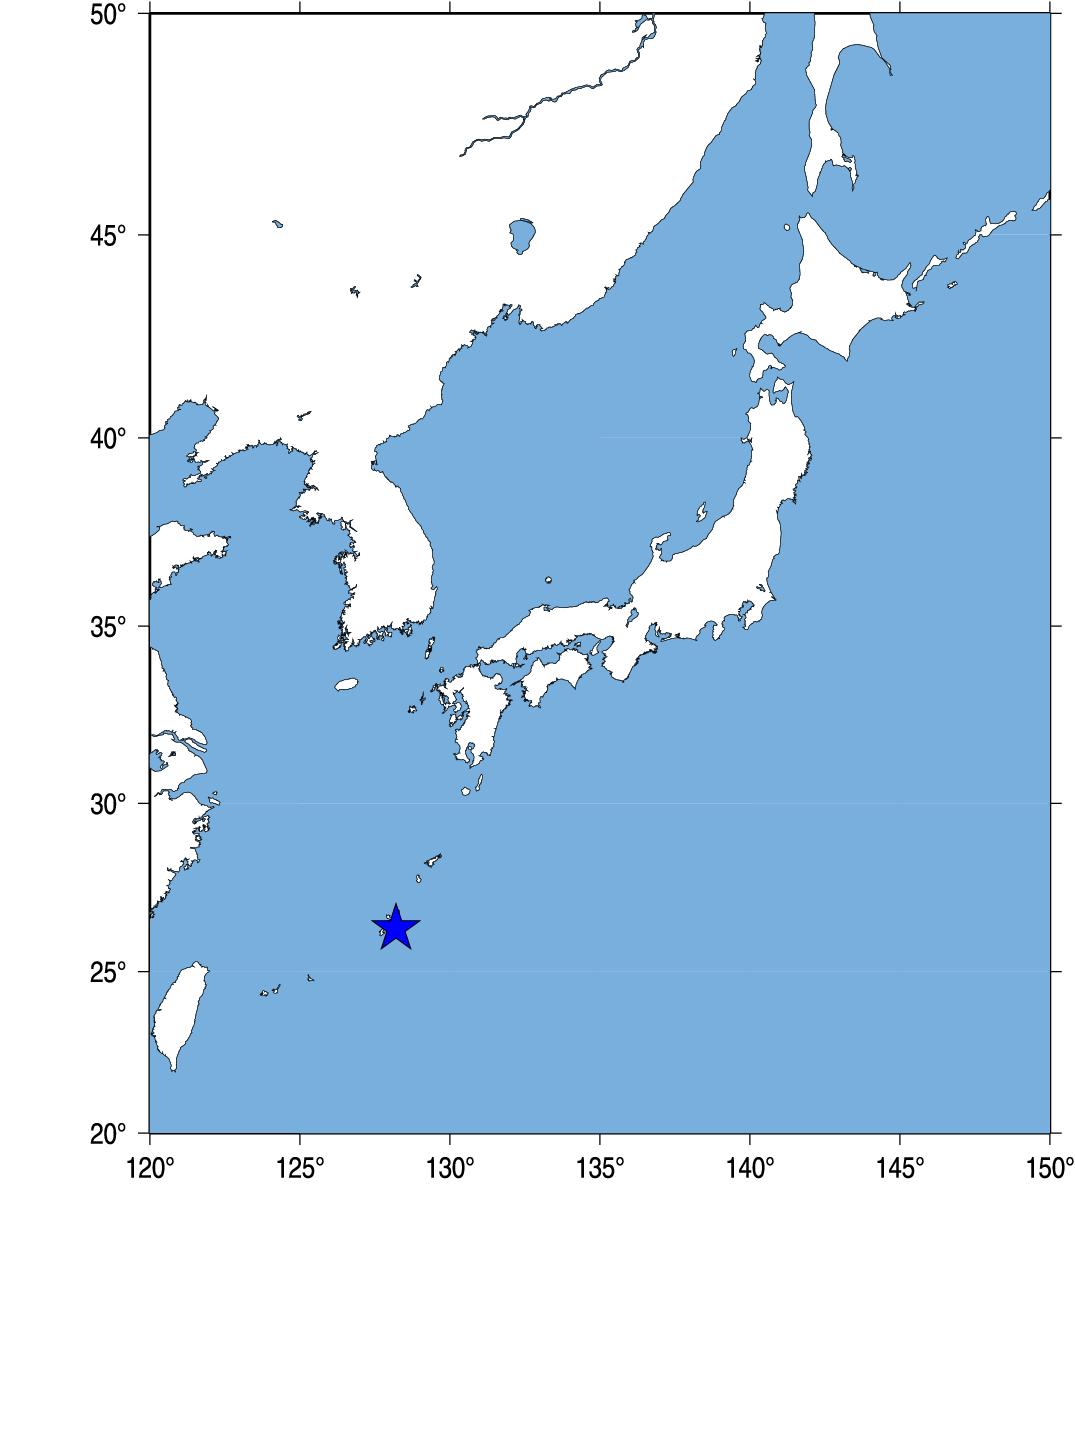
Fig.1. Event location.
2.観測点分布 (Station Distribution)
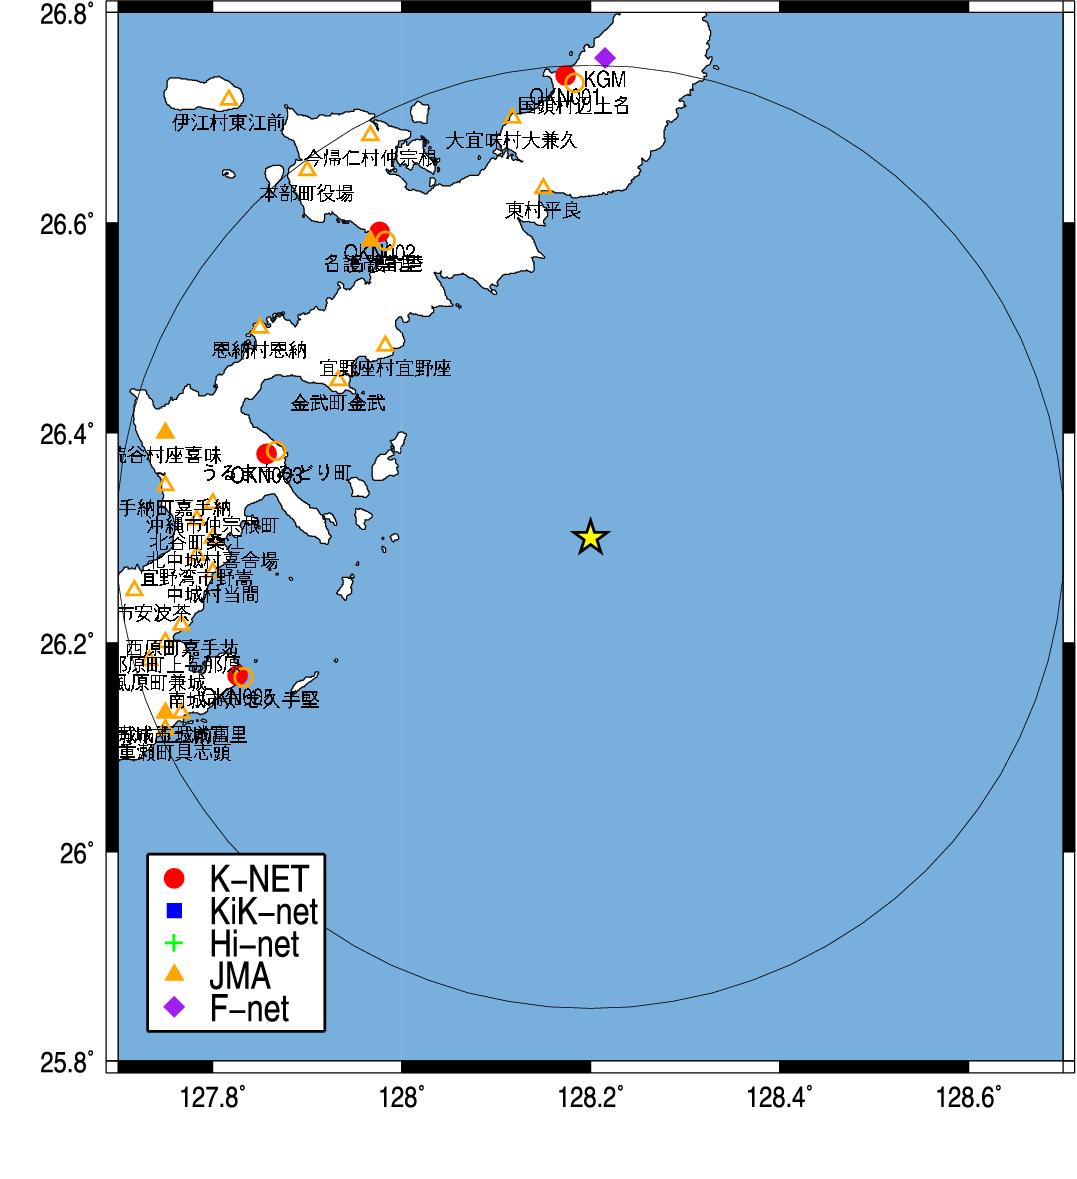
Fig.2. Station Distribution.
3.緊急地震速報発信状況 (Earthquake Early Warning Report)
-------------------------------------------------------------------[01] 10/02/27-05:31:36 5+ M6.8 26.1N 128.0E 010km (10/02/27-05:31:45)
[04] 10/02/27-05:31:33 5+ M6.7 26.3N 128.2E 010km (10/02/27-05:31:52)
[07] 10/02/27-05:31:33 5+ M6.6 26.3N 128.2E 010km (10/02/27-05:32:06)
[08] 10/02/27-05:31:33 5+ M6.7 26.3N 128.2E 010km (10/02/27-05:32:12)
[09] 10/02/27-05:31:33 5+ M6.9 26.3N 128.2E 010km (10/02/27-05:32:32)
[10] 10/02/27-05:31:33 5+ M6.9 26.3N 128.2E 010km (10/02/27-05:32:47)
---------------------------------------------------------------------
(左から順に情報番号,震源時,最大予測震度,マグニチュード, 震央緯度,震央経度,震源深さ,電文発表時刻) from CEORKA
-------------------------------------------------------------------
Table2. Earthquake early warning reports. Information ID, Origin time, Maximum Intensity, JMA magnitude, Epicentral latitude, longitude, depth, and time to issue the report from the left.(ref. The Committee of Earthquake Observation and Research in the Kansai Area)
気象庁による緊急地震速報の内容
4.解析結果 (Analytical Result)
-------------------------------------------------------
OKN0031002270531.z 127.857 26.380 2.321 41.620 35.350 6.9
OKN0021002270531.z 127.977 26.592 3.291 42.490 39.240 6.9
OKN0051002270531.z 127.827 26.169 2.047 41.230 40.040 6.9
OKN0011002270531.z 128.174 26.740 2.983 42.940 48.844 6.9
OKN0041002270531.z 127.679 26.250 2.404 42.870 52.377 6.9
KGS0351002270531.z 128.424 27.052 2.023 46.390 86.277 6.9
KGS0341002270531.z 128.574 27.334 1.768 50.360 120.460 6.9
OKN0061002270531.z 126.748 26.350 1.458 54.310 145.083 6.9
-------------------------------------------------------
Table3. Analytical results using Tau_c method (Wu and Kanamori, 2005). Station ID, Station longitude, latitude, tauc, P-arrival time, epicentral distance(km) , and magnitude from the left.
5.観測記録 (Observed Records)
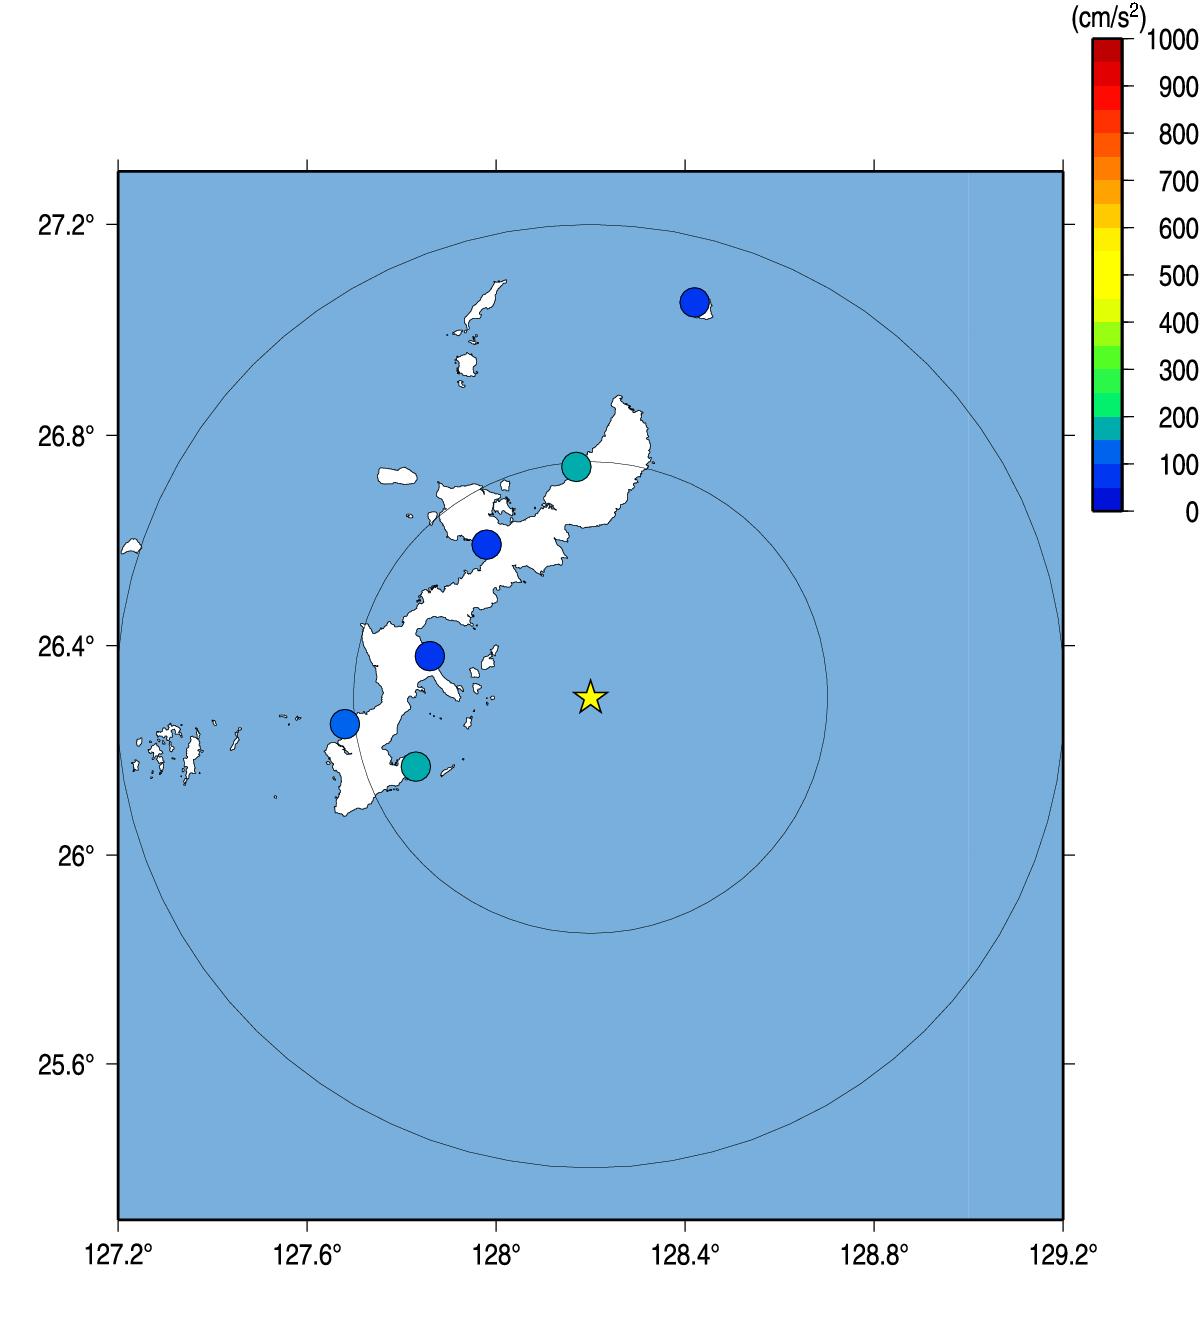
Fig.3. Peak Ground Acceleration.
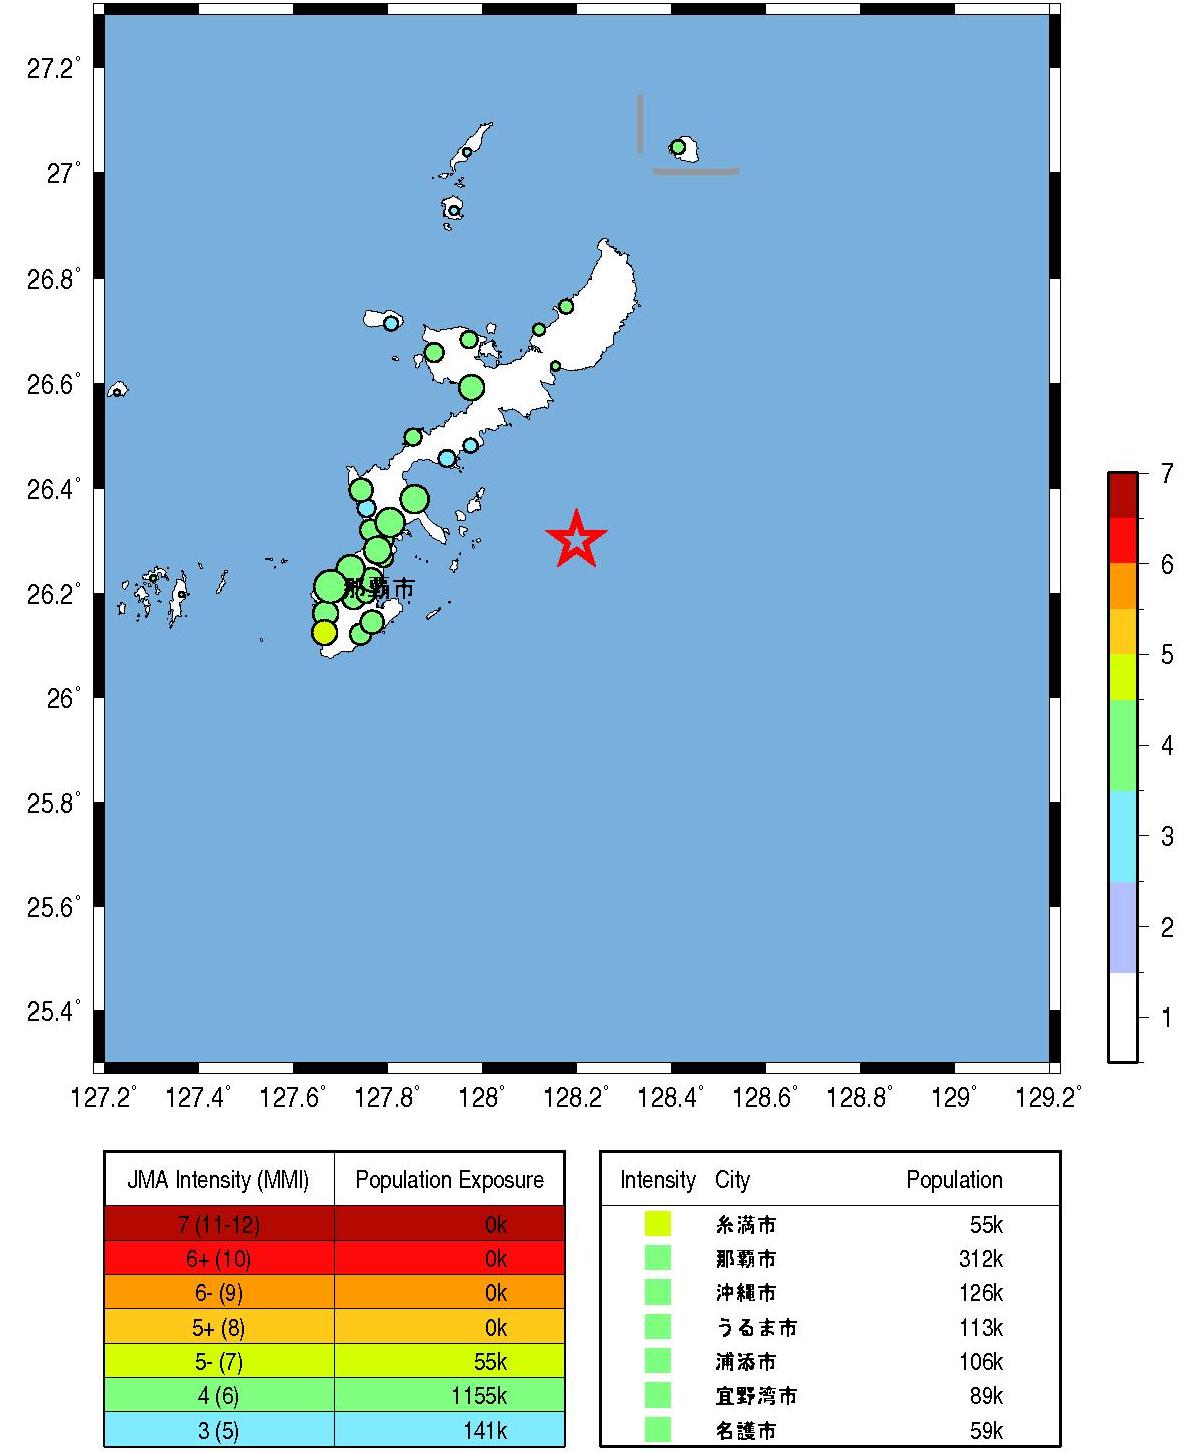
Fig.4. Population exposure. A circle size shows the population at the town, and a circle color shows the seismic intensity at the town.
Wu, Y. M. and H. Kanamori (2005). Experiment on an onsite early warning method for the Taiwan early warning system, Bull. Seism. Soc. Am., 95, 347-353.
気象庁の震度情報、防災科学技術研究所のK-NET,KiK-netの波形を利用しました。
緊急地震速報を発表した地震の解析結果
山田真澄 ホーム