━━━━━━━━━━━━━━━━━━━━━━━━
2019年6月18日 山形沖の地震
━━━━━━━━━━━━━━━━━━━━━━━━
1.地震について (Earthquake Information)
----------------------------------------------------
2019/06/18,22:22:20.3 38.59 139.4847 9.0 6.8
----------------------------------------------------
Table1. Earthquake information. Origin time, Epicentral latitude, longitude, depth, and JMA magnitude from the left.(ref. Hi-net catalog)
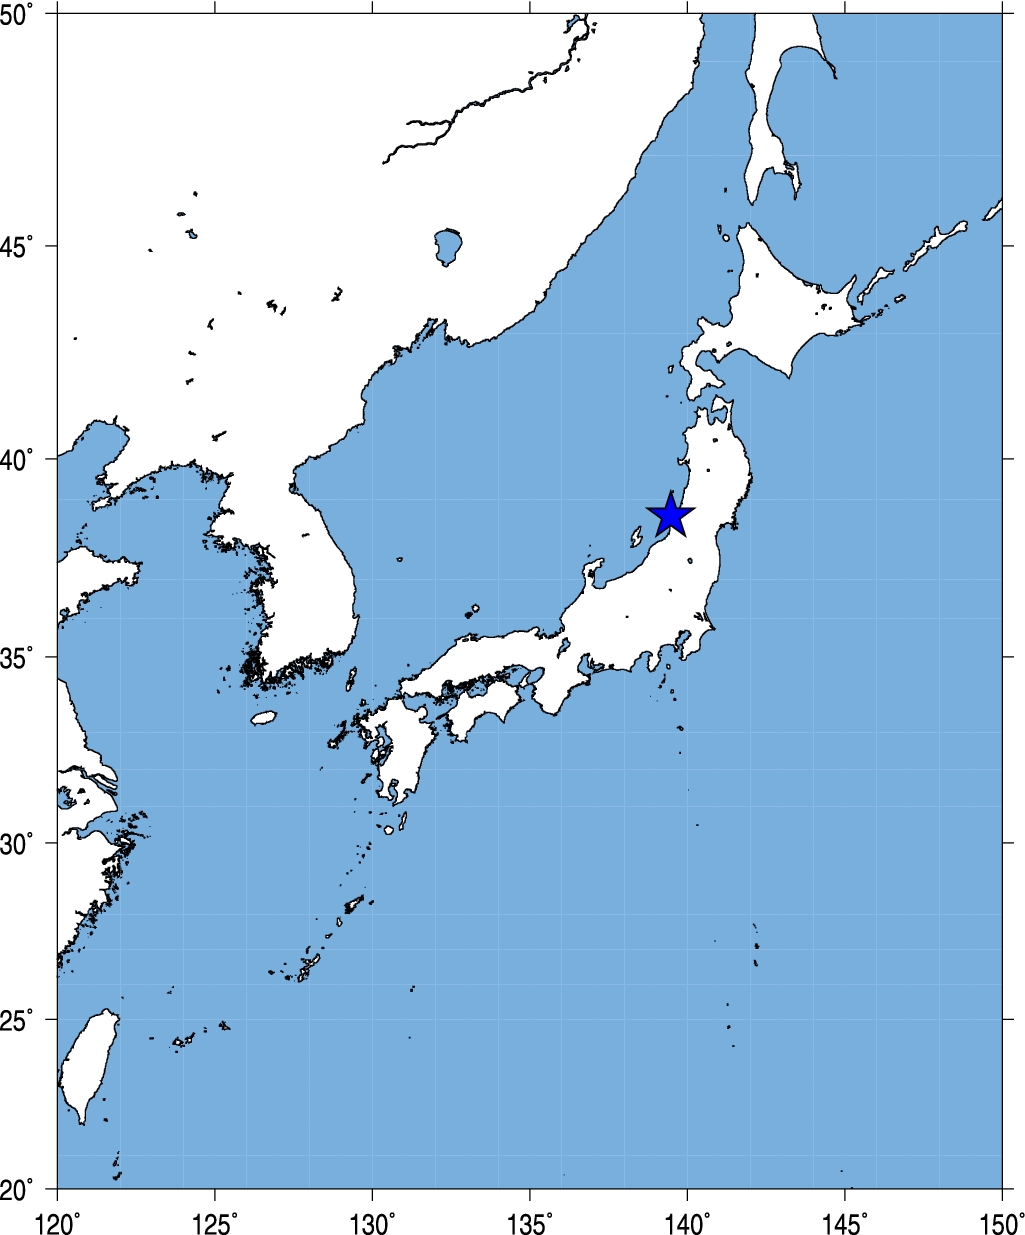
Fig.1. Event location.
2.観測点分布 (Station Distribution)
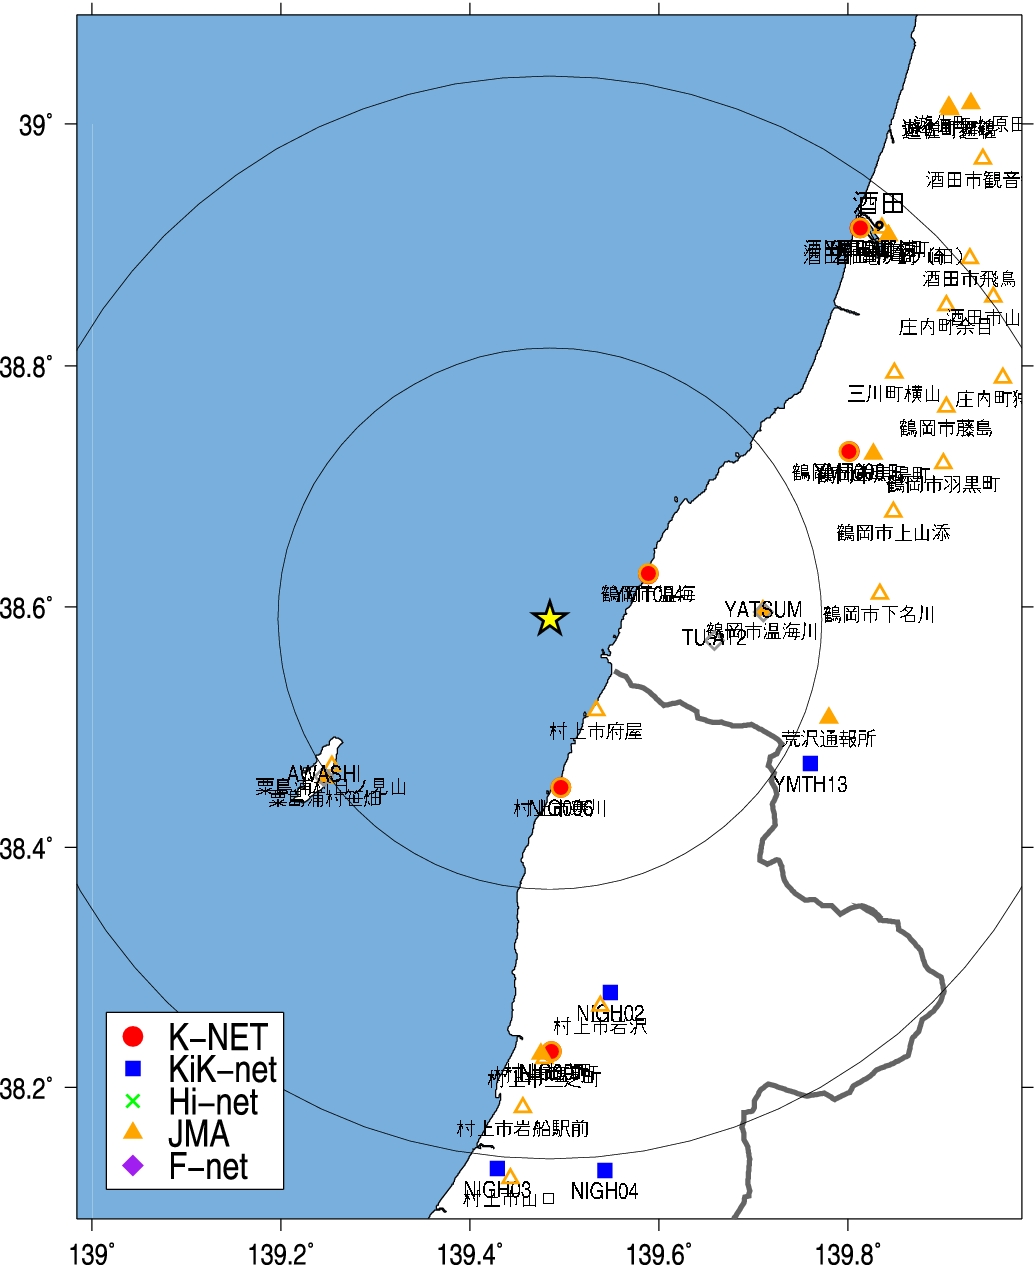
Fig.2. Station Distribution.
3.緊急地震速報発信状況 (Earthquake Early Warning Report)
-------------------------------------------------------------------[01] 19/06/18-22:22:22 0* M6.1 38.6N 139.7E 010km (19/06/18-22:22:29)
[21] 19/06/18-22:22:19 6+ M6.8 38.6N 139.5E 010km (19/06/18-22:22:59)
[29] 19/06/18-22:22:20 6+ M6.9 38.6N 139.5E 010km (19/06/18-22:24:45)
---------------------------------------------------------------------
(左から順に情報番号,震源時,最大予測震度,マグニチュード, 震央緯度,震央経度,震源深さ,電文発表時刻) from CEORKA
-------------------------------------------------------------------
Table2. Earthquake early warning reports. Information ID, Origin time, Maximum Intensity, JMA magnitude, Epicentral latitude, longitude, depth, and time to issue the report from the left.(ref. The Committee of Earthquake Observation and Research in the Kansai Area)
--> 気象庁による緊急地震速報の内容
4.観測記録 (Observed Records)
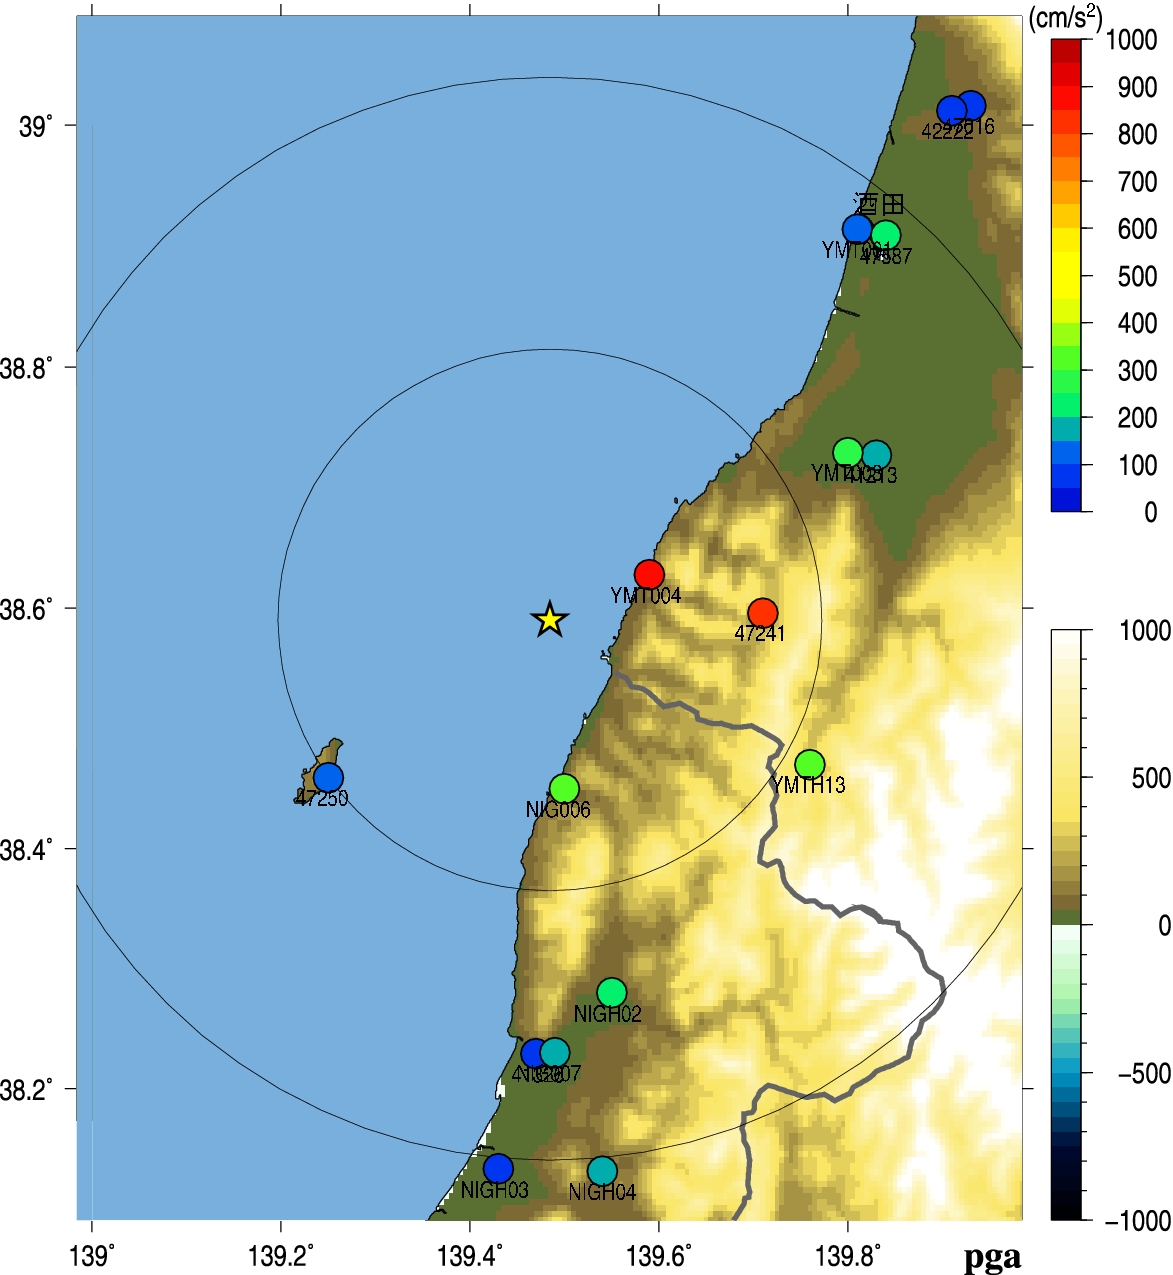
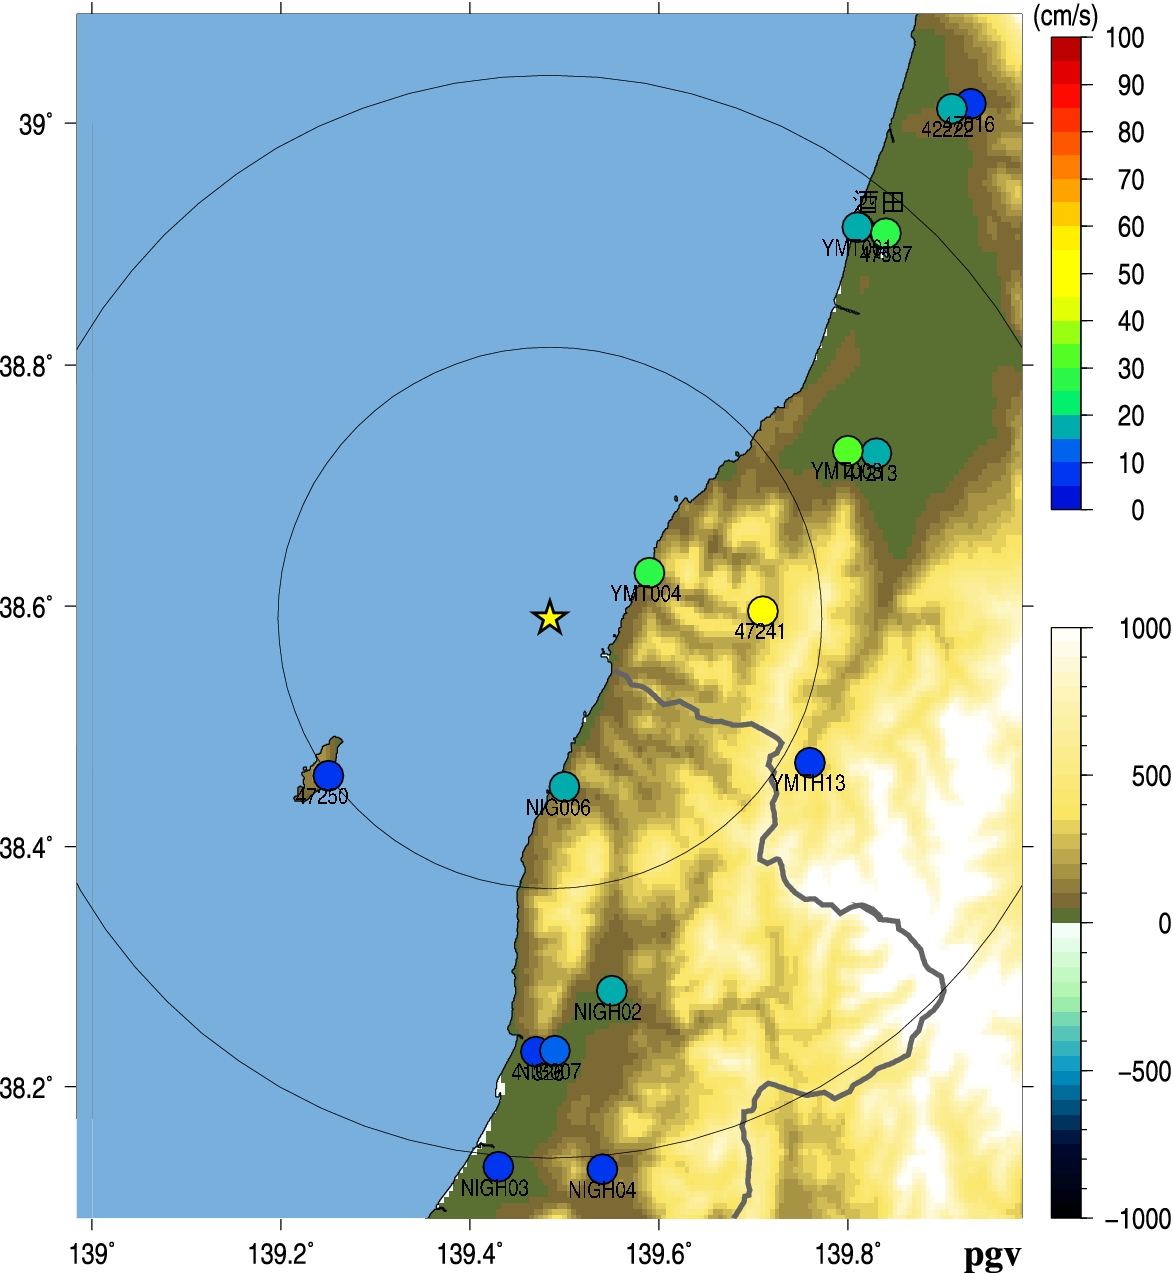
Fig.3. Peak Ground Acceleration (left) and Peak Ground Velocity (right).
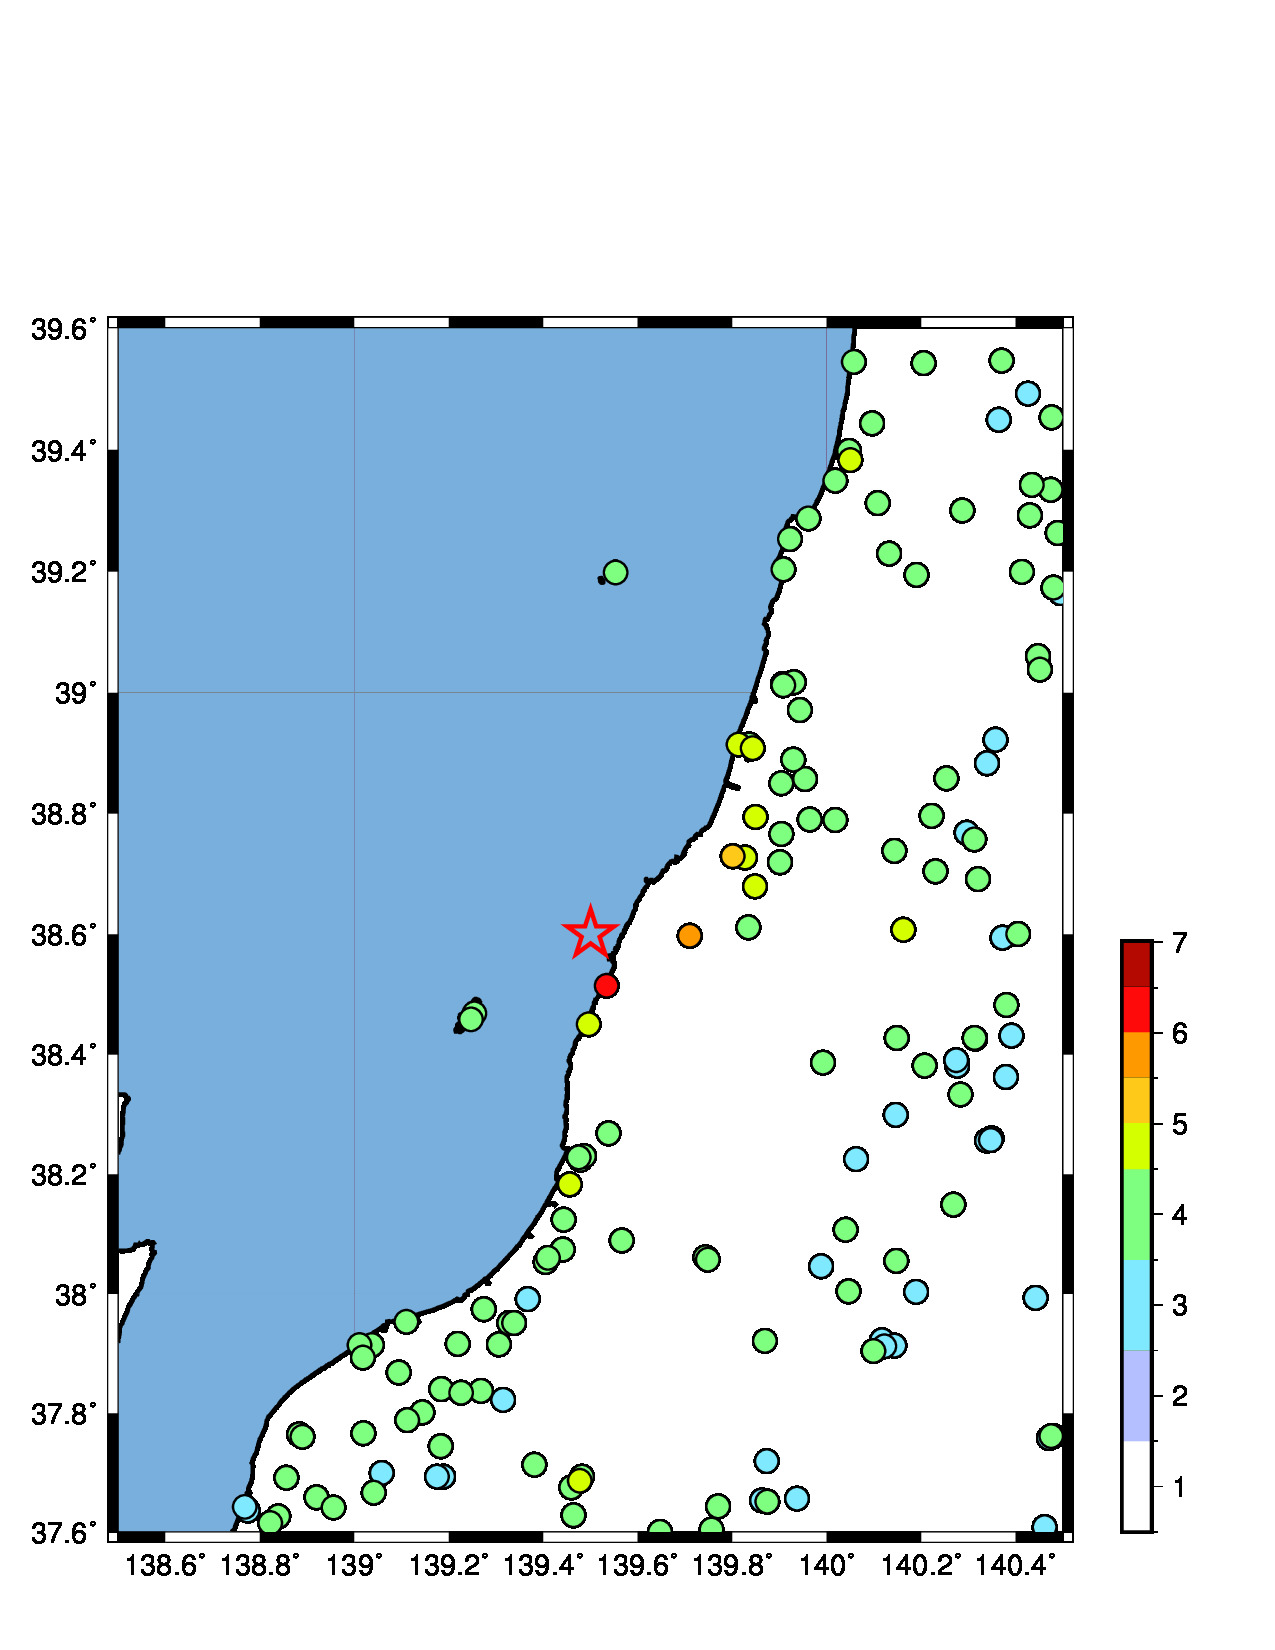
Fig.4. JMA seismic intensity.
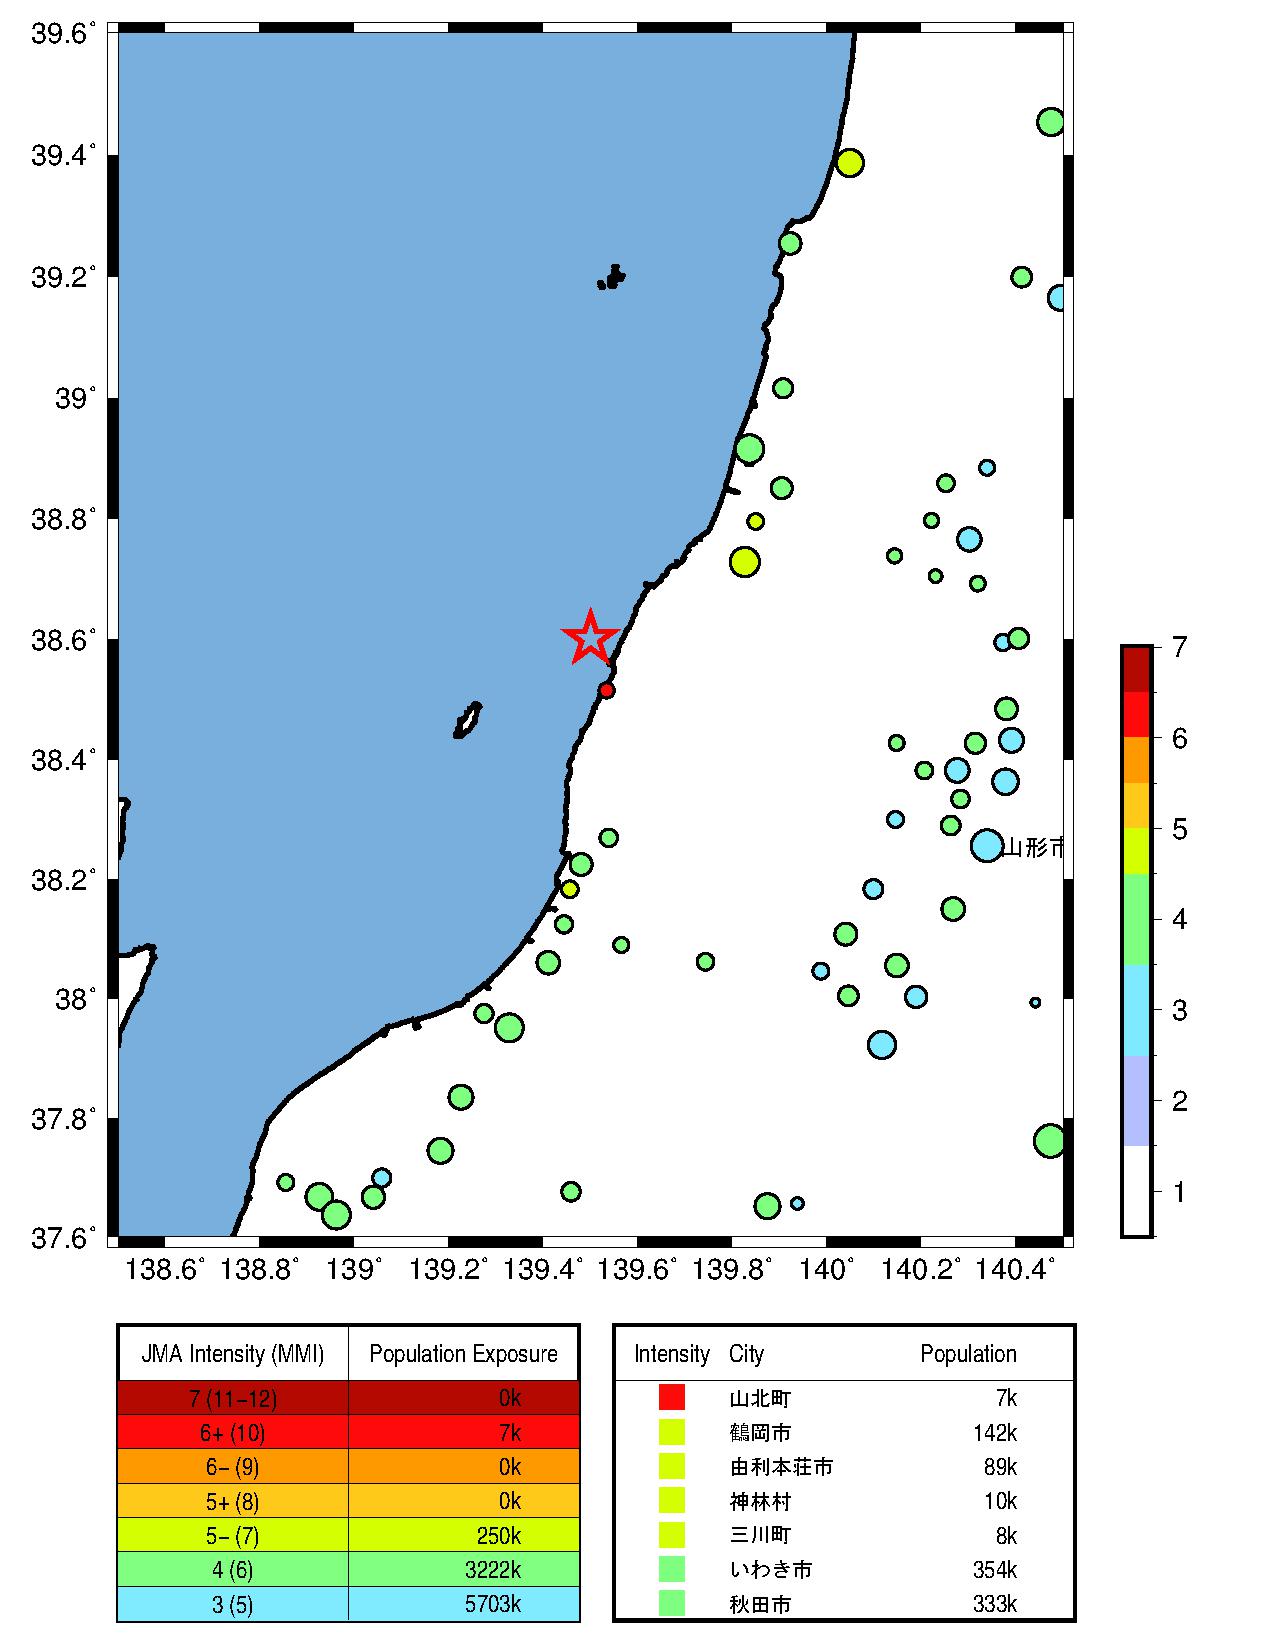
Fig.5. Population exposure. A circle size shows the population at the town, and a circle color shows the seismic intensity at the town.
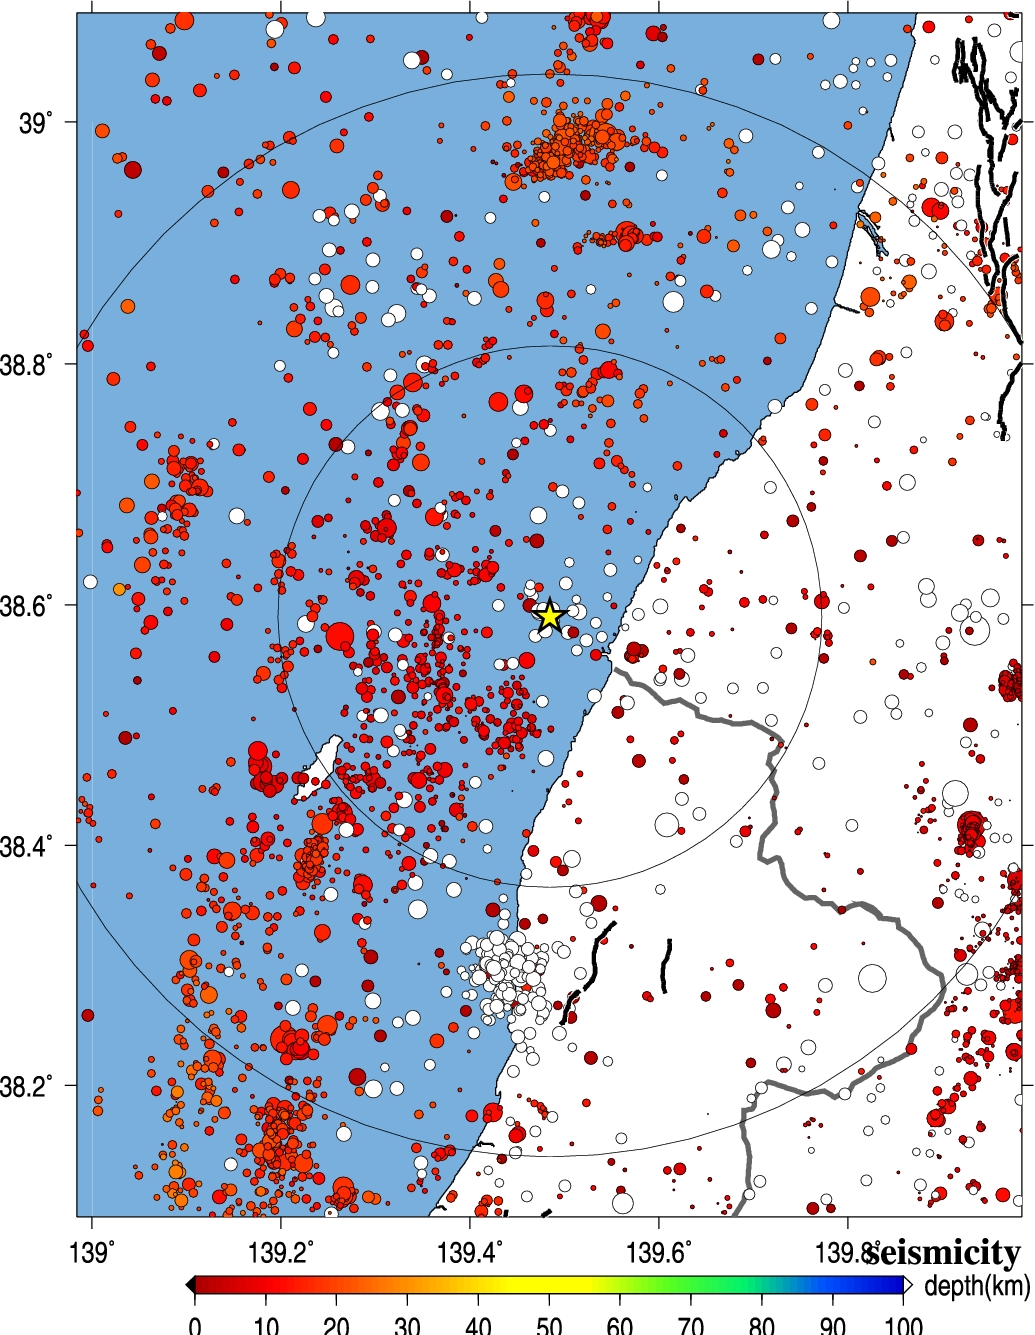
Fig.6. Seismic activity of past 40 years.
5.解析結果 (Analytical Result)
-------------------------------------------------------
NIG0062019061822 139.496 38.450 1.397 3.410 15.562 6.8 5.8
NIG0072019061822 139.486 38.230 0.867 7.250 39.951 6.8 5.3
YMT0082019061822 139.992 38.386 1.472 8.620 49.745 6.8 5.8
YMT0162019061822 140.018 38.790 2.469 9.000 51.453 6.8 6.3
YMT0052019061822 140.162 38.607 0.621 10.000 59.041 6.8 5.0
NIG0082019061822 139.406 38.053 0.901 11.010 60.009 6.8 5.4
YMT0132019061822 139.758 38.062 1.359 10.900 63.268 6.8 5.8
YMT0092019061822 140.274 38.390 3.984 12.540 72.385 6.8 6.7
YMT0122019061822 140.043 38.107 1.187 12.300 72.456 6.8 5.6
YMT0072019061822 140.391 38.431 1.722 13.730 80.979 6.8 6.0
Observed/Estimated Mw(median) tauc 6.8 5.8 1.4
-------------------------------------------------------
Table3. Analytical results using Tau_c method (Wu and Kanamori, 2005). Station ID, Station longitude, latitude, tauc, P-arrival time, epicentral distance(km) , magnitude, and estimated magnitude from the left.
Wu, Y. M. and H. Kanamori (2005). Experiment on an onsite early warning method for the Taiwan early warning system, Bull. Seism. Soc. Am., 95, 347-353.
Wu, S, Yamada, M., K. Tamaribuchi, and J. Beck (2014). Multi-events Earthquake Early Warning algorithm using a Bayesian approach. Geophysical Journal International.
気象庁の震度情報、防災科学技術研究所のK-NET,KiK-netの波形、気象庁の強震波形、関西地震観測研究協議会の強震波形、一元化震源カタログをを利用しました。
緊急地震速報を発表した地震の解析結果
山田真澄 ホーム