━━━━━━━━━━━━━━━━━━━━━━━━
2018年9月6日 北海道胆振東部地震
━━━━━━━━━━━━━━━━━━━━━━━━
1.地震について (Earthquake Information)
----------------------------------------------------
2018/09/06,03:07:59.581 42.6840 141.9992 36.0 6.6
----------------------------------------------------
Table1. Earthquake information. Origin time, Epicentral latitude, longitude, depth, and JMA magnitude from the left.(ref. Hi-net catalog)
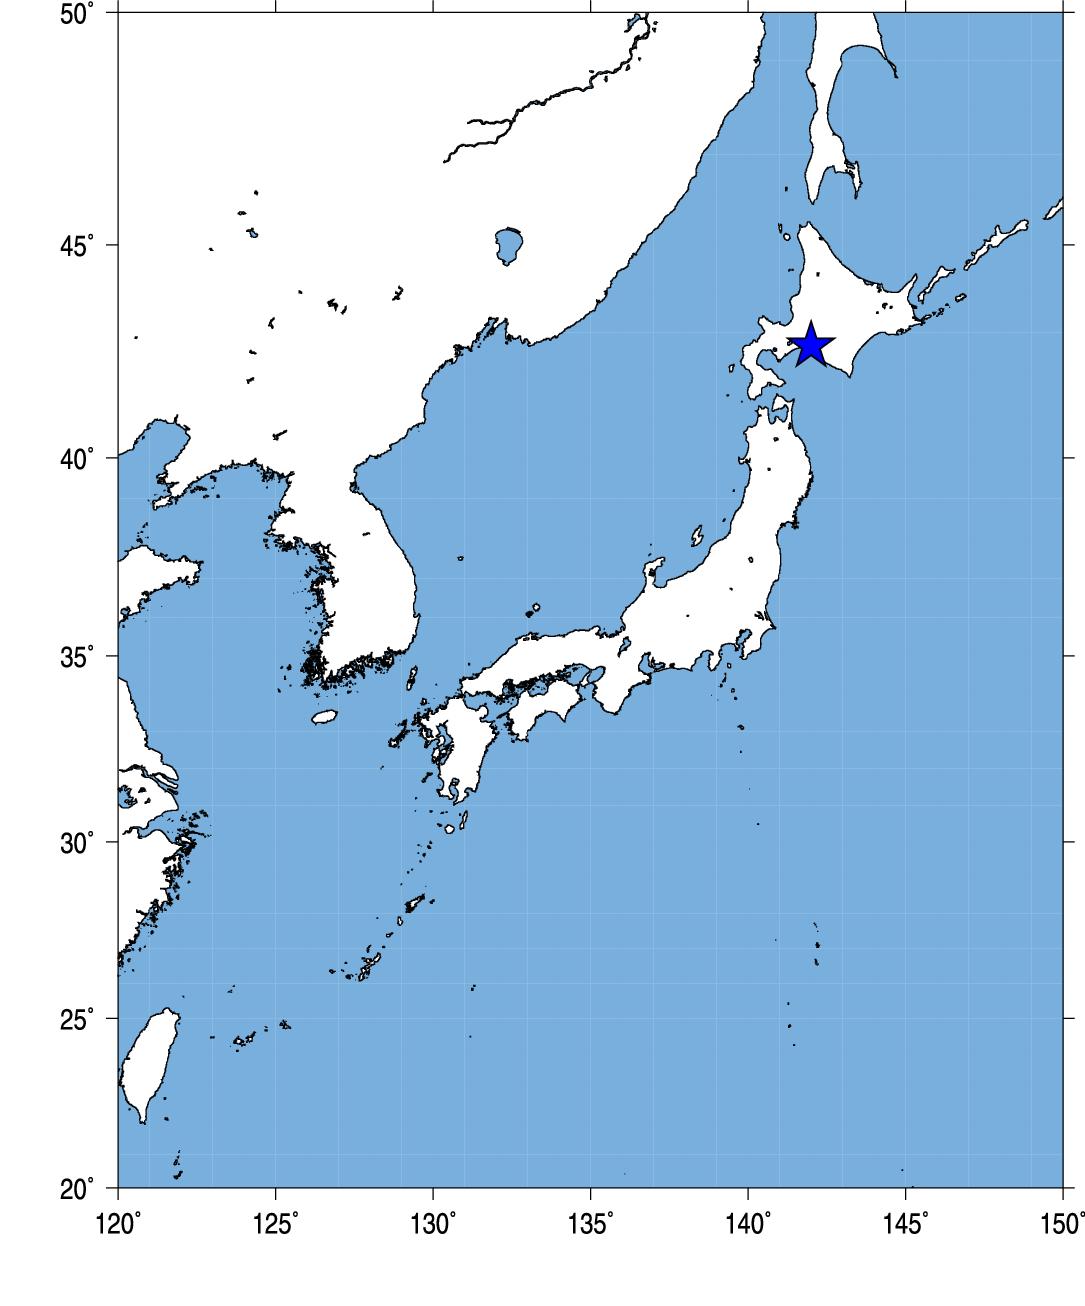
Fig.1. Event location.
2.観測点分布 (Station Distribution)
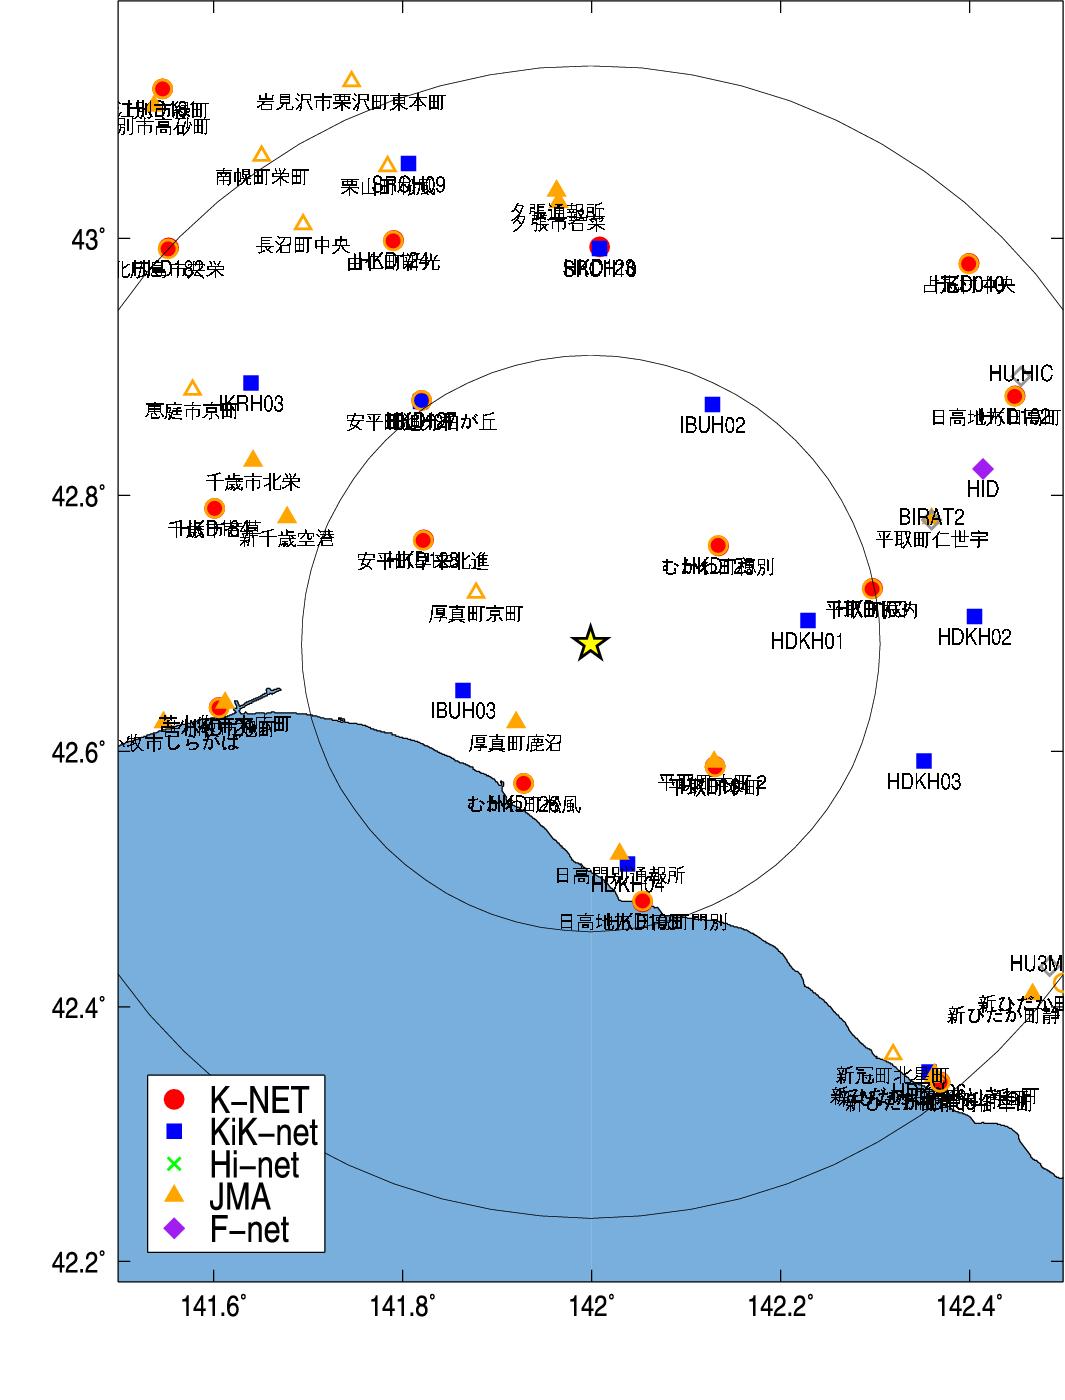
Fig.2. Station Distribution.
3.緊急地震速報発信状況 (Earthquake Early Warning Report)
-------------------------------------------------------------------[01] 18/09/06-03:07:59 04 M5.2 42.7N 142.0E 030km (18/09/06-03:08:10)
[16] 18/09/06-03:07:59 07 M6.3 42.7N 142.0E 040km (18/09/06-03:08:22)
[18] 18/09/06-03:07:59 07 M7.0 42.7N 142.0E 040km (18/09/06-03:08:24)
[19] 18/09/06-03:07:59 07 M7.0 42.7N 142.0E 040km (18/09/06-03:08:35)
[20] 18/09/06-03:07:59 07 M7.0 42.7N 142.0E 040km (18/09/06-03:08:36)
[21] 18/09/06-03:07:59 07 M7.0 42.7N 142.0E 040km (18/09/06-03:08:39)
[22] 18/09/06-03:07:59 07 M7.0 42.7N 142.0E 040km (18/09/06-03:09:01)
[23] 18/09/06-03:07:59 07 M7.0 42.7N 142.0E 040km (18/09/06-03:09:17)
[24] 18/09/06-03:07:59 07 M7.0 42.7N 142.0E 030km (18/09/06-03:09:38)
[25] 18/09/06-03:07:59 07 M7.0 42.7N 142.0E 030km (18/09/06-03:09:58)
[26] 18/09/06-03:07:59 07 M7.0 42.7N 142.0E 030km (18/09/06-03:10:16)
---------------------------------------------------------------------
(左から順に情報番号,震源時,最大予測震度,マグニチュード, 震央緯度,震央経度,震源深さ,電文発表時刻) from CEORKA
-------------------------------------------------------------------
Table2. Earthquake early warning reports. Information ID, Origin time, Maximum Intensity, JMA magnitude, Epicentral latitude, longitude, depth, and time to issue the report from the left.(ref. The Committee of Earthquake Observation and Research in the Kansai Area)
--> 気象庁による緊急地震速報の内容
4.観測記録 (Observed Records)
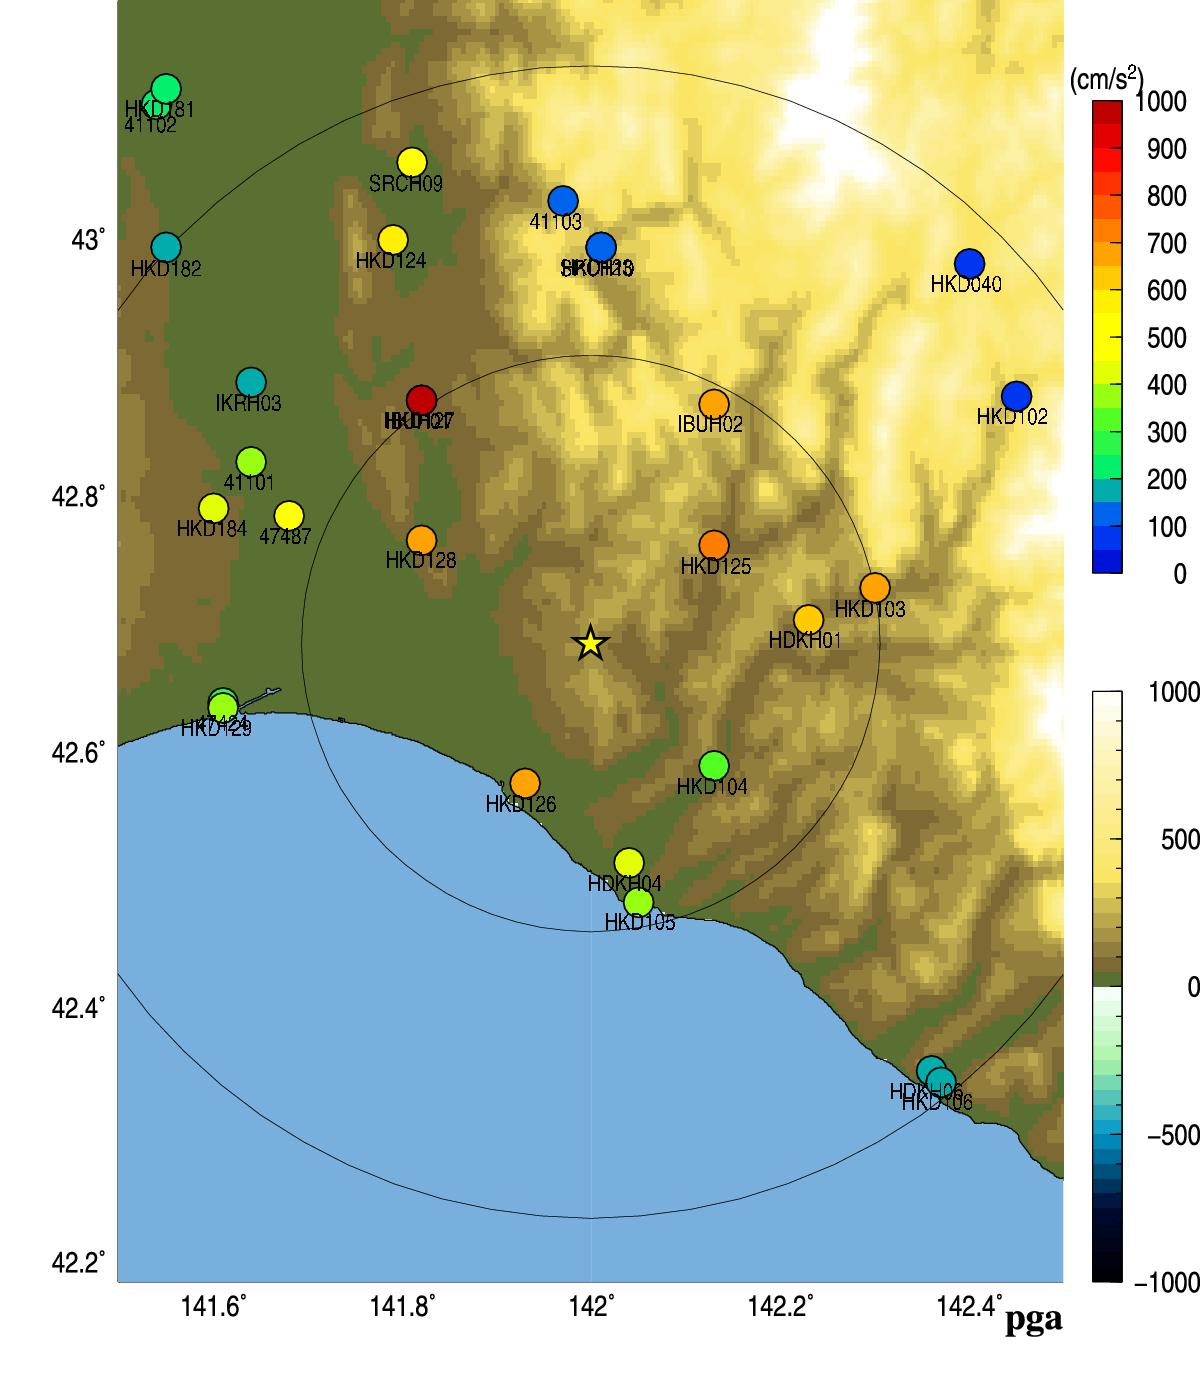
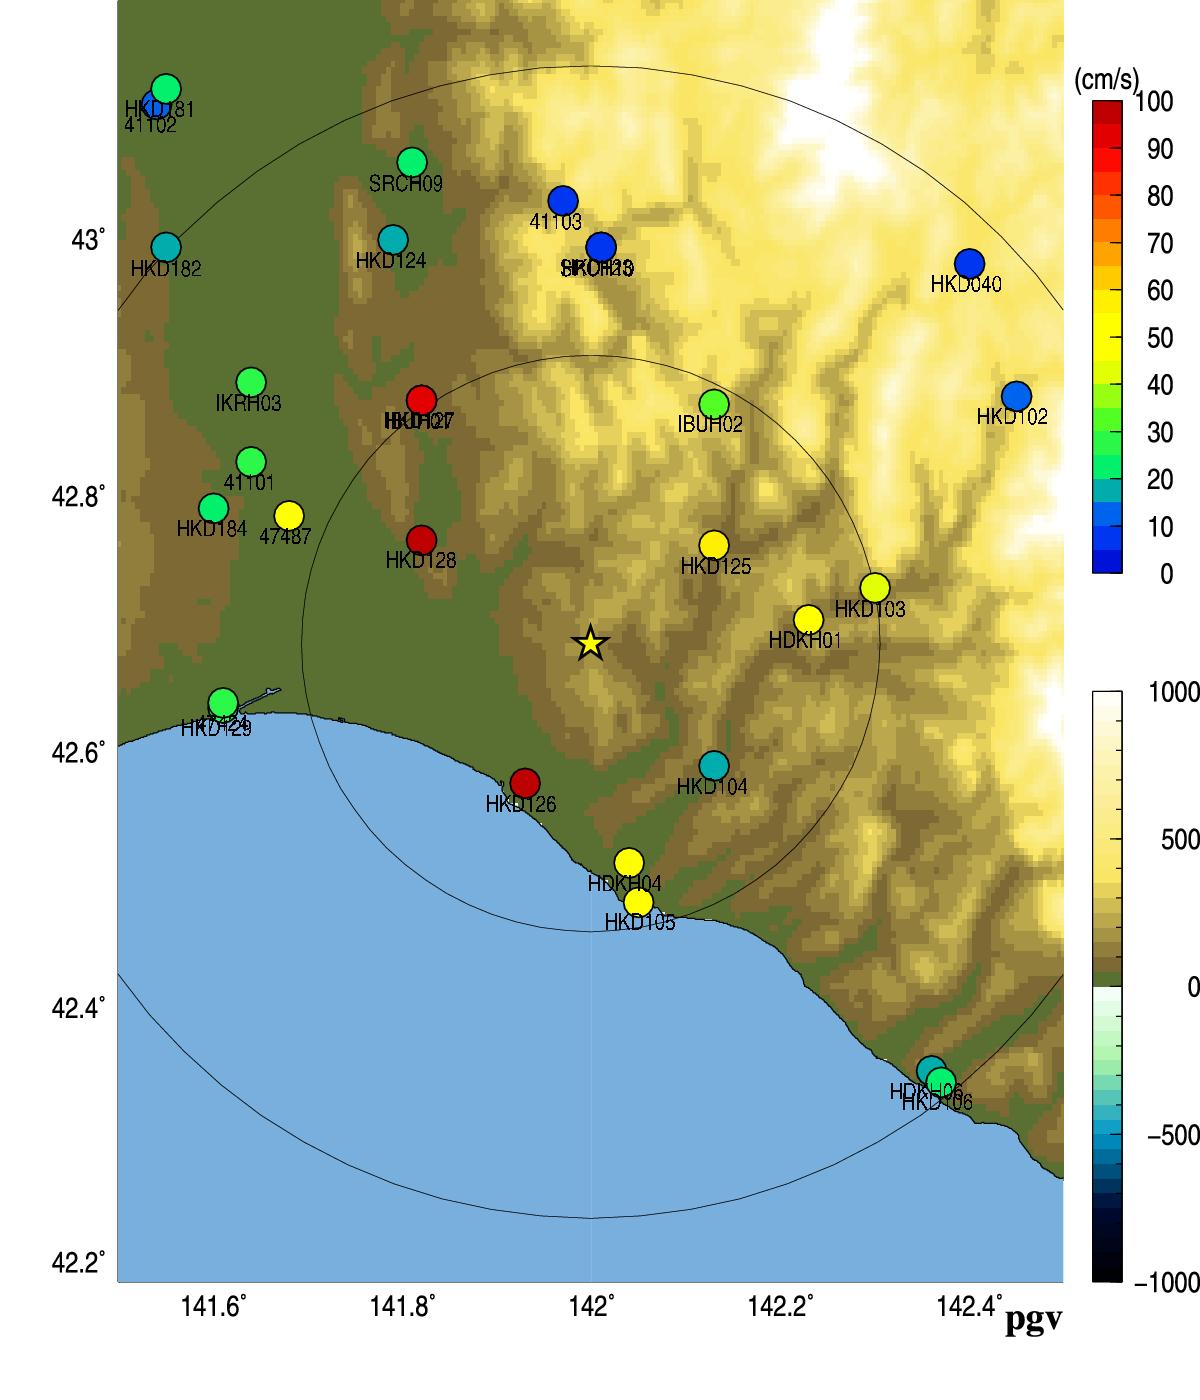
Fig.3. Peak Ground Acceleration (left) and Peak Ground Velocity (right).
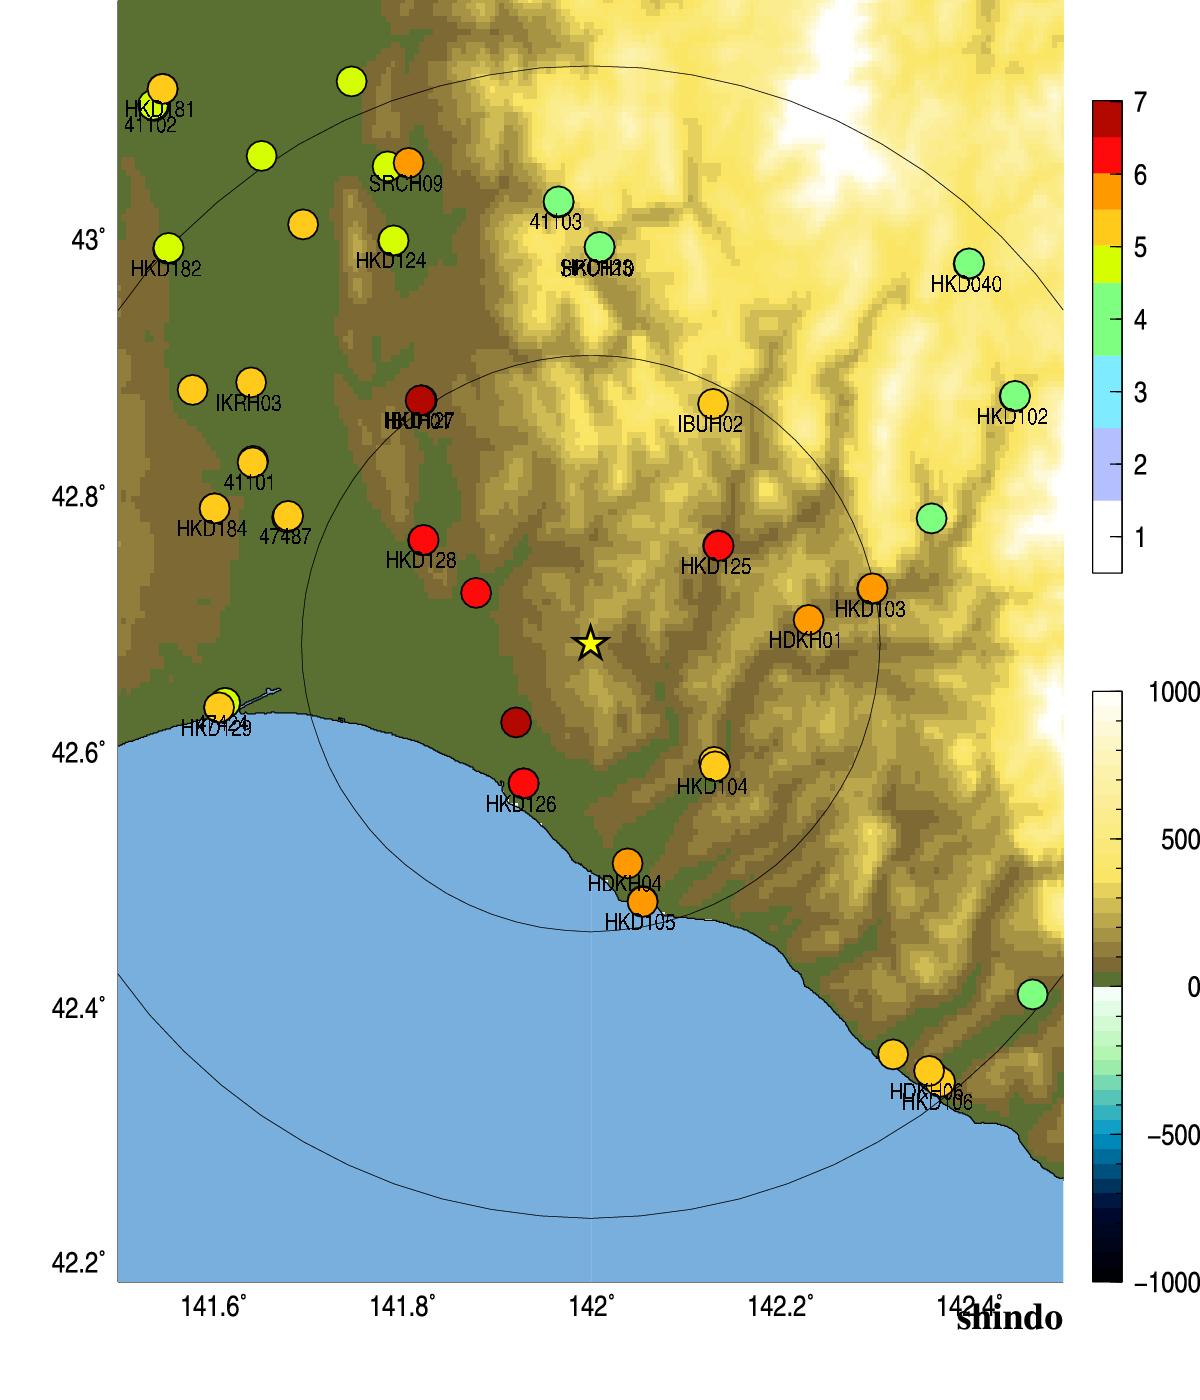
Fig.4. JMA seismic intensity.
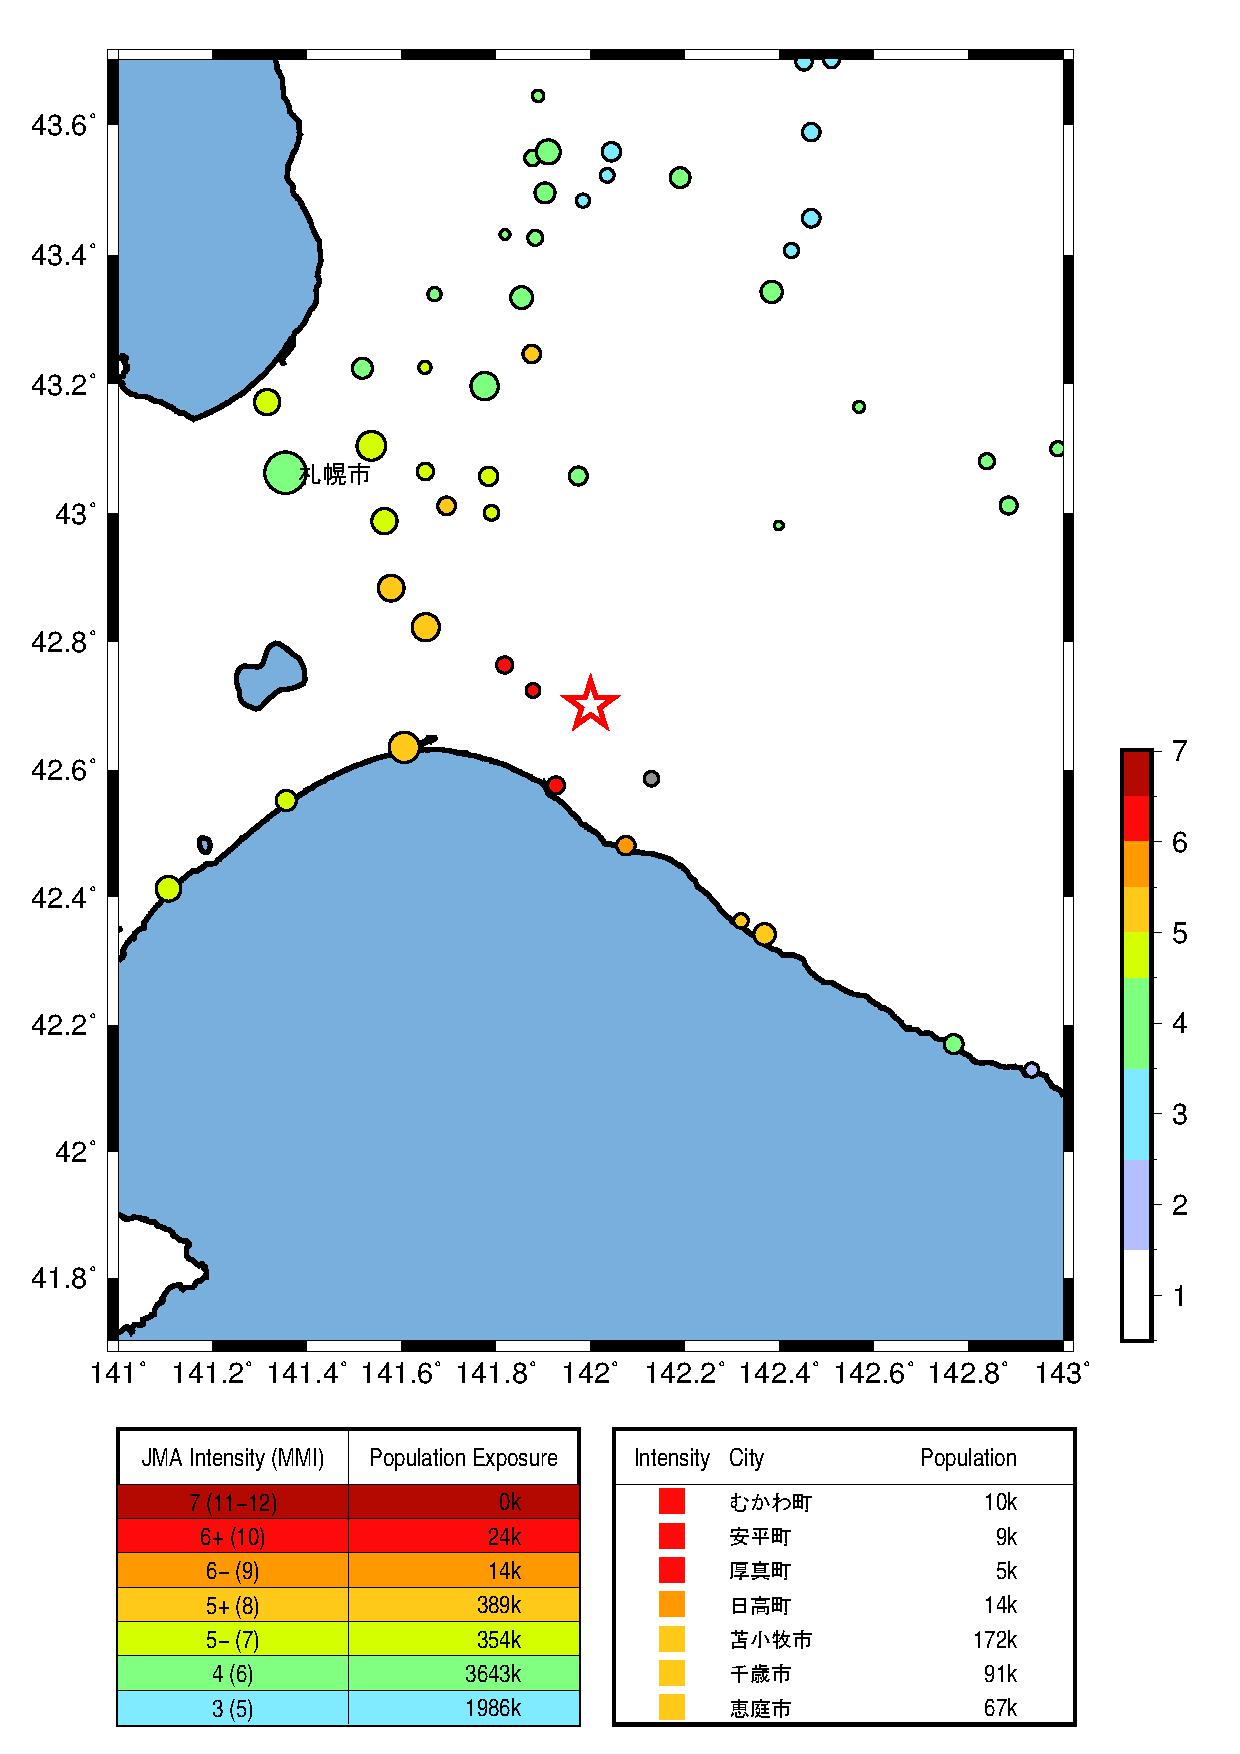
Fig.5. Population exposure. A circle size shows the population at the town, and a circle color shows the seismic intensity at the town.
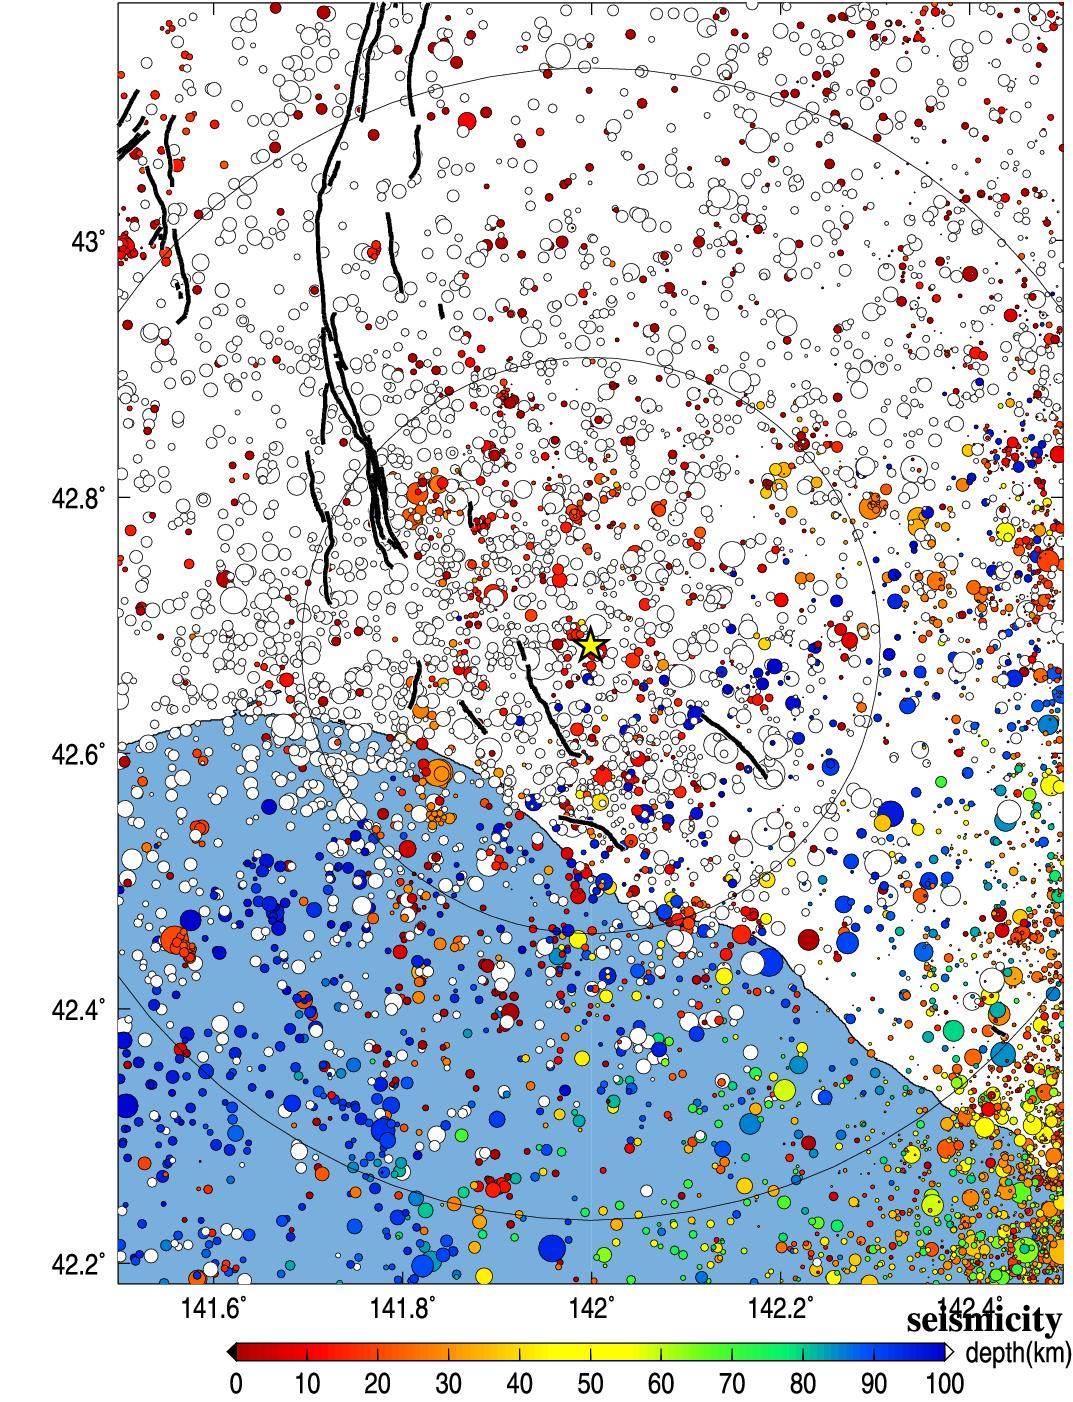
Fig.6. Seismic activity of past 40 years.
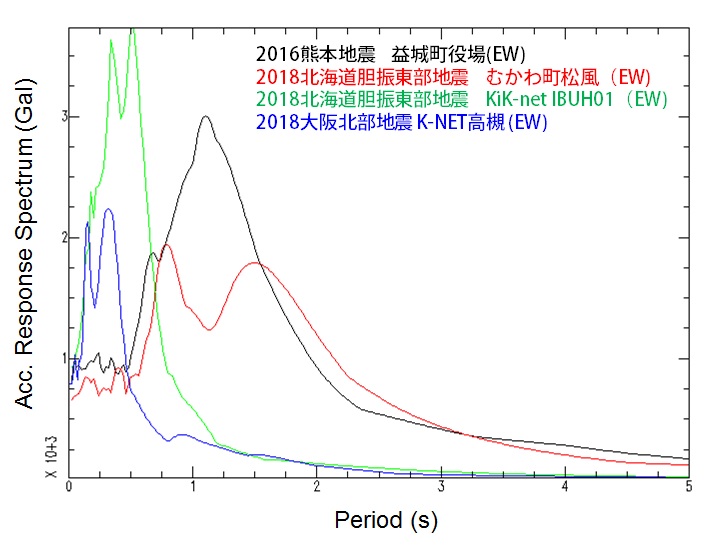
Fig.7. Acceleration response spectra for 2016 Kumamoto, 2018 Osaka and 2018 Hokkaido Iburi East earthquakes.
5.解析結果 (Analytical Result)
-------------------------------------------------------
HKD1261809060308 141.928 42.575 0.727 5.969 13.447 6.7 5.2
HKD1251809060308 142.135 42.761 0.864 6.119 13.992 6.7 5.3
HKD1041809060308 142.131 42.589 1.059 5.929 15.138 6.7 5.5
HKD1281809060308 141.822 42.765 0.250 6.009 17.100 6.7 4.2
HDKH011809060308 142.230 42.703 1.396 6.379 18.998 6.7 5.8
HDKH041809060308 142.038 42.513 1.010 6.339 19.306 6.7 5.5
HKD1051809060308 142.054 42.482 0.913 6.679 22.836 6.7 5.4
IBUH021809060308 142.128 42.871 0.823 6.879 23.352 6.7 5.3
HKD1031809060308 142.297 42.728 0.866 7.229 24.896 6.7 5.3
HKD1271809060308 141.820 42.874 0.362 6.929 25.692 6.7 4.5
Observed/Estimated Mw(median) tauc 6.7 5.3 0.9
-------------------------------------------------------
Table3. Analytical results using Tau_c method (Wu and Kanamori, 2005). Station ID, Station longitude, latitude, tauc, P-arrival time, epicentral distance(km) , magnitude, and estimated magnitude from the left.
Wu, Y. M. and H. Kanamori (2005). Experiment on an onsite early warning method for the Taiwan early warning system, Bull. Seism. Soc. Am., 95, 347-353.
Wu, S, Yamada, M., K. Tamaribuchi, and J. Beck (2014). Multi-events Earthquake Early Warning algorithm using a Bayesian approach. Geophysical Journal International.
気象庁の震度情報、防災科学技術研究所のK-NET,KiK-netの波形、気象庁の強震波形、関西地震観測研究協議会の強震波形、一元化震源カタログをを利用しました。
緊急地震速報を発表した地震の解析結果
山田真澄 ホーム