━━━━━━━━━━━━━━━━━━━━━━━━
2018年4月9日 島根県の地震
━━━━━━━━━━━━━━━━━━━━━━━━
1.地震について (Earthquake Information)
----------------------------------------------------
2018/04/09,01:32:30.81 35.185 132.587 12.1 6.1
----------------------------------------------------
Table1. Earthquake information. Origin time, Epicentral latitude, longitude, depth, and JMA magnitude from the left.(ref. Hi-net catalog)
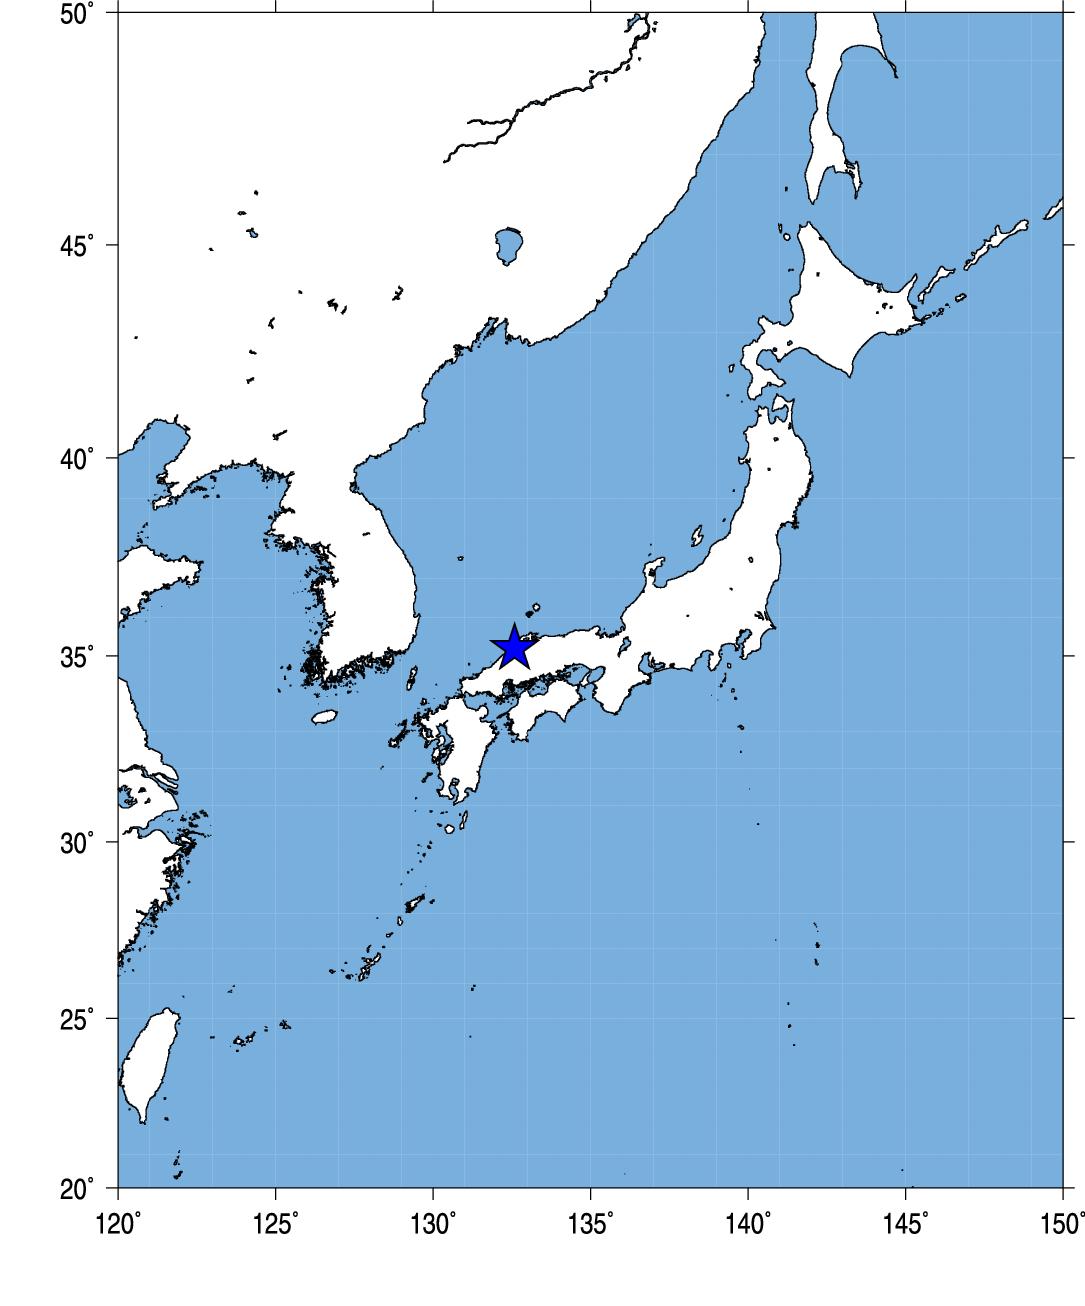
Fig.1. Event location.
2.観測点分布 (Station Distribution)
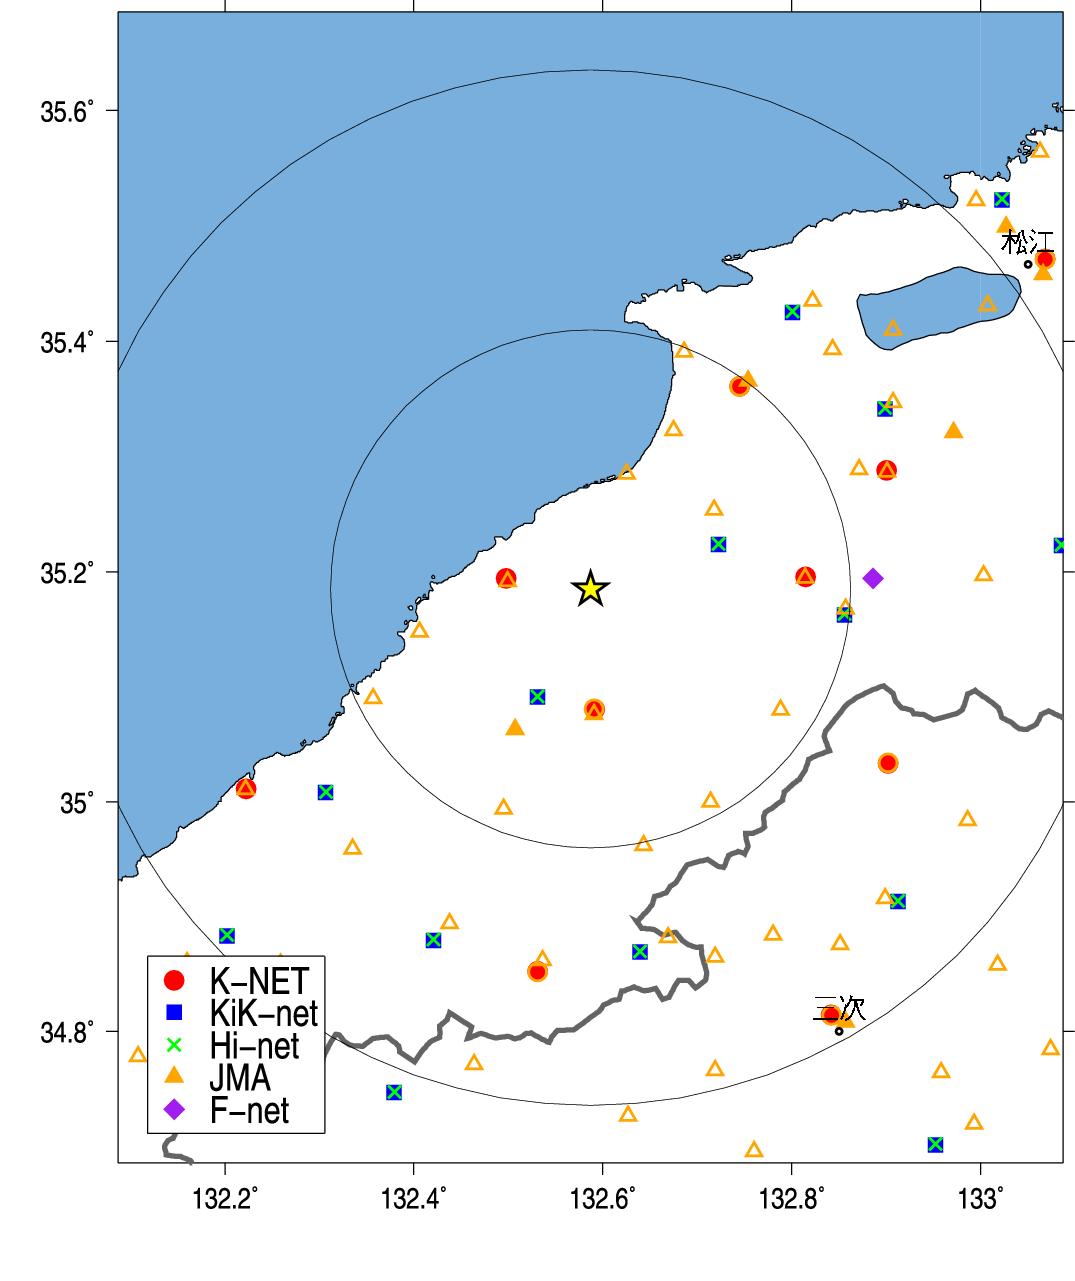
Fig.2. Station Distribution.
3.緊急地震速報発信状況 (Earthquake Early Warning Report)
-------------------------------------------------------------------[02] 18/04/09-01:32:32 0* M5.3 35.0N 132.5E 010km (18/04/09-01:32:38)
[09] 18/04/09-01:32:30 5+ M5.8 35.2N 132.6E 010km (18/04/09-01:32:56)
[11] 18/04/09-01:32:30 5+ M5.8 35.2N 132.6E 010km (18/04/09-01:33:23)
[12] 18/04/09-01:32:30 5+ M5.8 35.2N 132.6E 010km (18/04/09-01:33:33)
[13] 18/04/09-01:32:30 5+ M5.8 35.2N 132.6E 010km (18/04/09-01:33:54)
[14] 18/04/09-01:32:30 5+ M5.8 35.2N 132.6E 010km (18/04/09-01:34:00)
---------------------------------------------------------------------
(左から順に情報番号,震源時,最大予測震度,マグニチュード, 震央緯度,震央経度,震源深さ,電文発表時刻) from CEORKA
-------------------------------------------------------------------
Table2. Earthquake early warning reports. Information ID, Origin time, Maximum Intensity, JMA magnitude, Epicentral latitude, longitude, depth, and time to issue the report from the left.(ref. The Committee of Earthquake Observation and Research in the Kansai Area)
--> 気象庁による緊急地震速報の内容
4.観測記録 (Observed Records)
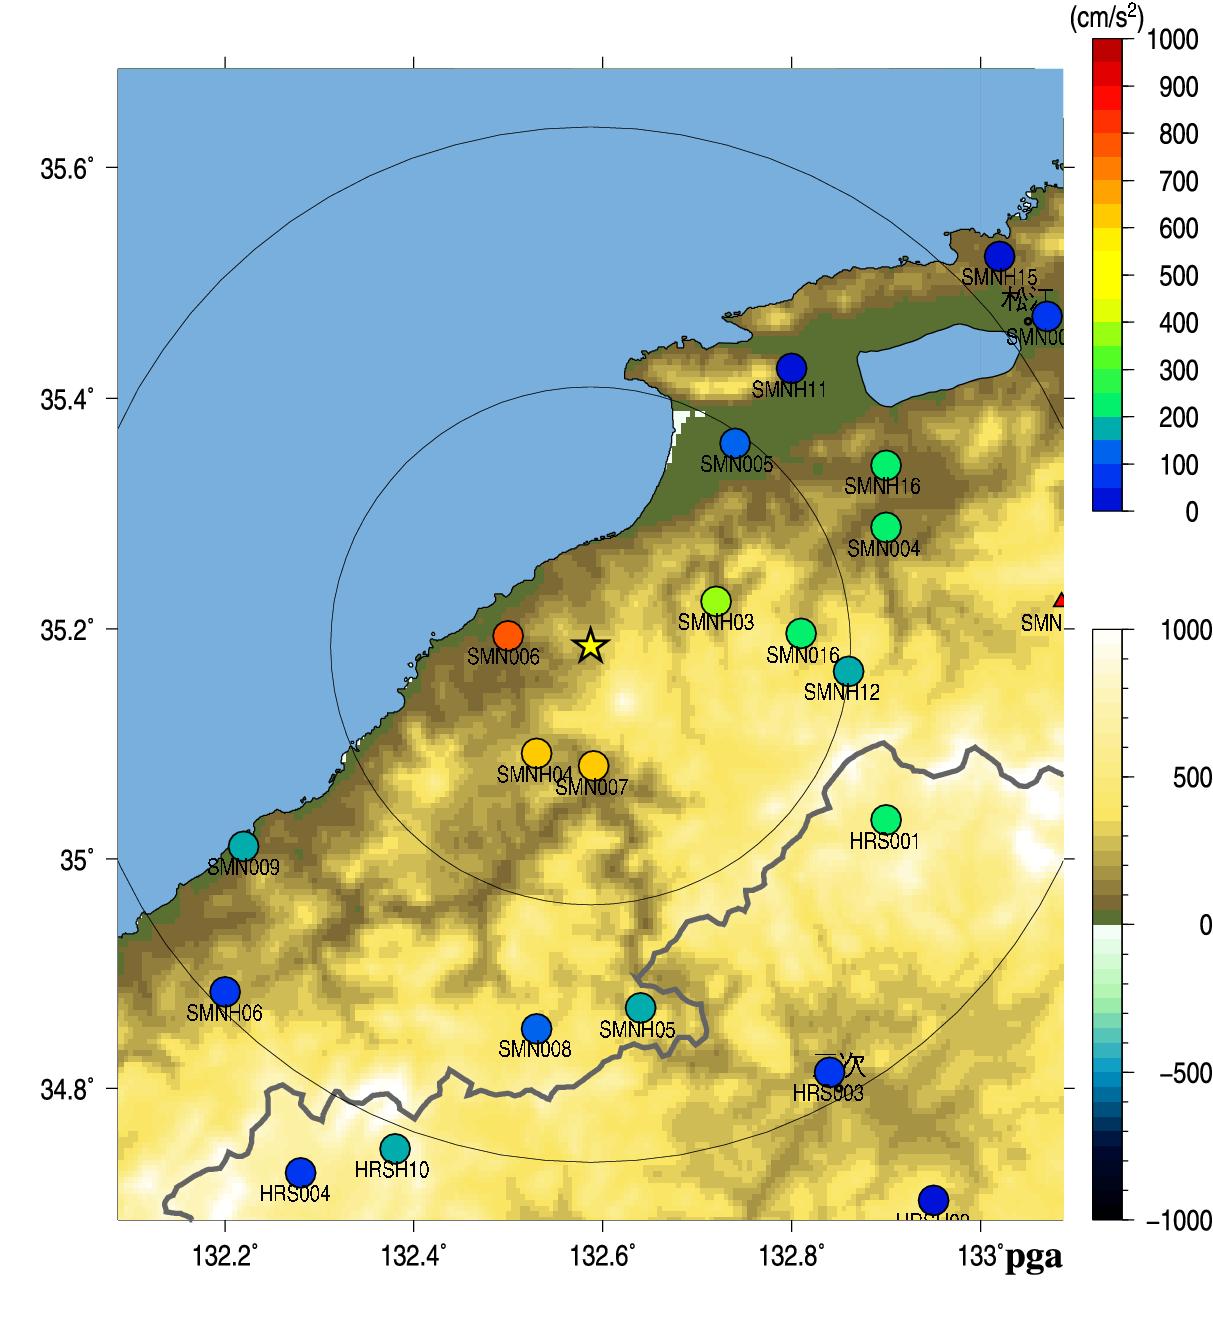
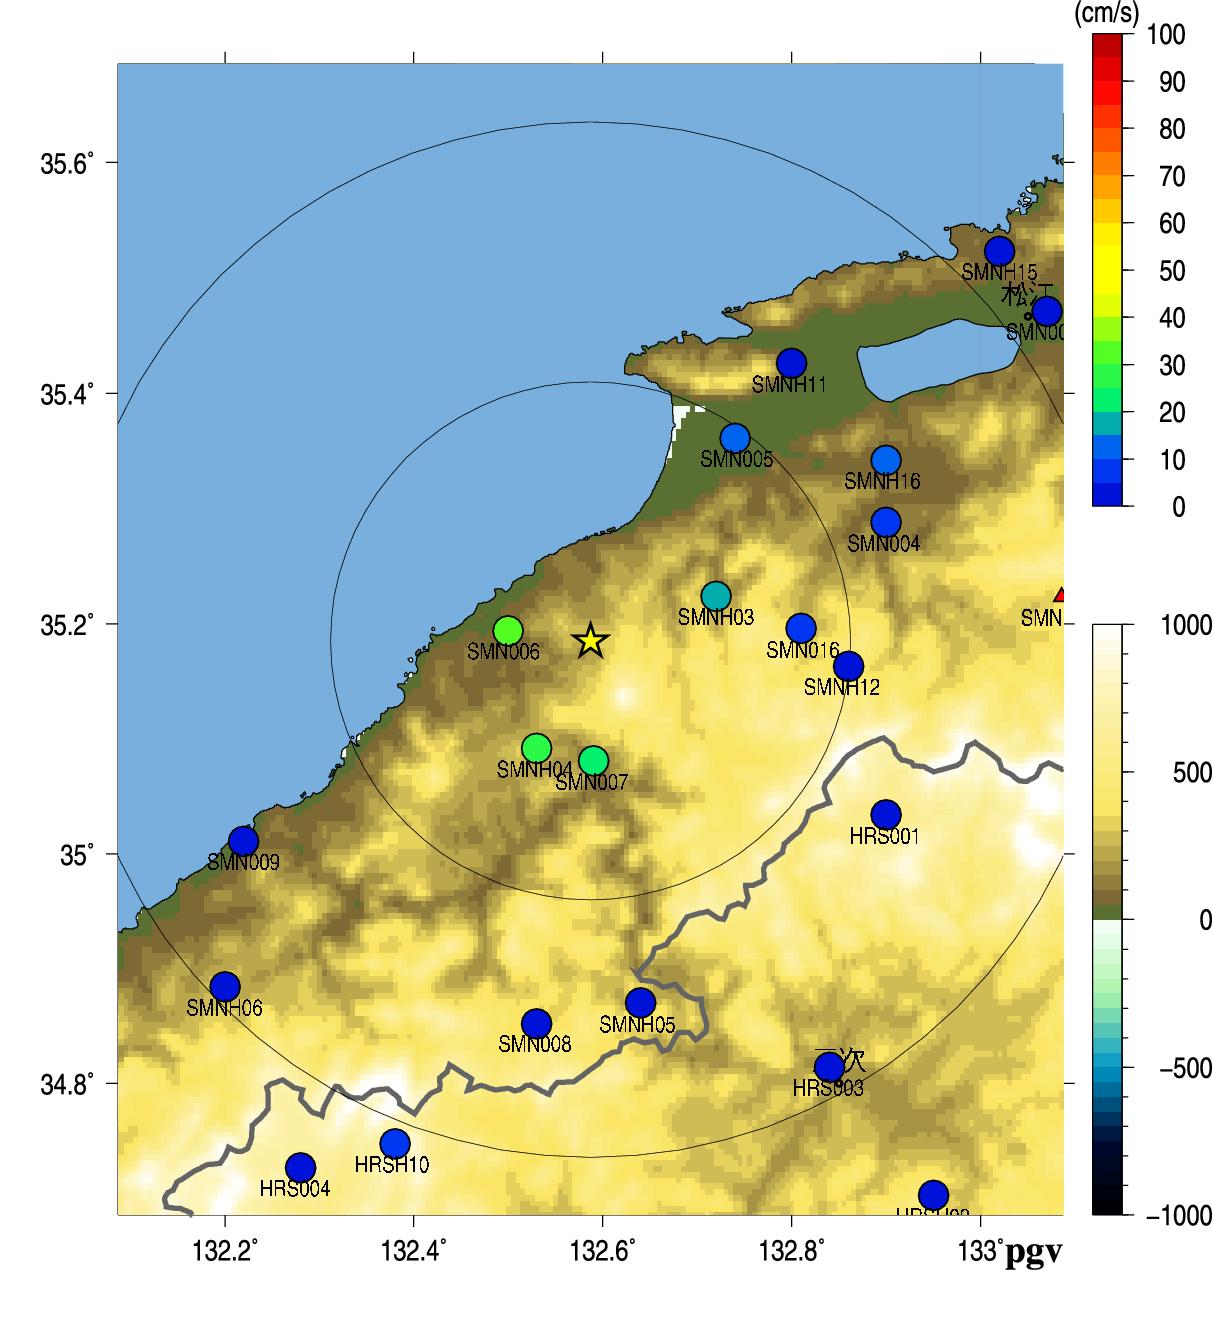
Fig.3. Peak Ground Acceleration (left) and Peak Ground Velocity (right).
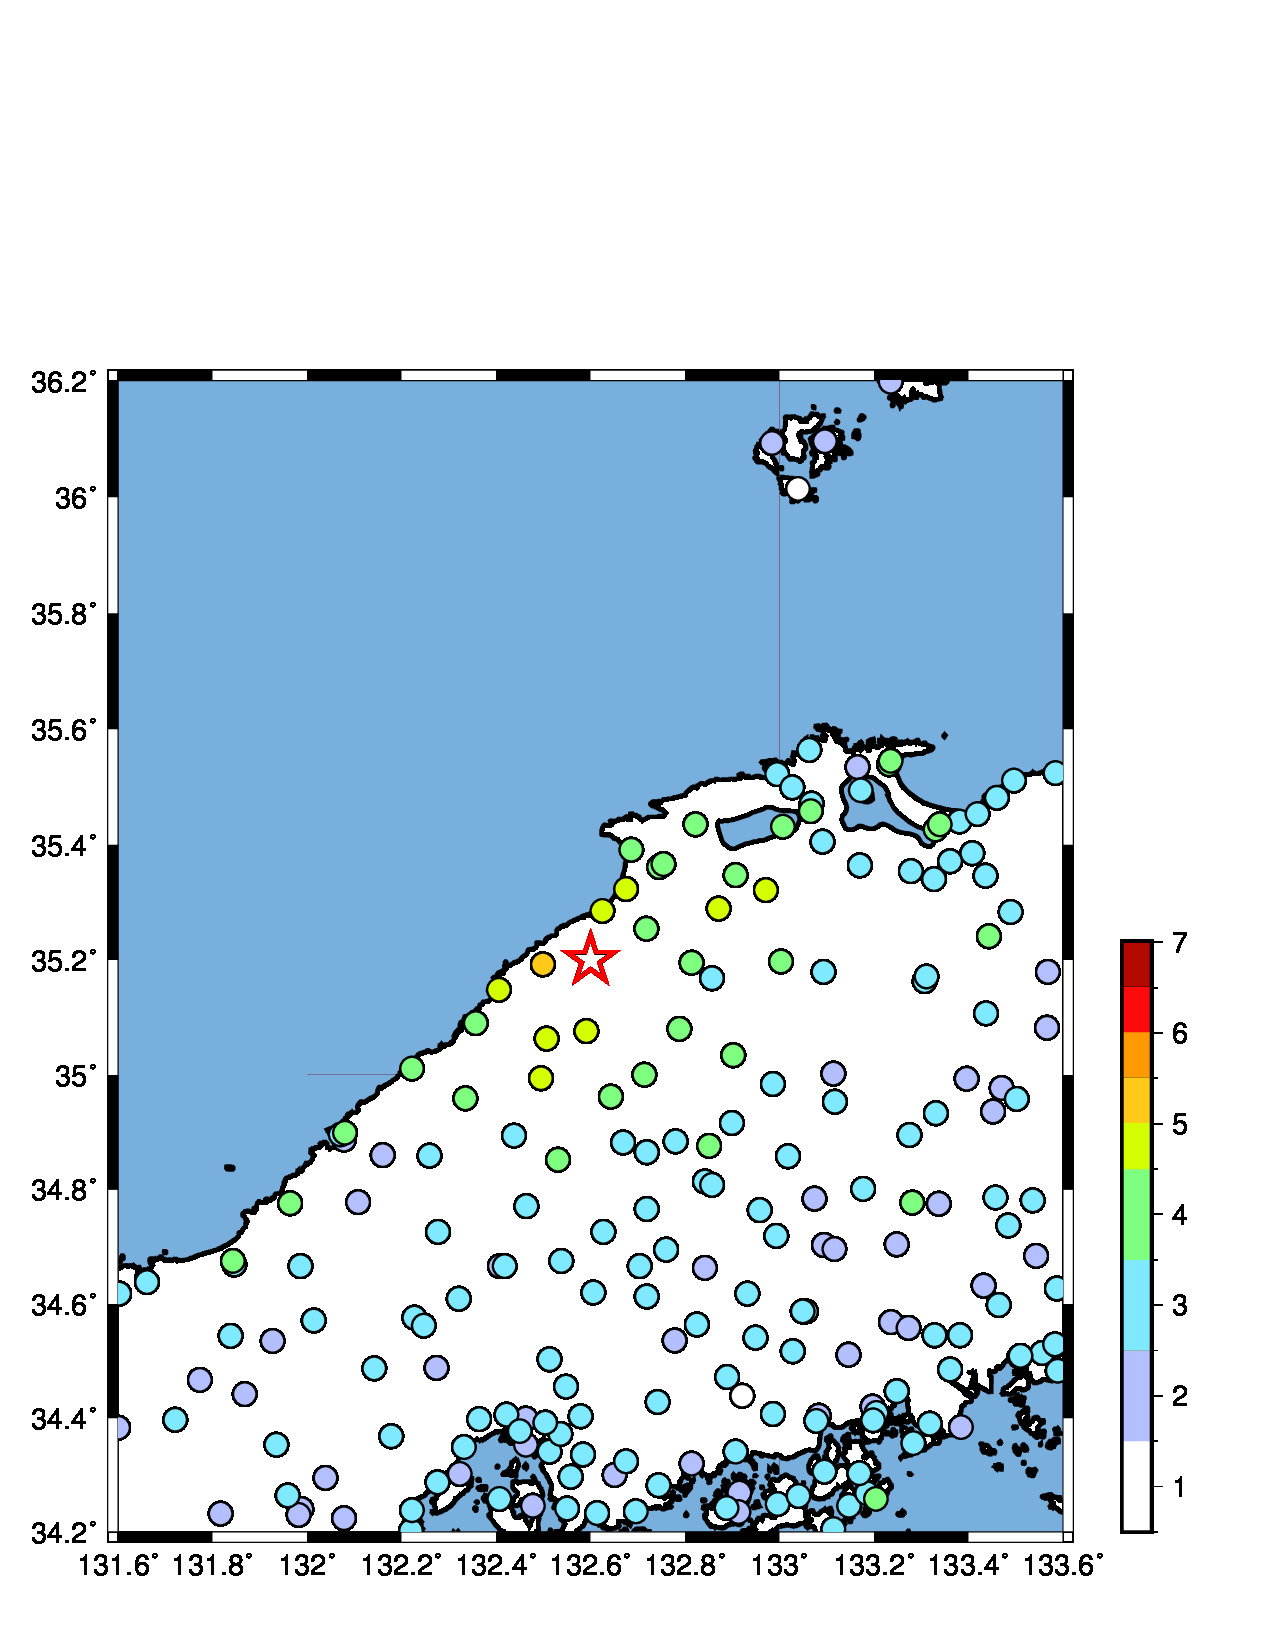
Fig.4. JMA seismic intensity.
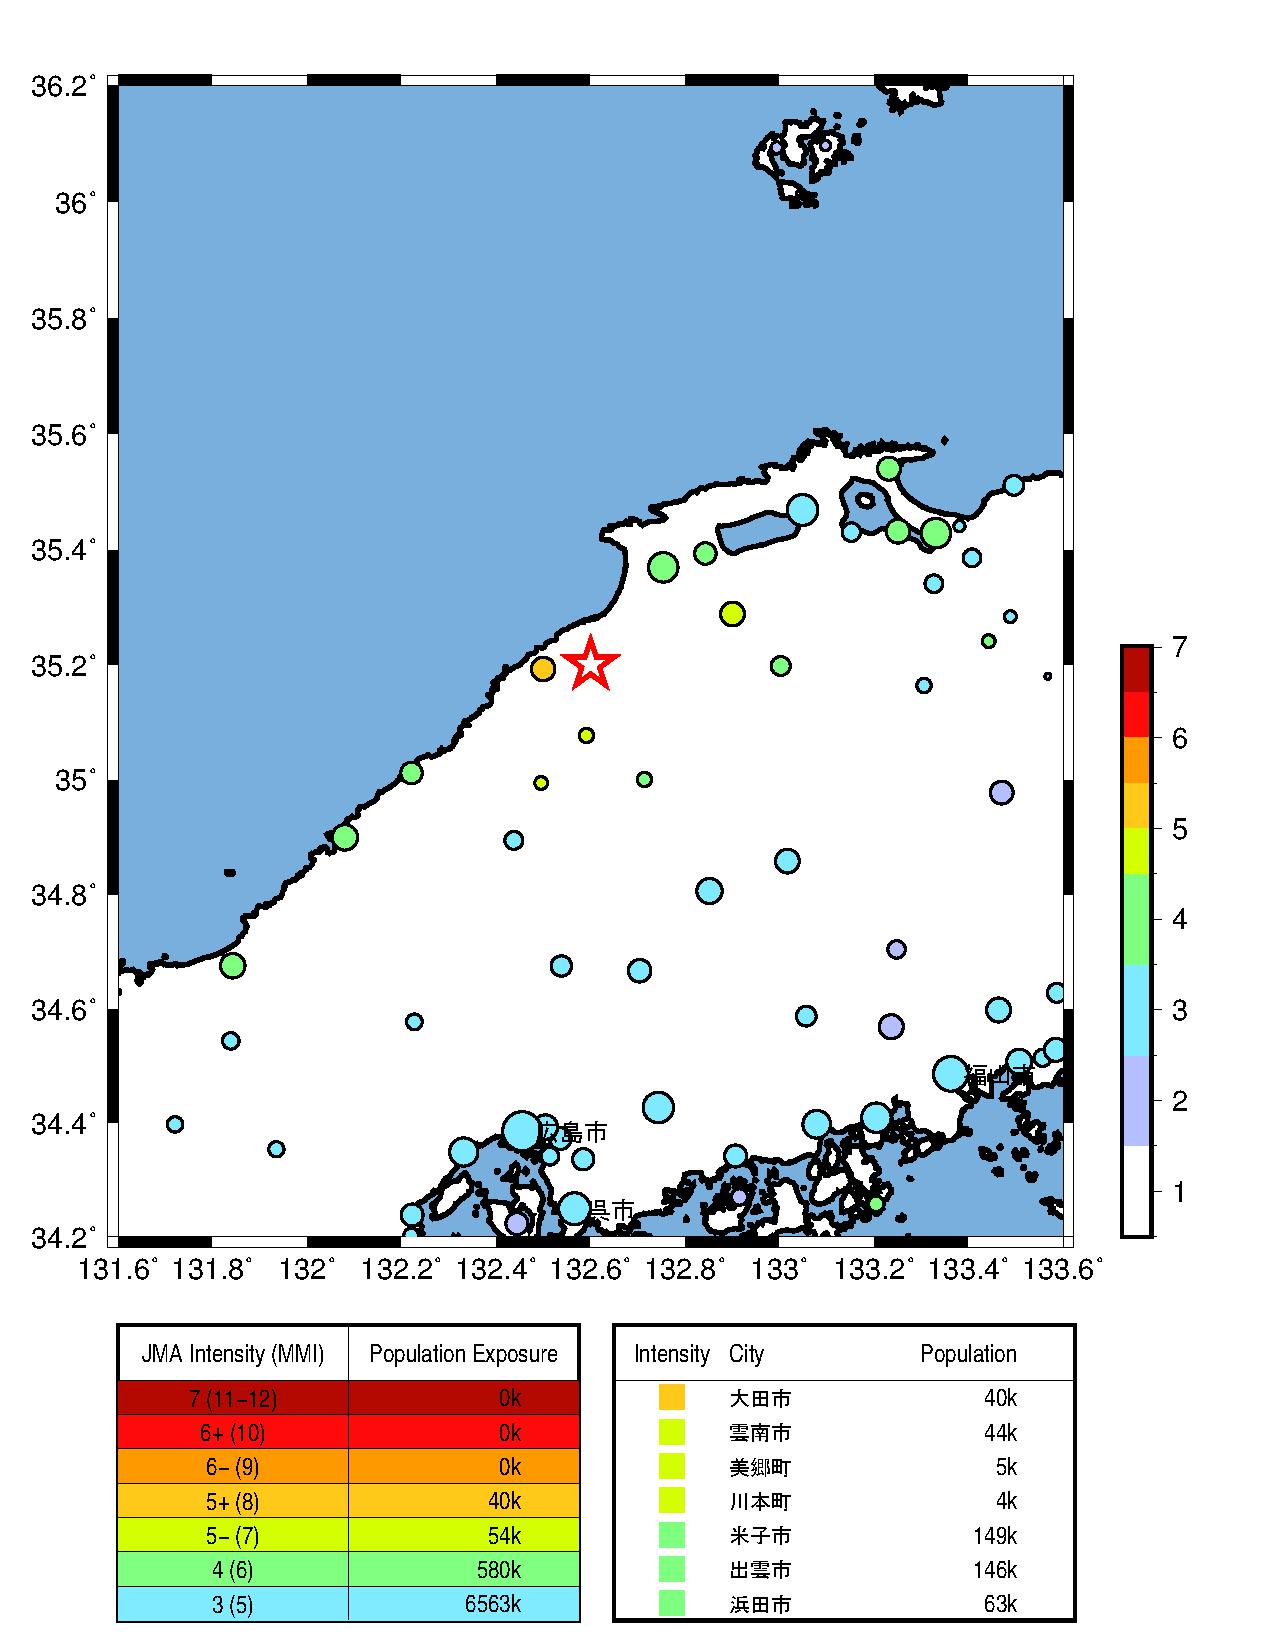
Fig.5. Population exposure. A circle size shows the population at the town, and a circle color shows the seismic intensity at the town.
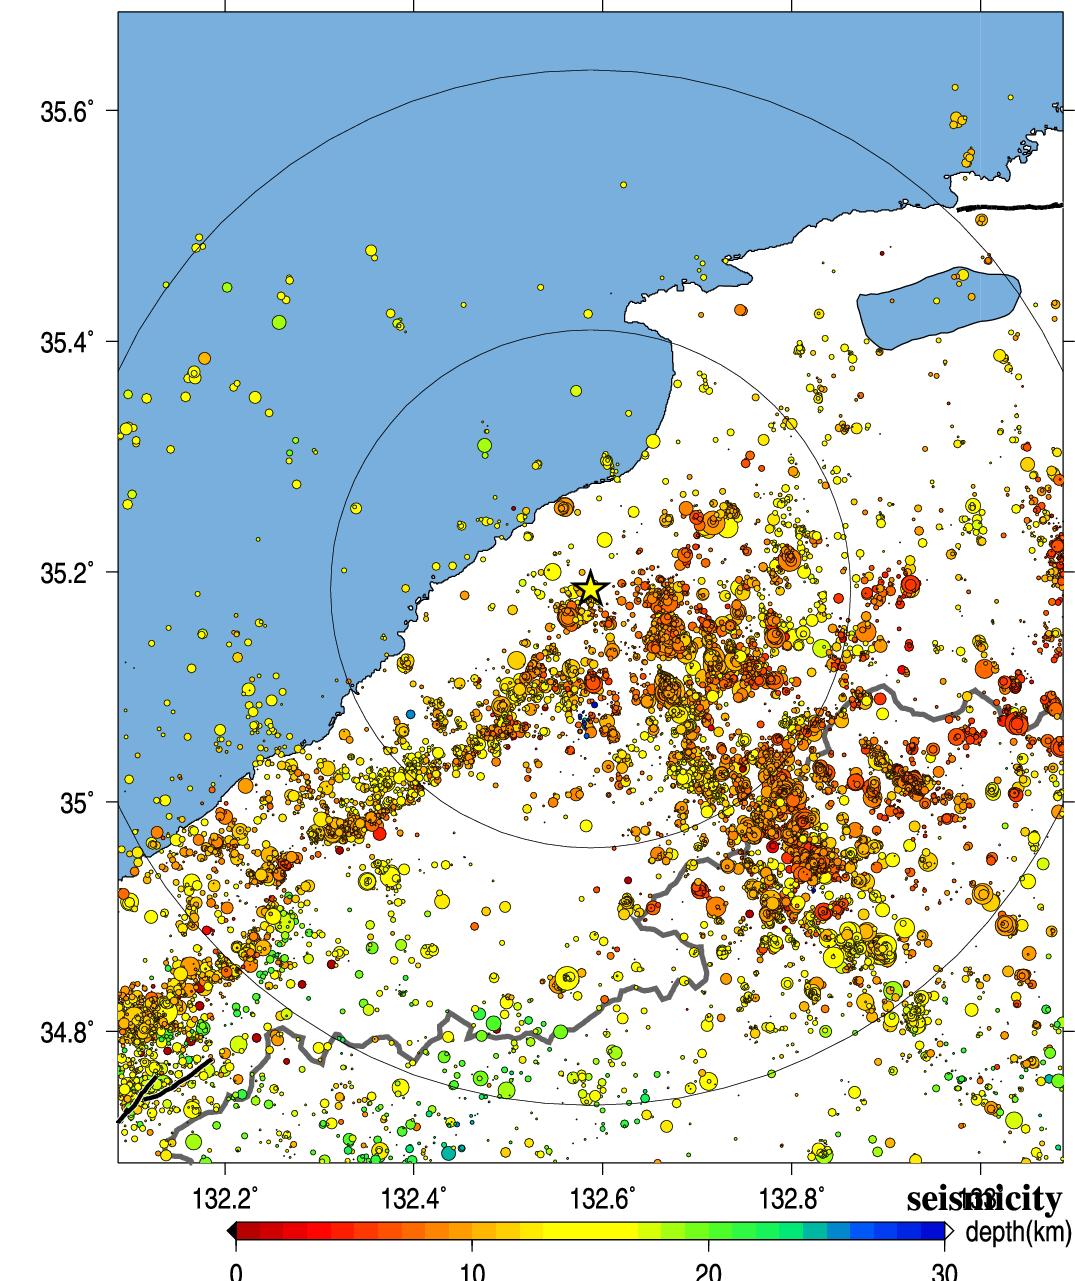
Fig.6. Seismic activity of past 40 years.
5.解析結果 (Analytical Result)
-------------------------------------------------------
SMN0061804090132 132.498 35.194 1.116 33.440 8.188 6.1 5.6
SMNH041804090132 132.531 35.092 1.038 33.820 11.539 6.1 5.5
SMN0071804090132 132.591 35.081 0.930 33.840 11.578 6.1 5.4
SMNH031804090132 132.722 35.224 0.848 33.970 13.069 6.1 5.3
SMN0161804090132 132.815 35.196 0.863 34.970 20.763 6.1 5.3
SMN0051804090132 132.745 35.361 1.078 35.930 24.251 6.1 5.5
SMNH121804090132 132.856 35.163 0.885 35.540 24.603 6.1 5.4
SMN0041804090132 132.900 35.288 0.585 36.490 30.735 6.1 5.0
SMNH111804090132 132.801 35.426 1.269 37.160 33.051 6.1 5.7
HRS0011804090132 132.902 35.034 0.452 37.020 33.247 6.1 4.8
Observed/Estimated Mw(median) tauc 6.1 5.4 0.9
-------------------------------------------------------
Table3. Analytical results using Tau_c method (Wu and Kanamori, 2005). Station ID, Station longitude, latitude, tauc, P-arrival time, epicentral distance(km) , magnitude, and estimated magnitude from the left.
Wu, Y. M. and H. Kanamori (2005). Experiment on an onsite early warning method for the Taiwan early warning system, Bull. Seism. Soc. Am., 95, 347-353.
Wu, S, Yamada, M., K. Tamaribuchi, and J. Beck (2014). Multi-events Earthquake Early Warning algorithm using a Bayesian approach. Geophysical Journal International.
気象庁の震度情報、防災科学技術研究所のK-NET,KiK-netの波形、気象庁の強震波形、関西地震観測研究協議会の強震波形、一元化震源カタログをを利用しました。
緊急地震速報を発表した地震の解析結果
山田真澄 ホーム