━━━━━━━━━━━━━━━━━━━━━━━━
2018年1月5日 茨城県沖の地震
━━━━━━━━━━━━━━━━━━━━━━━━
1.地震について (Earthquake Information)
----------------------------------------------------
2018/01/05,11:02:22.92 36.871 136.980 13.7 4.0
2018/01/05,11:02:25.57 35.895 140.890 41.1 4.5
----------------------------------------------------
Table1. Earthquake information. Origin time, Epicentral latitude, longitude, depth, and JMA magnitude from the left.(ref. Hi-net catalog)
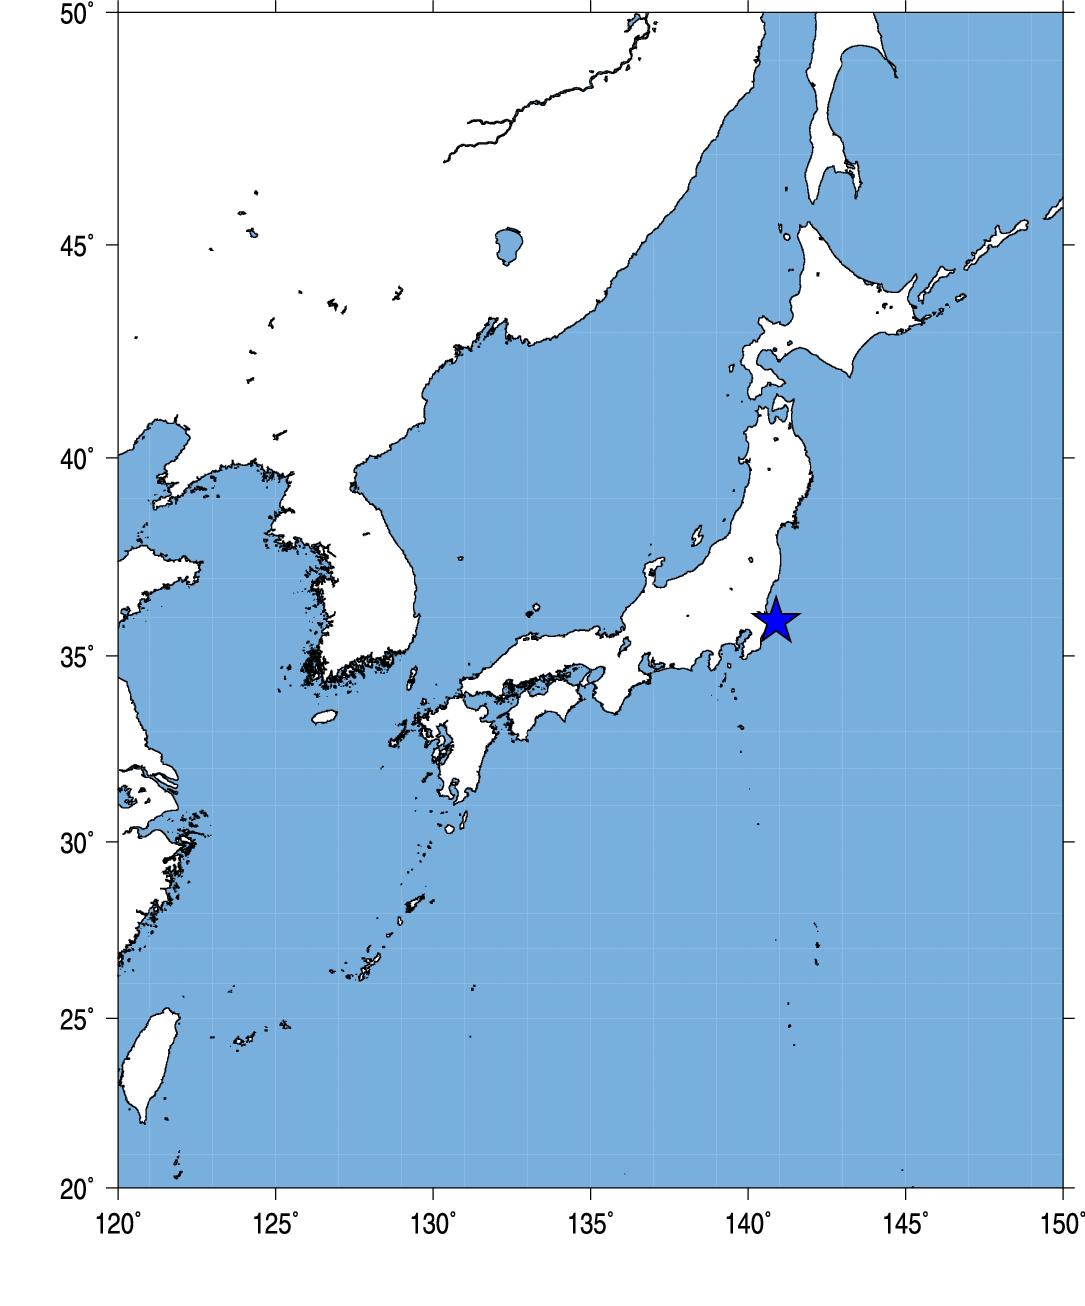
Fig.1. Event location.
2.観測点分布 (Station Distribution)
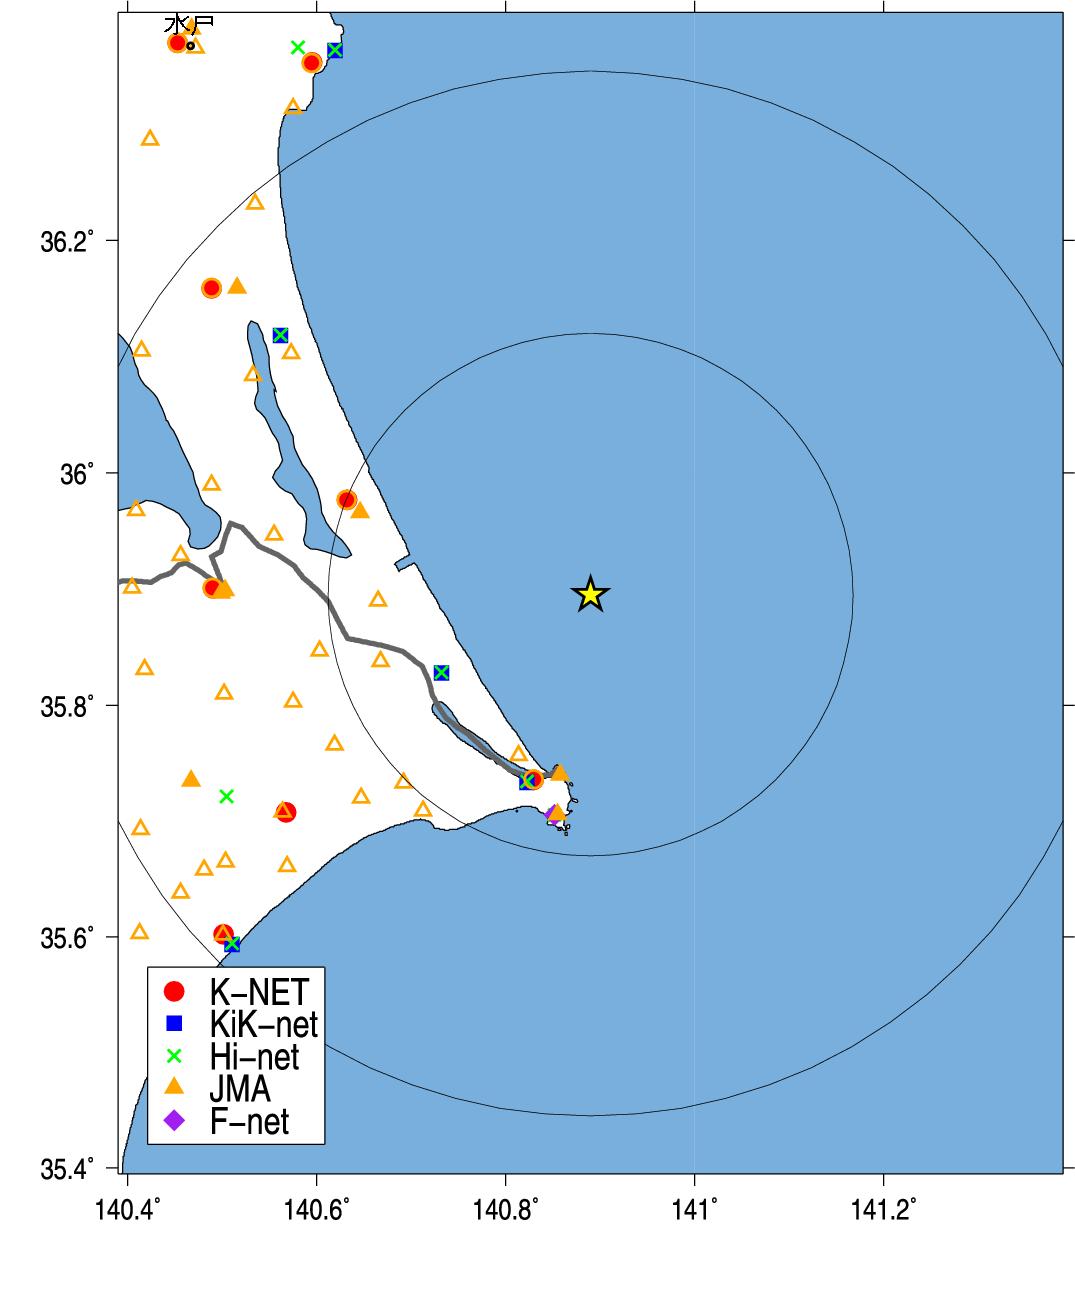
Fig.2. Station Distribution.
3.緊急地震速報発信状況 (Earthquake Early Warning Report)
-------------------------------------------------------------------[02] 18/01/05-11:02:23 03 M4.3 36.9N 137.0E 010km (18/01/05-11:02:32)
[03] 18/01/05-11:02:22 03 M4.3 36.9N 137.0E 010km (18/01/05-11:02:37)
[04] 18/01/05-11:02:26 5+ M6.4 35.9N 140.8E 030km (18/01/05-11:02:46)
[06] 18/01/05-11:02:26 5+ M6.4 35.9N 140.8E 030km (18/01/05-11:02:57)
[07] 18/01/05-11:02:26 5- M5.9 35.9N 140.8E 030km (18/01/05-11:03:10)
[08] 18/01/05-11:02:26 5- M5.9 35.9N 140.8E 030km (18/01/05-11:03:30)
[09] 18/01/05-11:02:26 5- M5.9 35.9N 140.8E 030km (18/01/05-11:03:41)
---------------------------------------------------------------------
(左から順に情報番号,震源時,最大予測震度,マグニチュード, 震央緯度,震央経度,震源深さ,電文発表時刻) from CEORKA
-------------------------------------------------------------------
Table2. Earthquake early warning reports. Information ID, Origin time, Maximum Intensity, JMA magnitude, Epicentral latitude, longitude, depth, and time to issue the report from the left.(ref. The Committee of Earthquake Observation and Research in the Kansai Area)
--> 気象庁による緊急地震速報の内容
4.観測記録 (Observed Records)
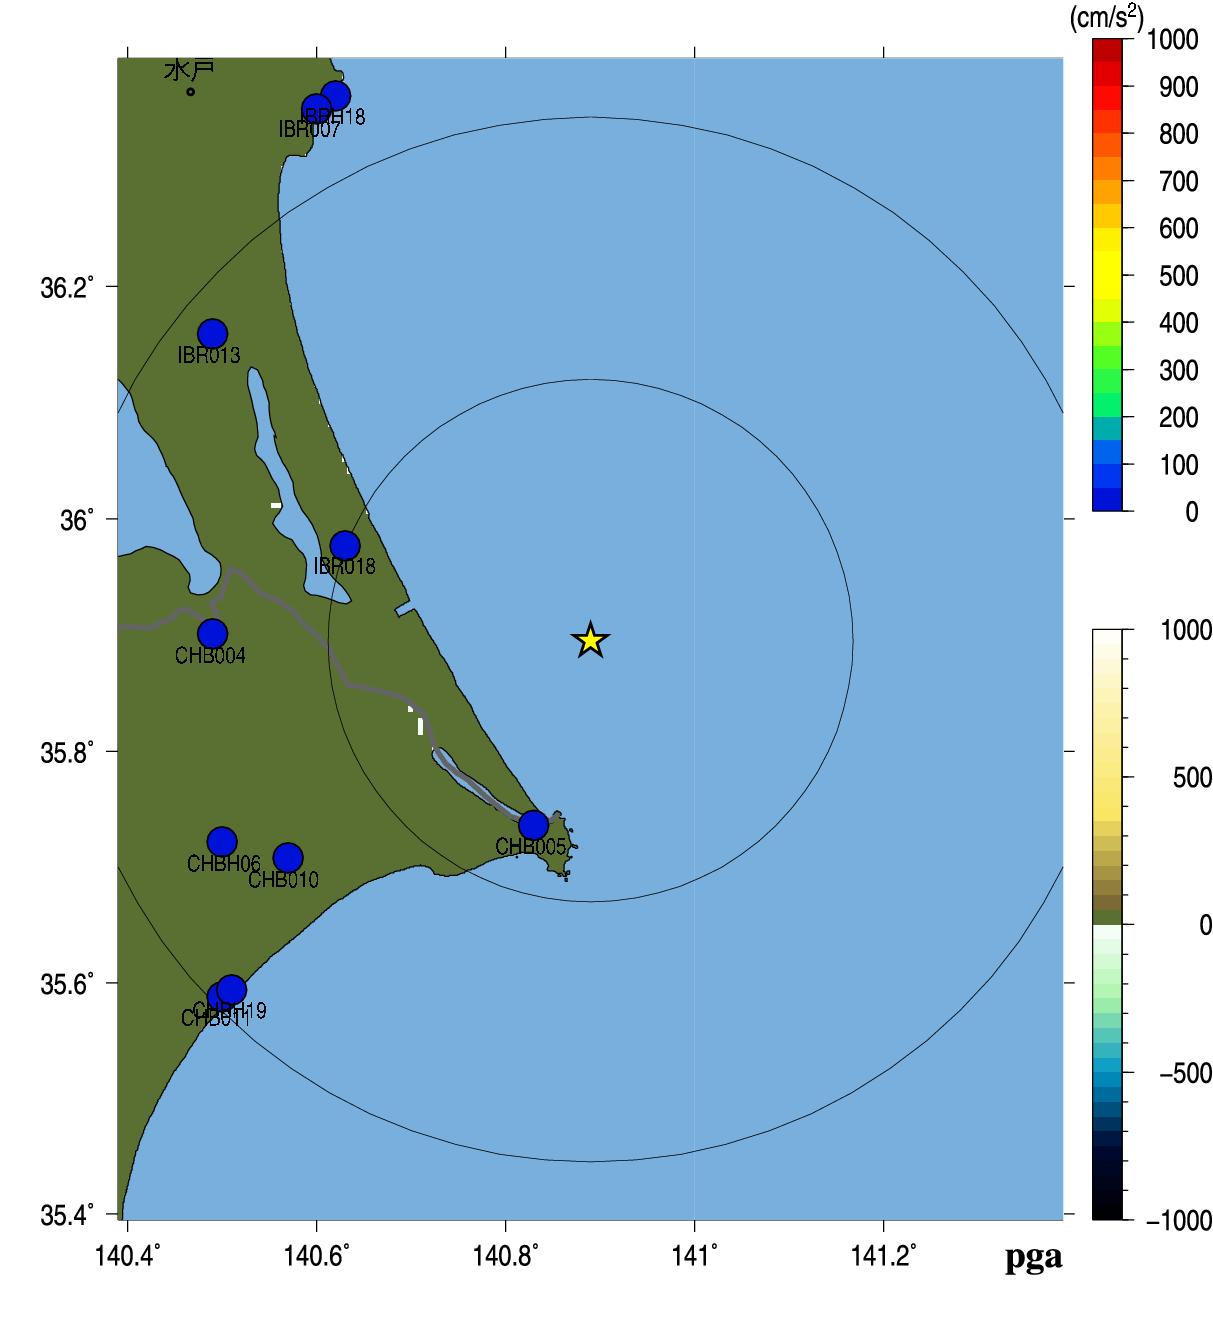
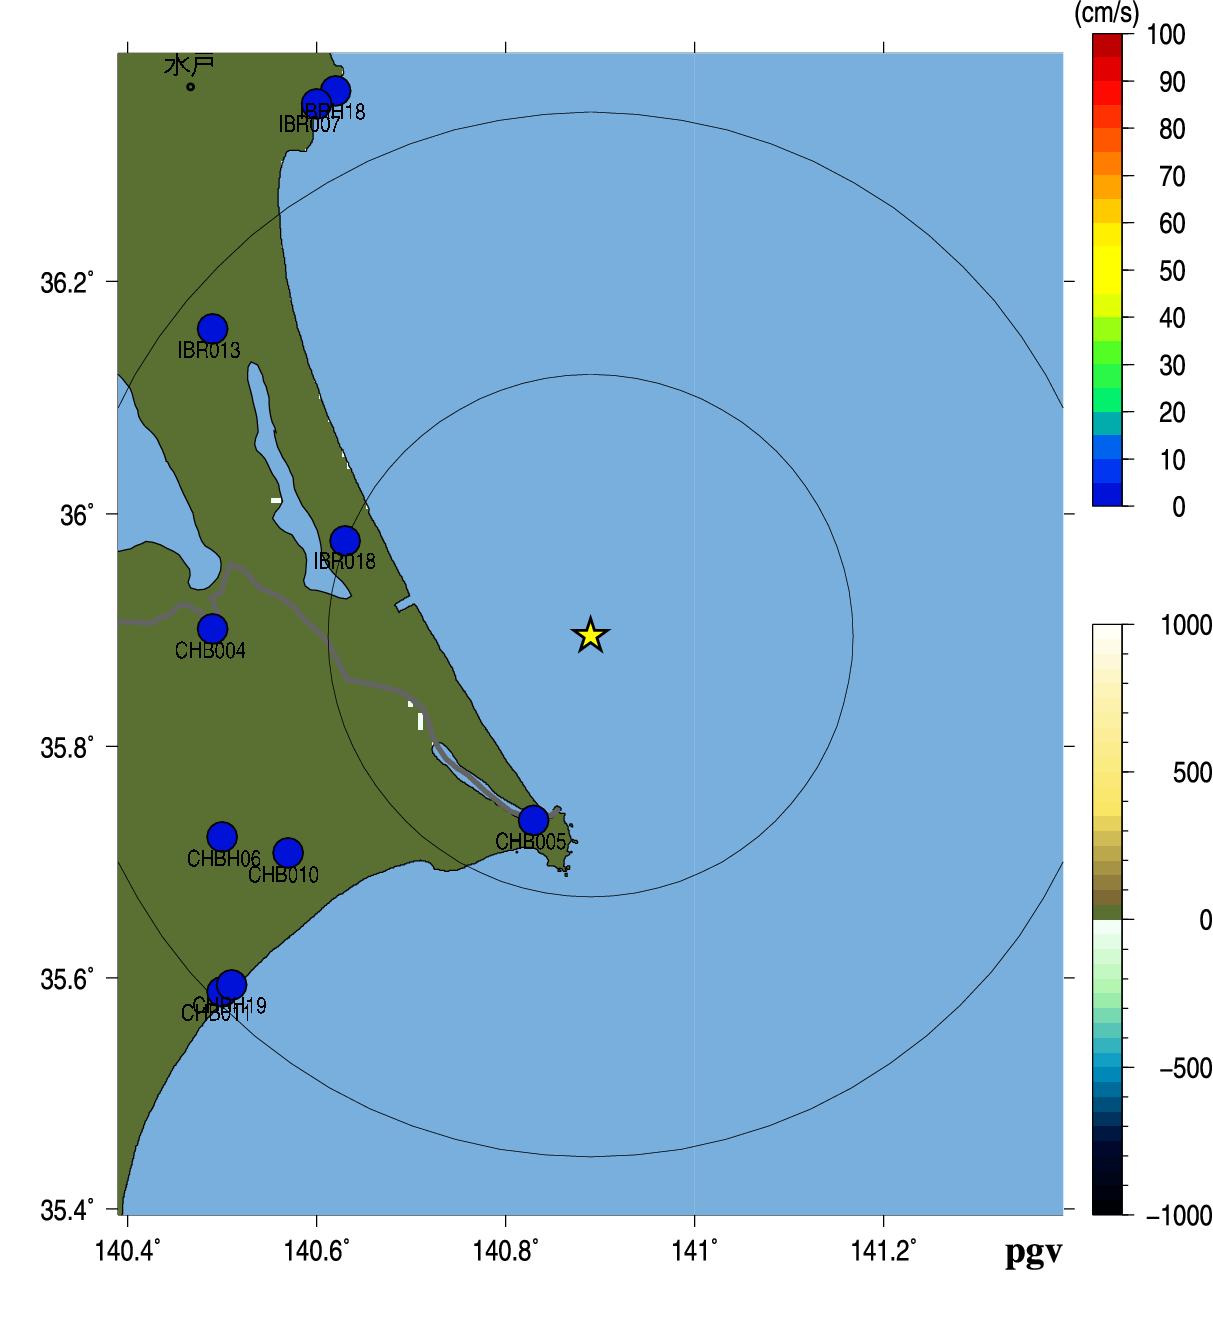
Fig.3. Peak Ground Acceleration (left) and Peak Ground Velocity (right).
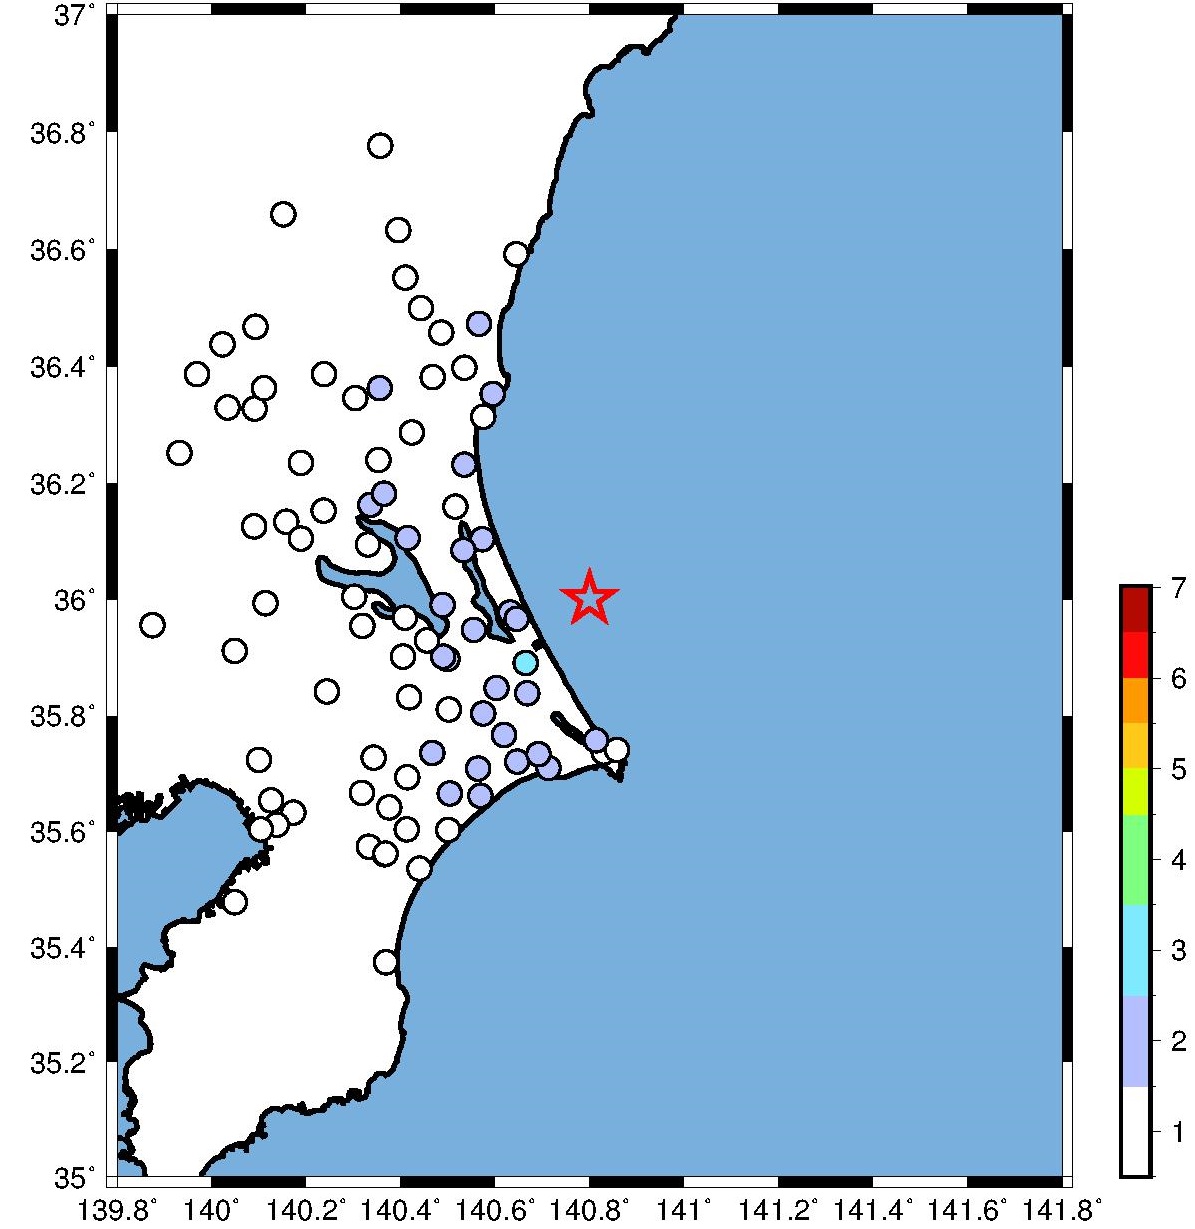
Fig.4. JMA seismic intensity.
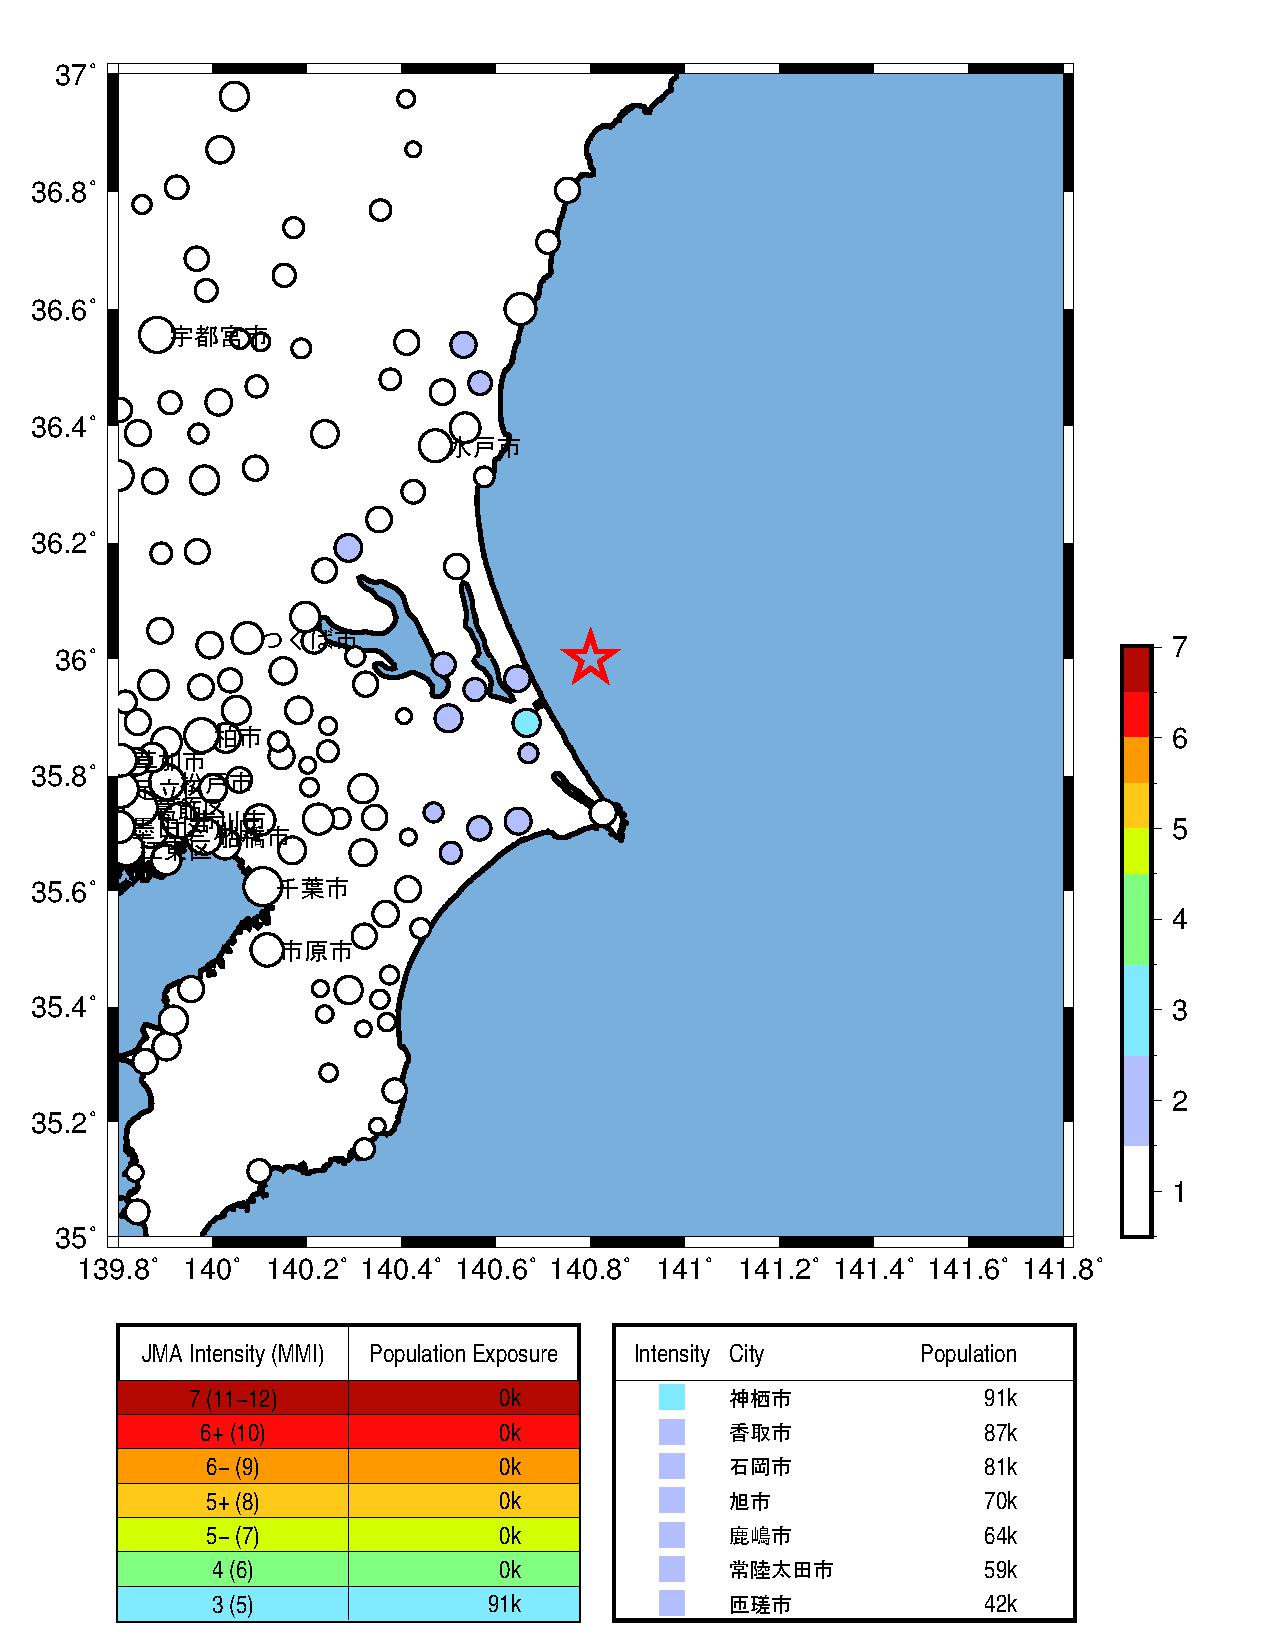
Fig.5. Population exposure. A circle size shows the population at the town, and a circle color shows the seismic intensity at the town.
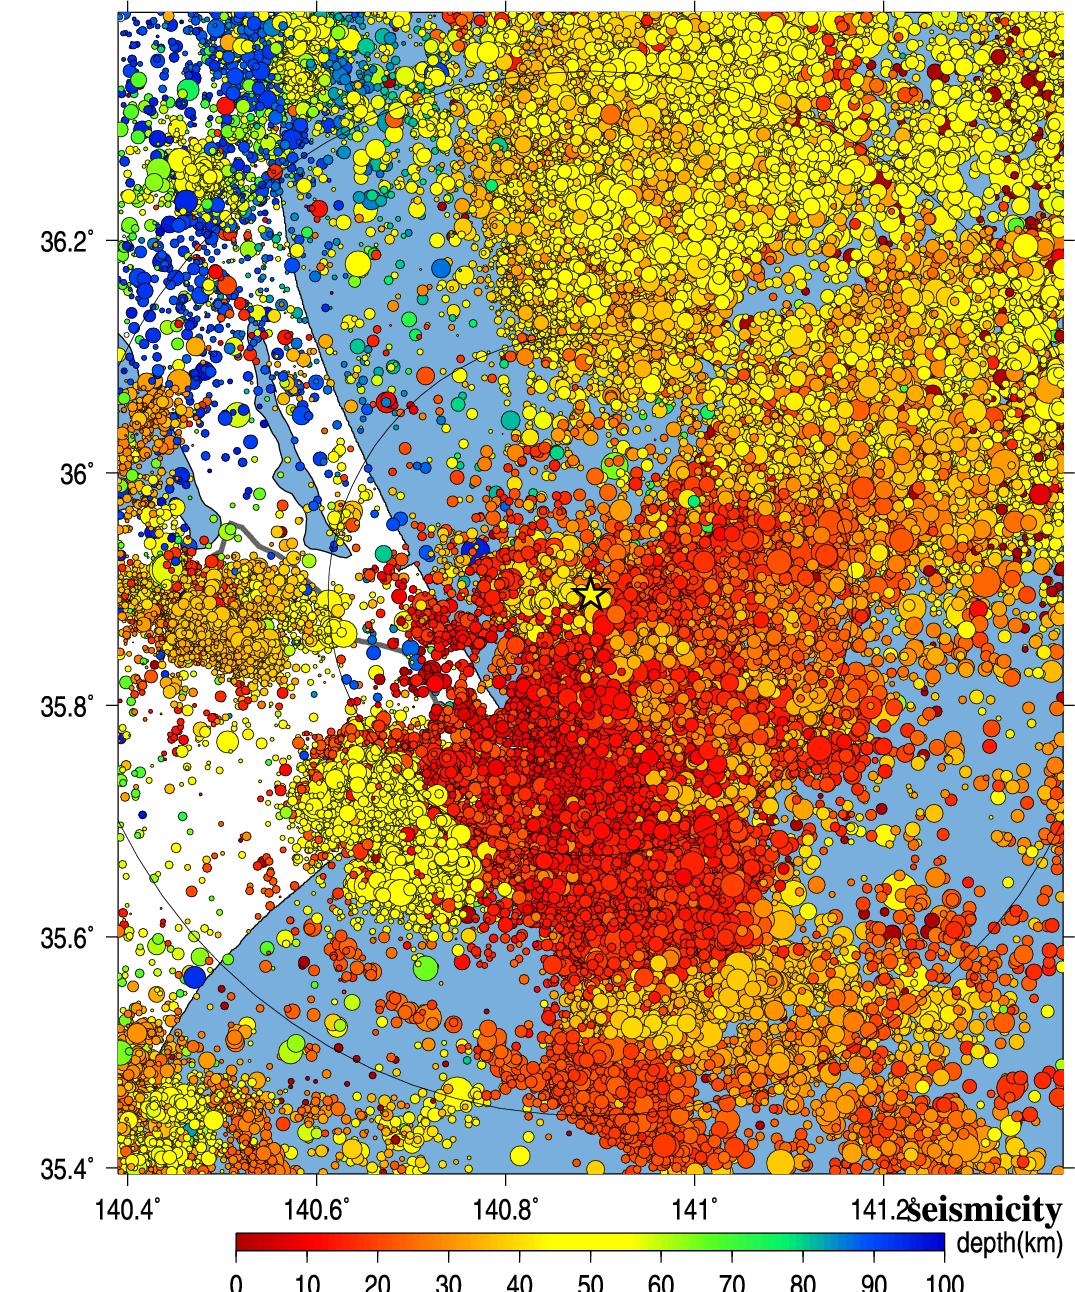
Fig.6. Seismic activity of past 40 years.
5.解析結果 (Analytical Result)
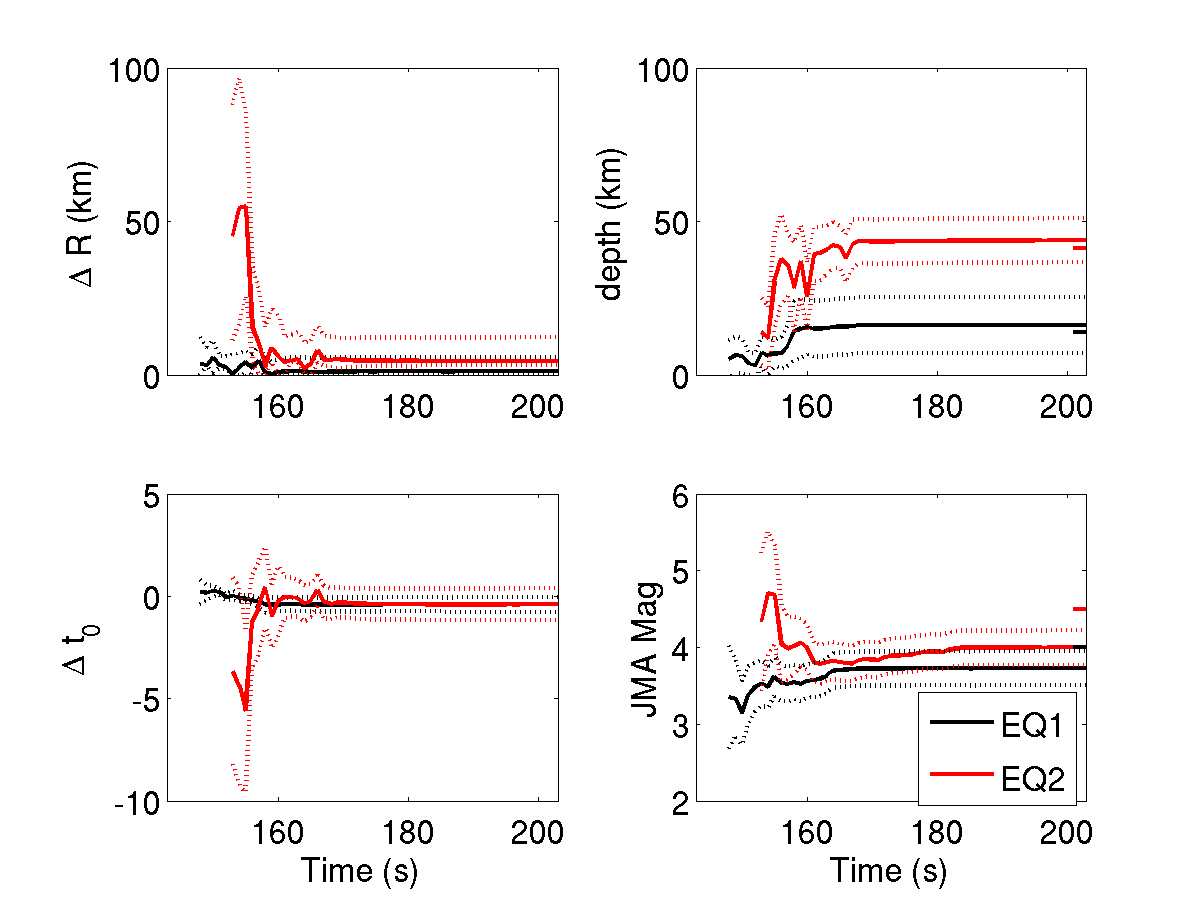
Fig.7. Time history of the estimates for source parameters by the IPF method (Wu et al., 2014). The error of epicenter, depth, error of origin time, JMA magnitude are shown. X-axis shows the time after the closest o'clocck sharp. EQ1 is the first earthquake in Toyama, and EQ2 is the second earthquake in Ibaraki.
Fig.8. Location estimates by IPF method (Wu et al., 2014). Black or colored triangles are stations used for the source estimation. The color scales with observed amplitude after the P-arrival. The skyblue star is the estimate at each second, and the blue star shows the catalog location.
Wu, Y. M. and H. Kanamori (2005). Experiment on an onsite early warning method for the Taiwan early warning system, Bull. Seism. Soc. Am., 95, 347-353.
Wu, S, Yamada, M., K. Tamaribuchi, and J. Beck (2014). Multi-events Earthquake Early Warning algorithm using a Bayesian approach. Geophysical Journal International.
気象庁の震度情報、防災科学技術研究所のK-NET,KiK-netの波形、気象庁の強震波形、関西地震観測研究協議会の強震波形、一元化震源カタログをを利用しました。
緊急地震速報を発表した地震の解析結果
山田真澄 ホーム