━━━━━━━━━━━━━━━━━━━━━━━━
2017年6月25日 長野県中部の地震
━━━━━━━━━━━━━━━━━━━━━━━━
1.地震について (Earthquake Information)
----------------------------------------------------
2016/10/21,14:07:22.572 35.3806 133.8545 11.6 6.6
----------------------------------------------------
Table1. Earthquake information. Origin time, Epicentral latitude, longitude, depth, and JMA magnitude from the left.(ref. Hi-net catalog)
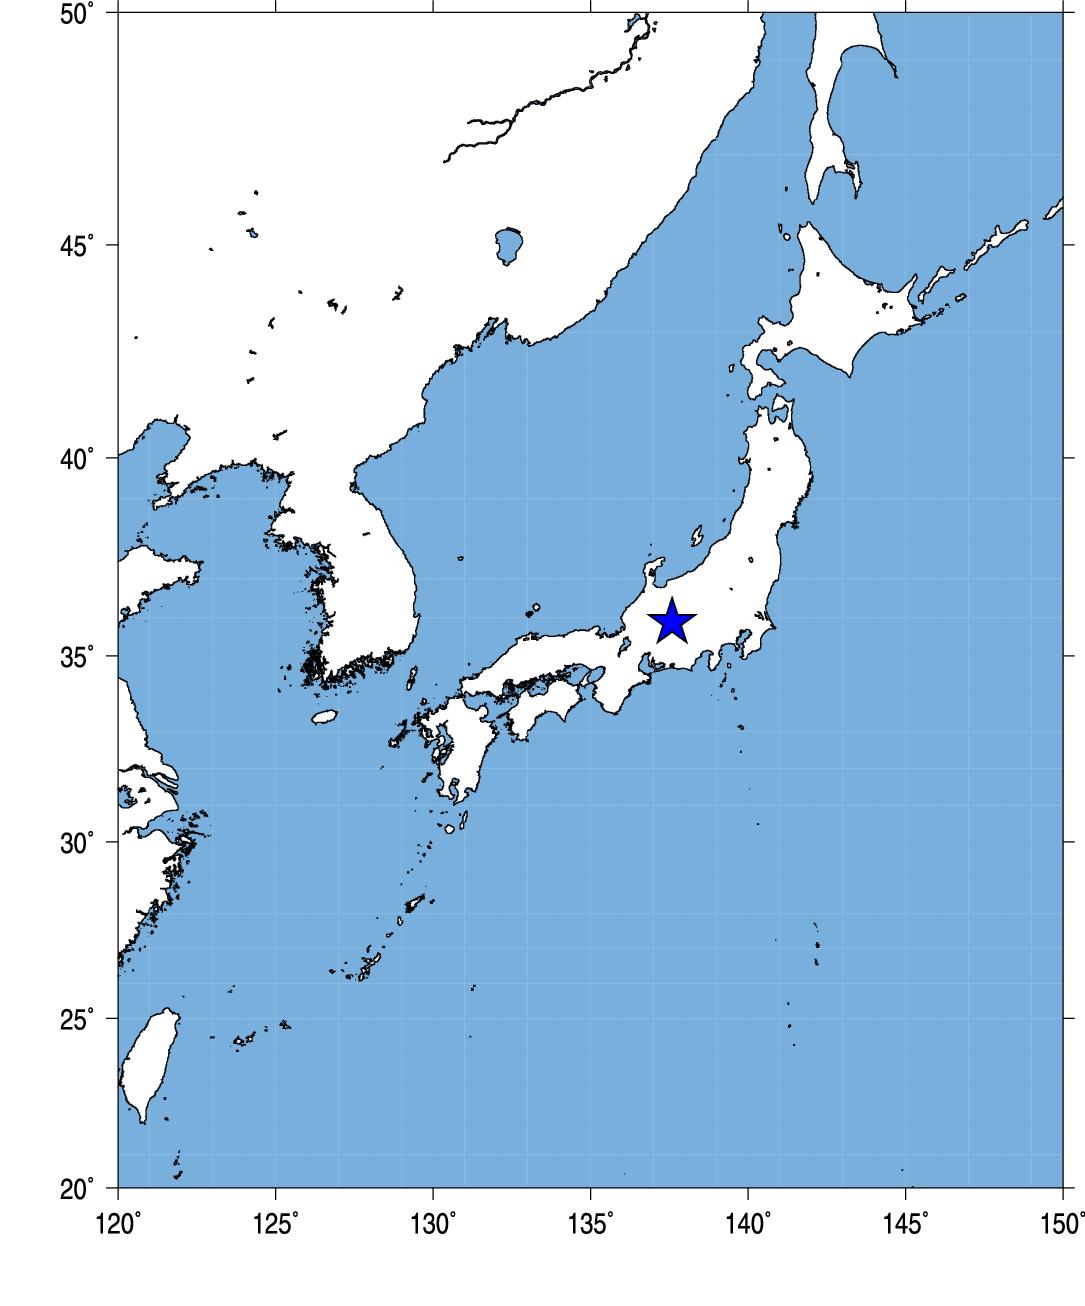
Fig.1. Event location.
2.観測点分布 (Station Distribution)
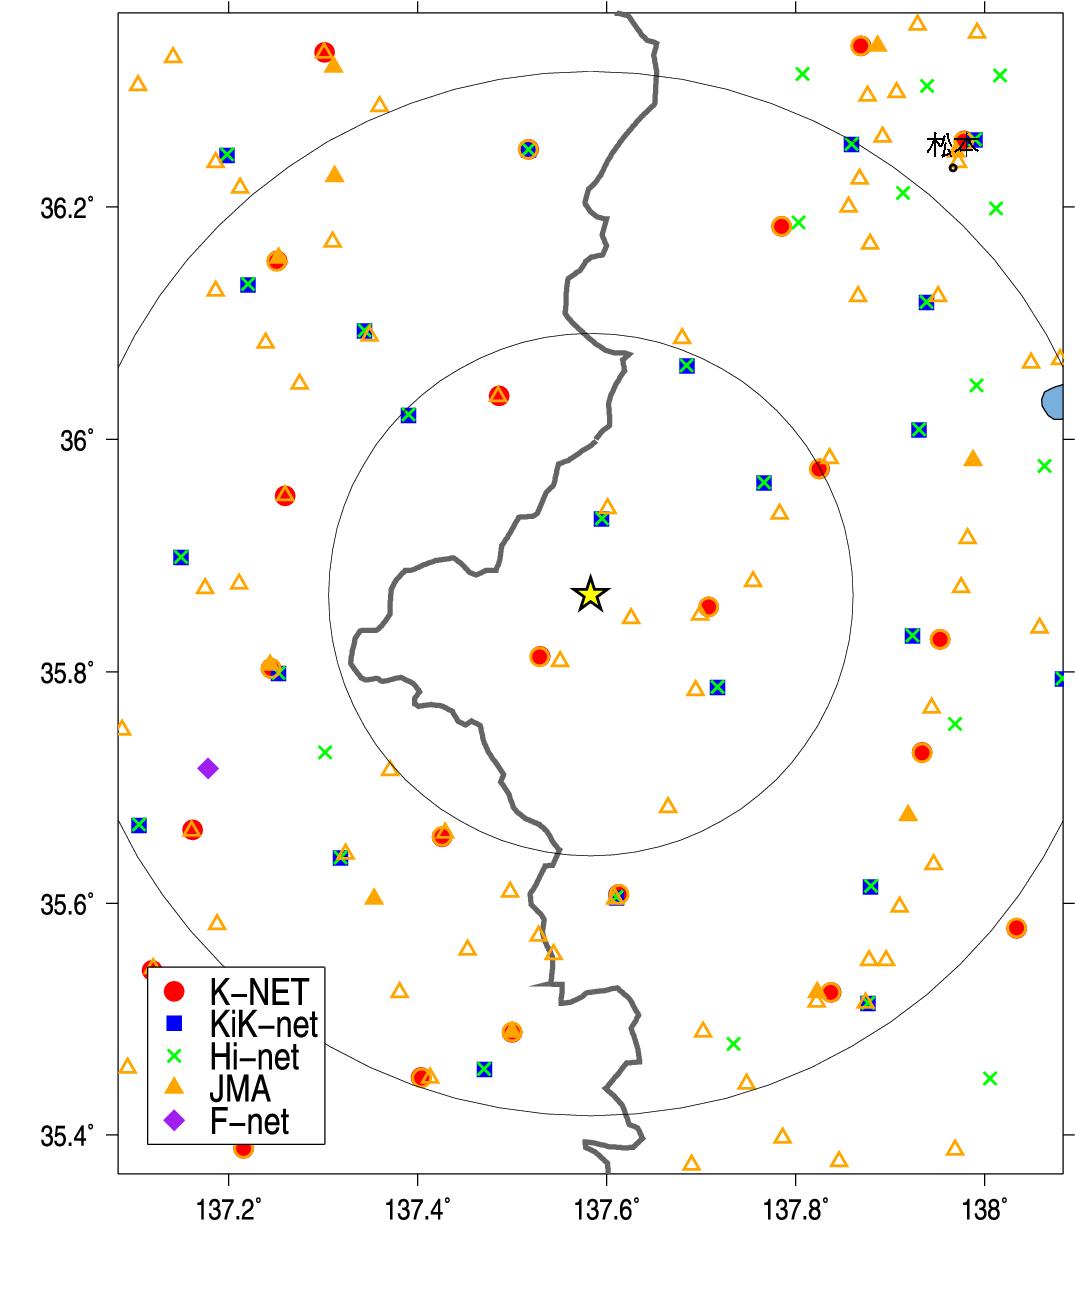
Fig.2. Station Distribution.
3.緊急地震速報発信状況 (Earthquake Early Warning Report)
-------------------------------------------------------------------[01] 17/06/25-07:02:15 03 M4.1 35.9N 137.6E 010km (17/06/25-07:02:23)
[03] 17/06/25-07:02:15 04 M5.0 35.9N 137.6E 010km (17/06/25-07:02:27)
[05] 17/06/25-07:02:15 5- M5.5 35.9N 137.6E 010km (17/06/25-07:02:31)
[06] 17/06/25-07:02:15 5- M5.4 35.9N 137.6E 010km (17/06/25-07:02:39)
[07] 17/06/25-07:02:15 5- M5.4 35.9N 137.6E 010km (17/06/25-07:02:51)
[08] 17/06/25-07:02:15 5- M5.4 35.9N 137.6E 010km (17/06/25-07:03:10)
---------------------------------------------------------------------
(左から順に情報番号,震源時,最大予測震度,マグニチュード, 震央緯度,震央経度,震源深さ,電文発表時刻) from CEORKA
-------------------------------------------------------------------
Table2. Earthquake early warning reports. Information ID, Origin time, Maximum Intensity, JMA magnitude, Epicentral latitude, longitude, depth, and time to issue the report from the left.(ref. The Committee of Earthquake Observation and Research in the Kansai Area)
--> 気象庁による緊急地震速報の内容
4.観測記録 (Observed Records)
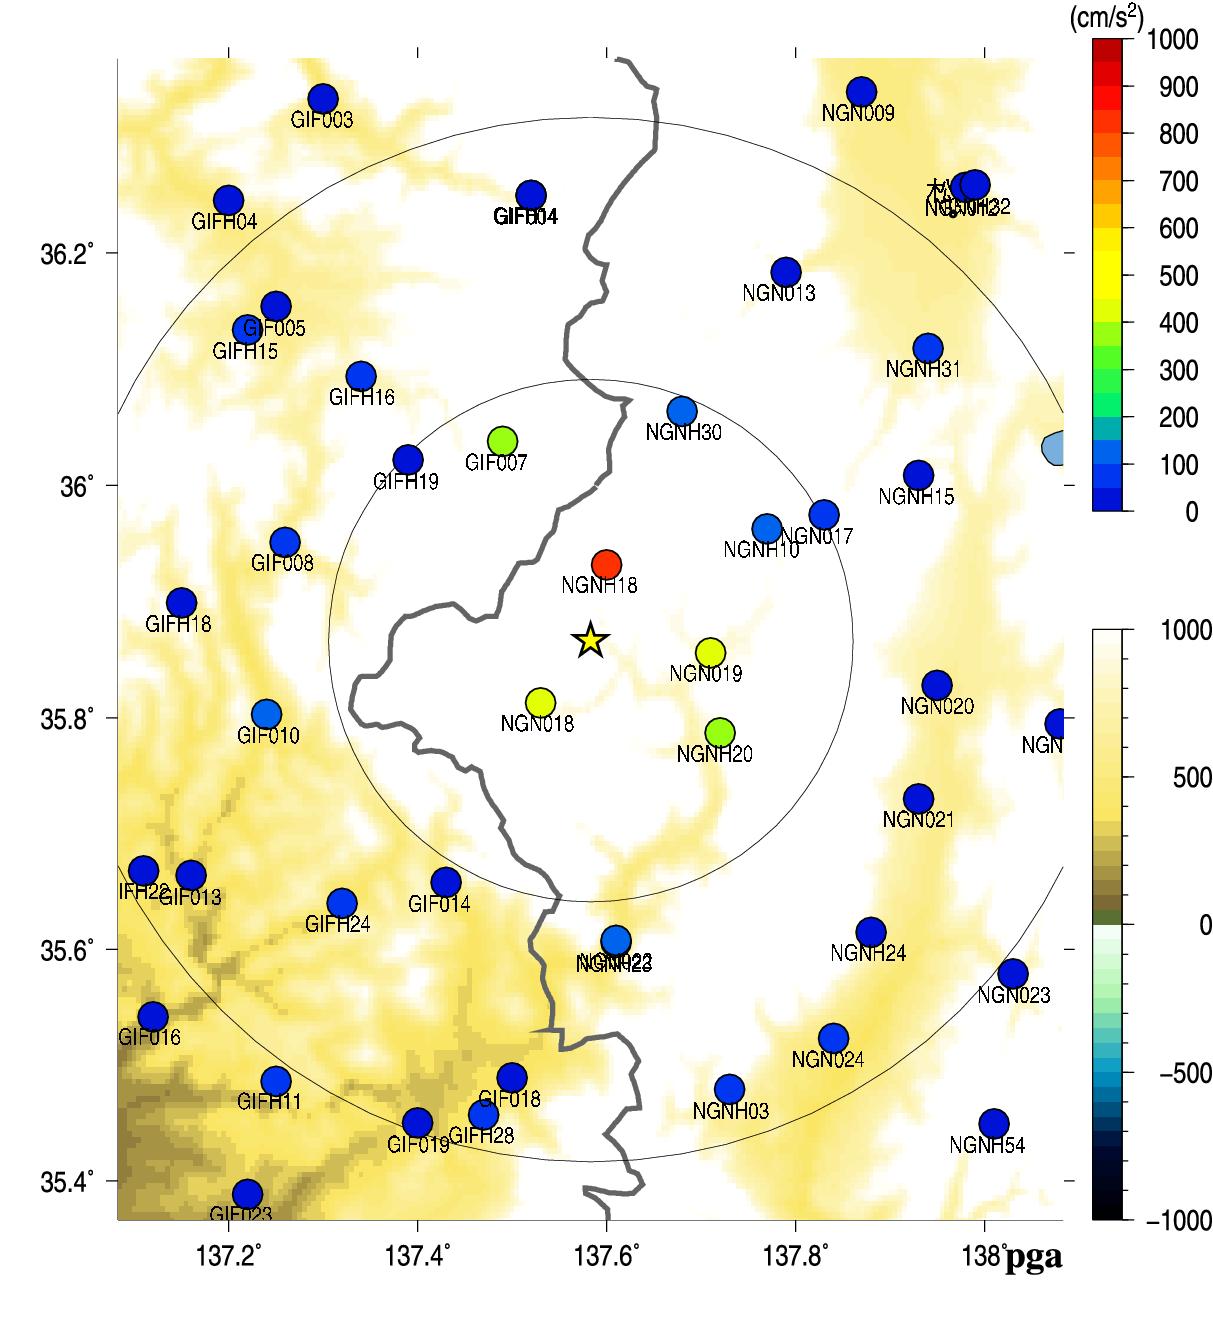
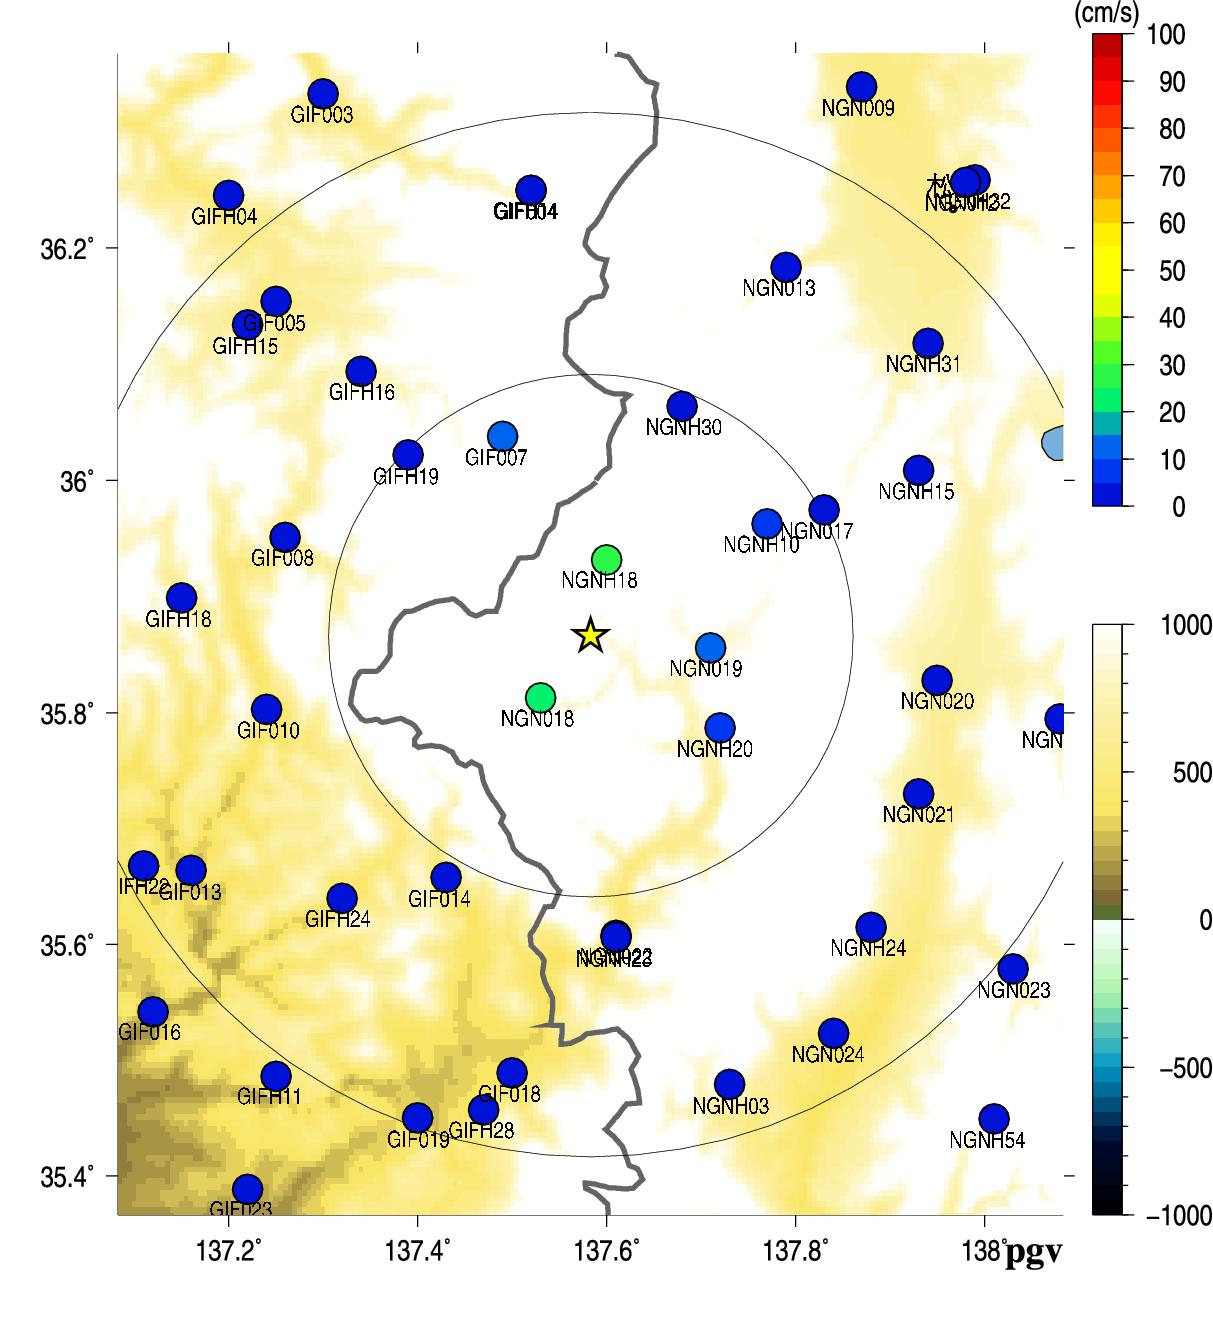
Fig.3. Peak Ground Acceleration (left) and Peak Ground Velocity (right).
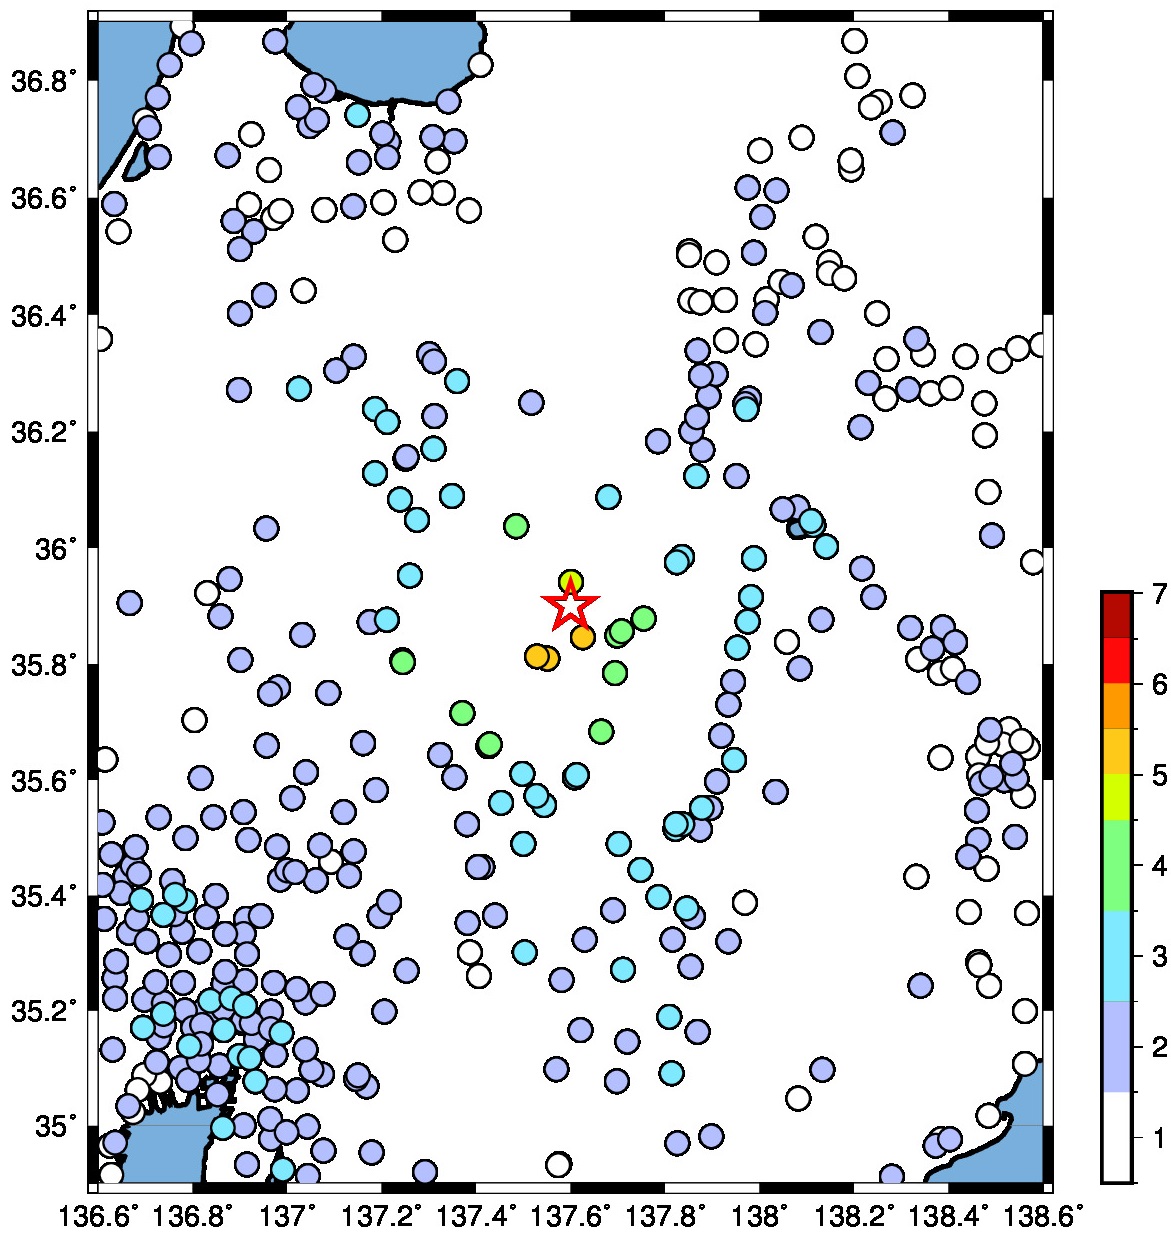
Fig.4. JMA seismic intensity.
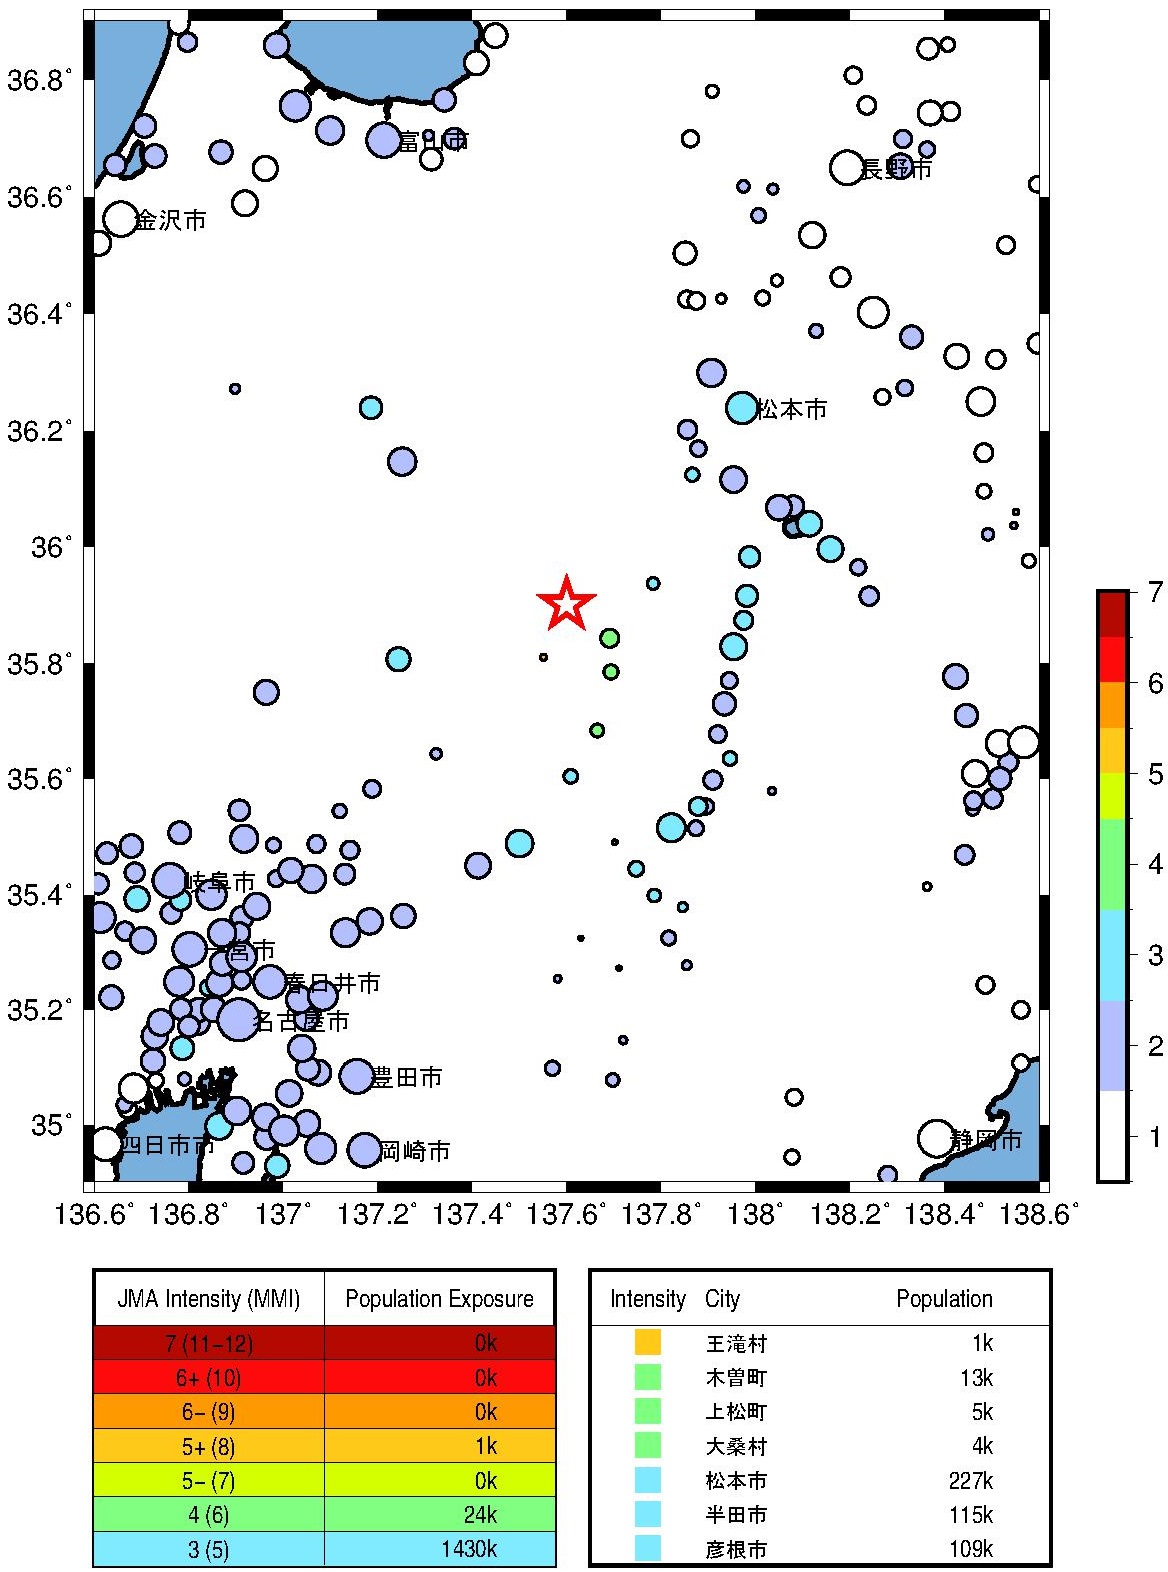
Fig.5. Population exposure. A circle size shows the population at the town, and a circle color shows the seismic intensity at the town.
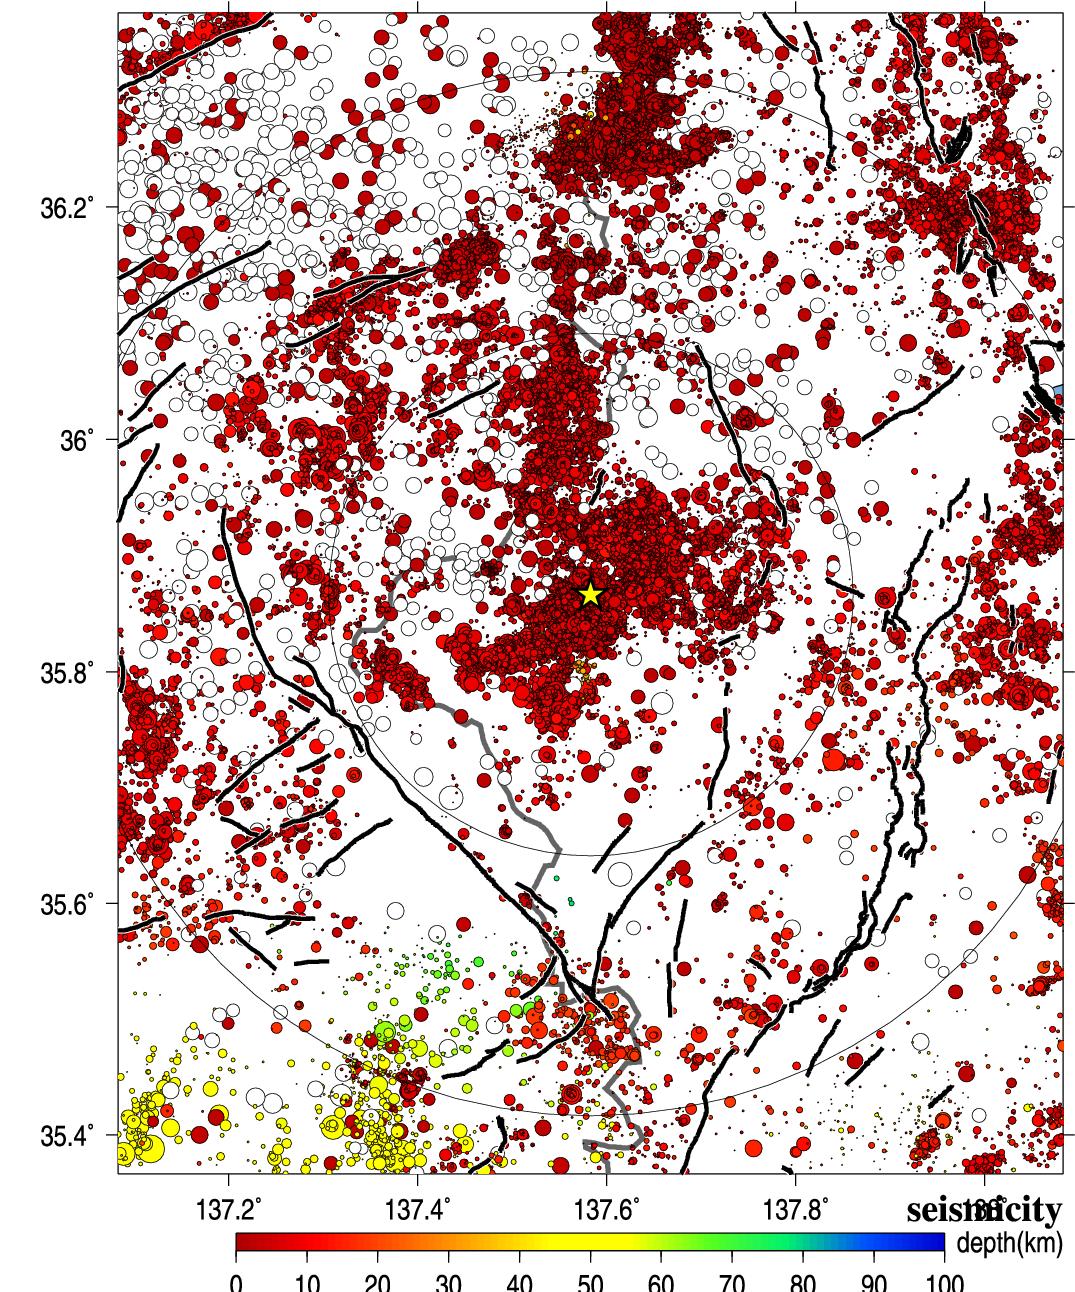
Fig.6. Seismic activity of past 40 years.
5.解析結果 (Analytical Result)
-------------------------------------------------------
NGNH181706250702 137.595 35.932 0.341 17.220 7.182 5.6 4.5
NGN0191706250702 137.708 35.856 0.790 17.600 10.988 5.6 5.3
NGN0181706250702 137.529 35.813 0.518 17.210 7.998 5.6 4.9
NGNH201706250702 137.717 35.787 0.976 18.230 14.812 5.6 5.5
GIF0071706250702 137.486 36.038 0.455 19.250 20.925 5.6 4.8
NGNH101706250702 137.767 35.963 0.704 19.160 19.371 5.6 5.2
NGN0171706250702 137.826 35.975 0.760 19.990 24.571 5.6 5.2
NGNH301706250702 137.685 36.064 0.648 19.780 23.472 5.6 5.1
GIFH191706250702 137.391 36.022 1.640 19.890 24.587 5.6 5.9
NGNH231706250702 137.611 35.606 0.370 20.610 29.192 5.6 4.6
Observed/Estimated Mw(median) tauc 5.6 5.15 0.7
-------------------------------------------------------
Table3. Analytical results using Tau_c method (Wu and Kanamori, 2005). Station ID, Station longitude, latitude, tauc, P-arrival time, epicentral distance(km) , magnitude, and estimated magnitude from the left.
Wu, Y. M. and H. Kanamori (2005). Experiment on an onsite early warning method for the Taiwan early warning system, Bull. Seism. Soc. Am., 95, 347-353.
Wu, S, Yamada, M., K. Tamaribuchi, and J. Beck (2014). Multi-events Earthquake Early Warning algorithm using a Bayesian approach. Geophysical Journal International.
気象庁の震度情報、防災科学技術研究所のK-NET,KiK-netの波形、気象庁の強震波形、関西地震観測研究協議会の強震波形、一元化震源カタログをを利用しました。
緊急地震速報を発表した地震の解析結果
山田真澄 ホーム