━━━━━━━━━━━━━━━━━━━━━━━━
2016年4月16日 熊本県の地震
━━━━━━━━━━━━━━━━━━━━━━━━
1.地震について (Earthquake Information)
----------------------------------------------------
2016/04/16,01:25:05.496 32.7539 130.7648 13.1 7.3
----------------------------------------------------
Table1. Earthquake information. Origin time, Epicentral latitude, longitude, depth, and JMA magnitude from the left.(ref. Hi-net catalog)
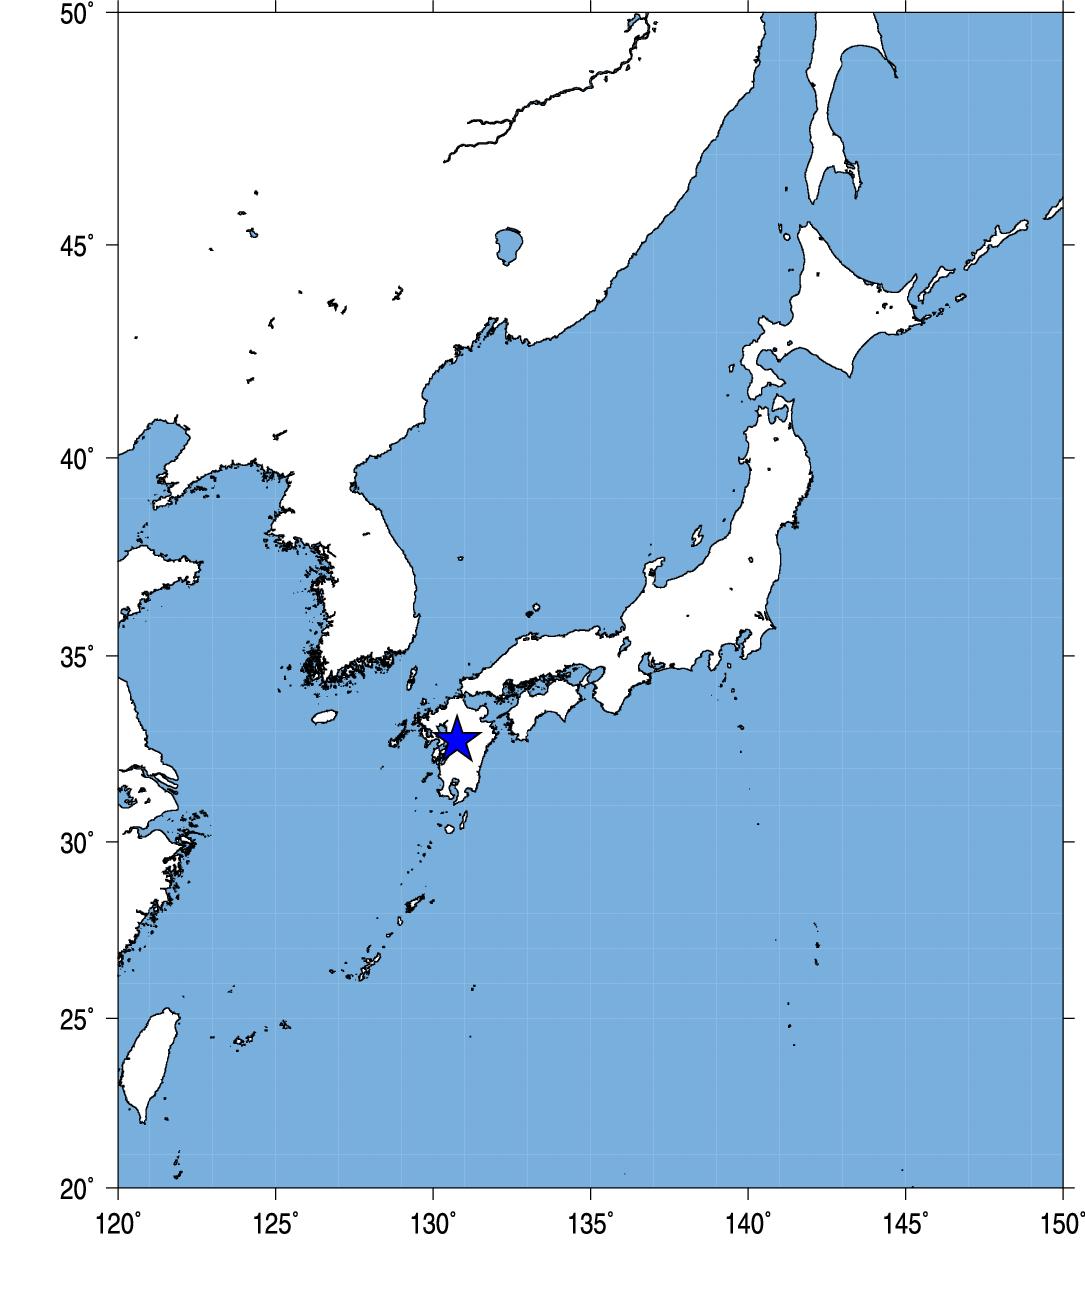
Fig.1. Event location.
2.観測点分布 (Station Distribution)
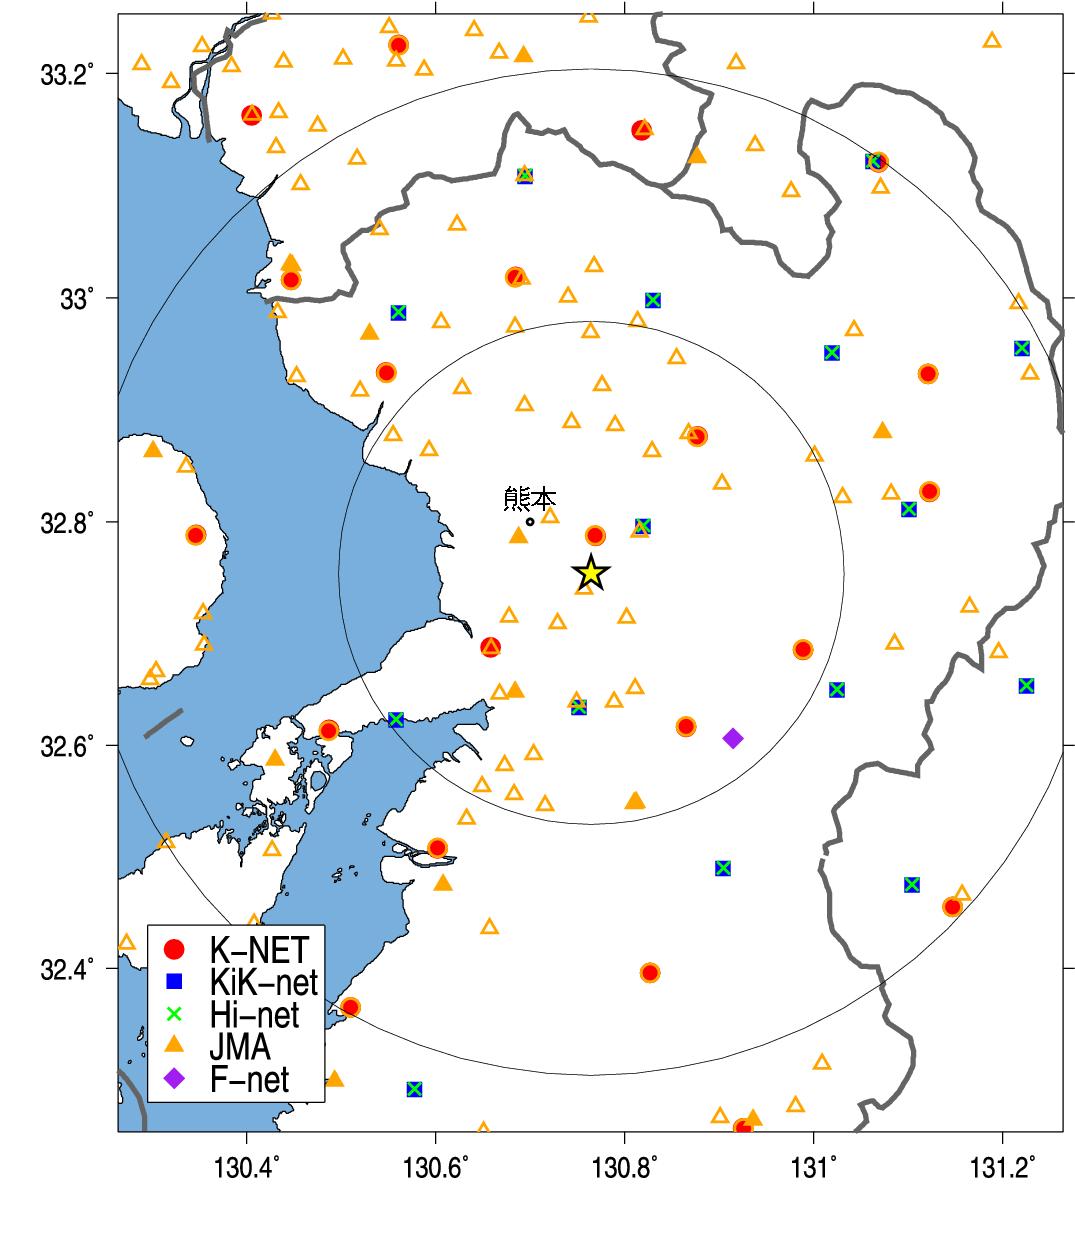
Fig.2. Station Distribution.
3.緊急地震速報発信状況 (Earthquake Early Warning Report)
-------------------------------------------------------------------[01] 16/04/16-01:25:07 5+ M5.9 32.7N 130.8E 010km (16/04/16-01:25:13)
[08] 16/04/16-01:25:05 07 M7.1 32.8N 130.8E 010km (16/04/16-01:25:31)
[09] 16/04/16-01:25:05 07 M7.1 32.8N 130.8E 010km (16/04/16-01:25:40)
[10] 16/04/16-01:25:05 07 M7.1 32.8N 130.8E 010km (16/04/16-01:26:00)
[11] 16/04/16-01:25:05 07 M7.1 32.8N 130.8E 010km (16/04/16-01:26:20)
[12] 16/04/16-01:25:05 07 M7.1 32.8N 130.8E 010km (16/04/16-01:26:25)
---------------------------------------------------------------------
(左から順に情報番号,震源時,最大予測震度,マグニチュード, 震央緯度,震央経度,震源深さ,電文発表時刻) from CEORKA
-------------------------------------------------------------------
Table2. Earthquake early warning reports. Information ID, Origin time, Maximum Intensity, JMA magnitude, Epicentral latitude, longitude, depth, and time to issue the report from the left.(ref. The Committee of Earthquake Observation and Research in the Kansai Area)
--> 気象庁による緊急地震速報の内容
4.観測記録 (Observed Records)
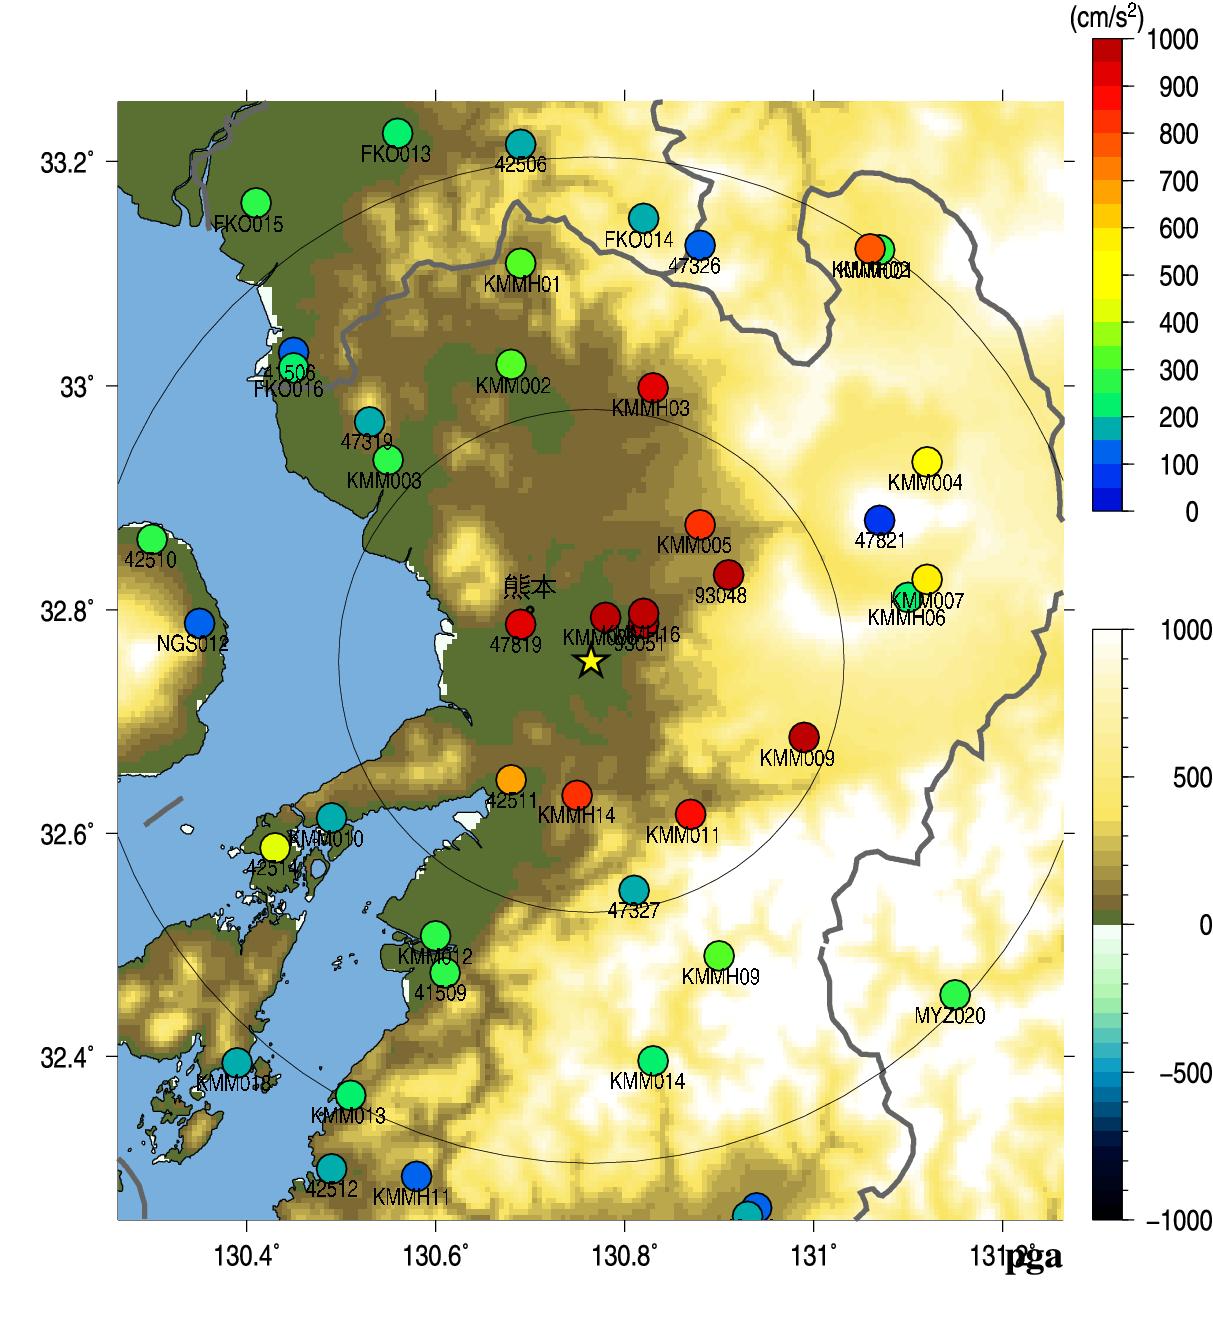
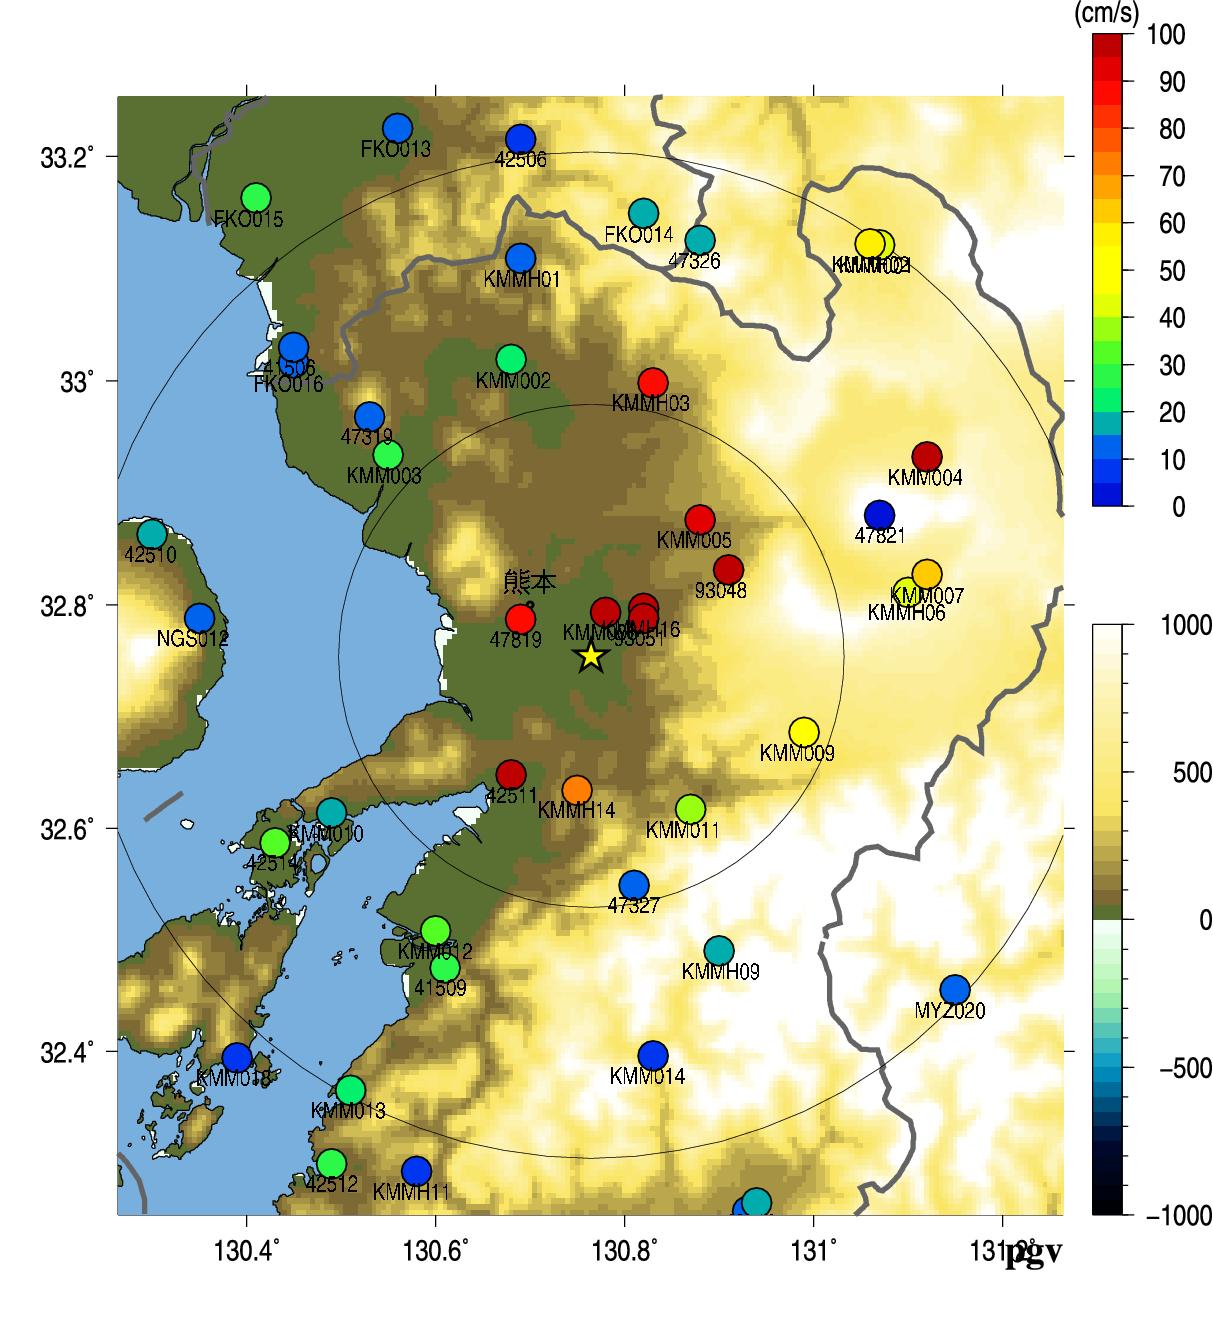
Fig.3. Peak Ground Acceleration (left) and Peak Ground Velocity (right).
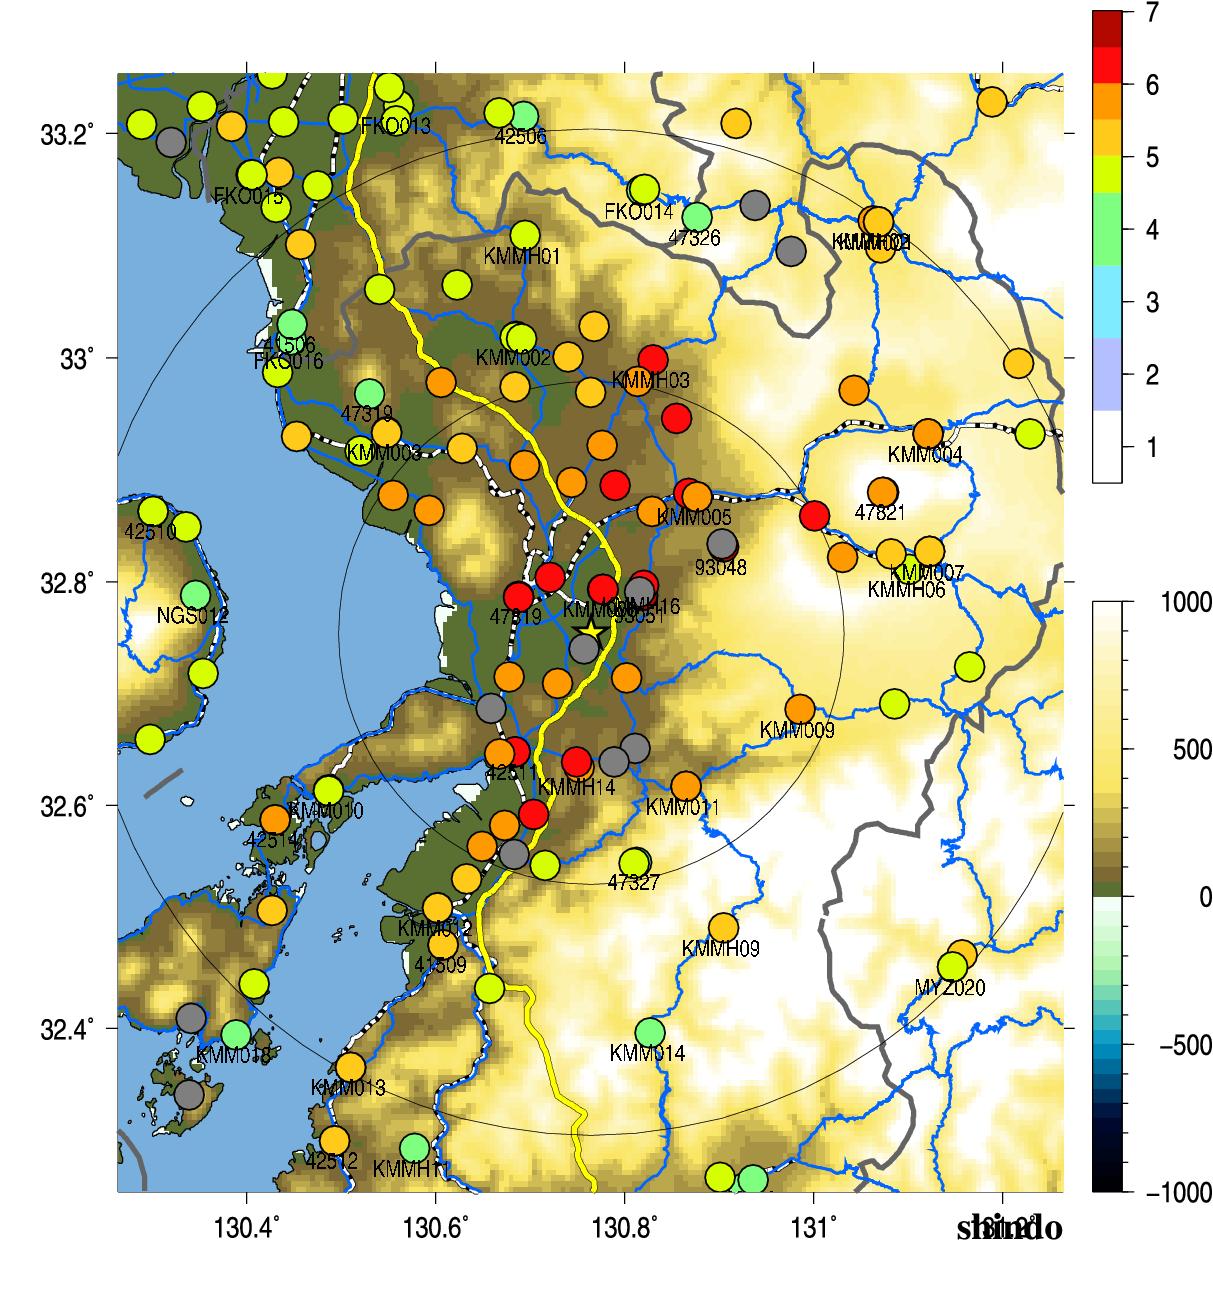
Fig.4. JMA seismic intensity.
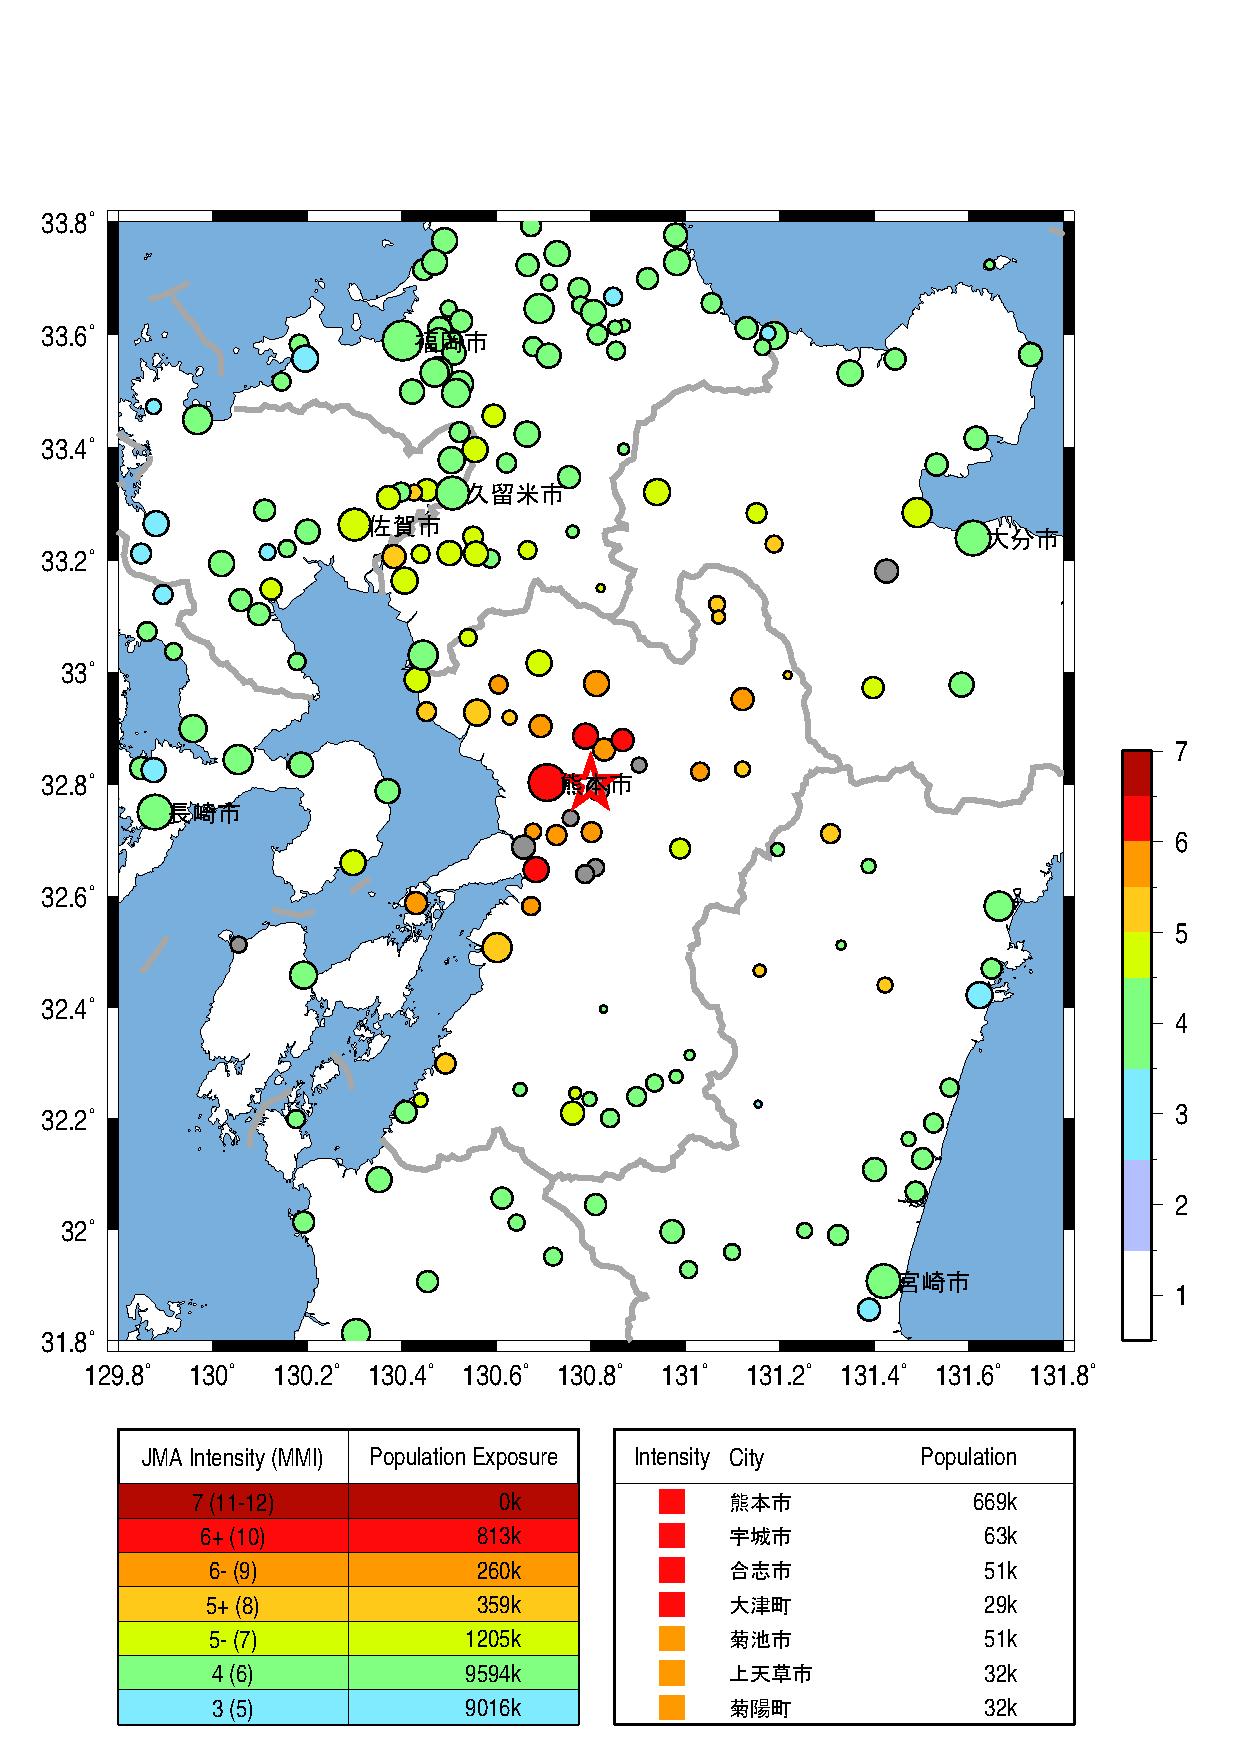
Fig.5. Population exposure. A circle size shows the population at the town, and a circle color shows the seismic intensity at the town.
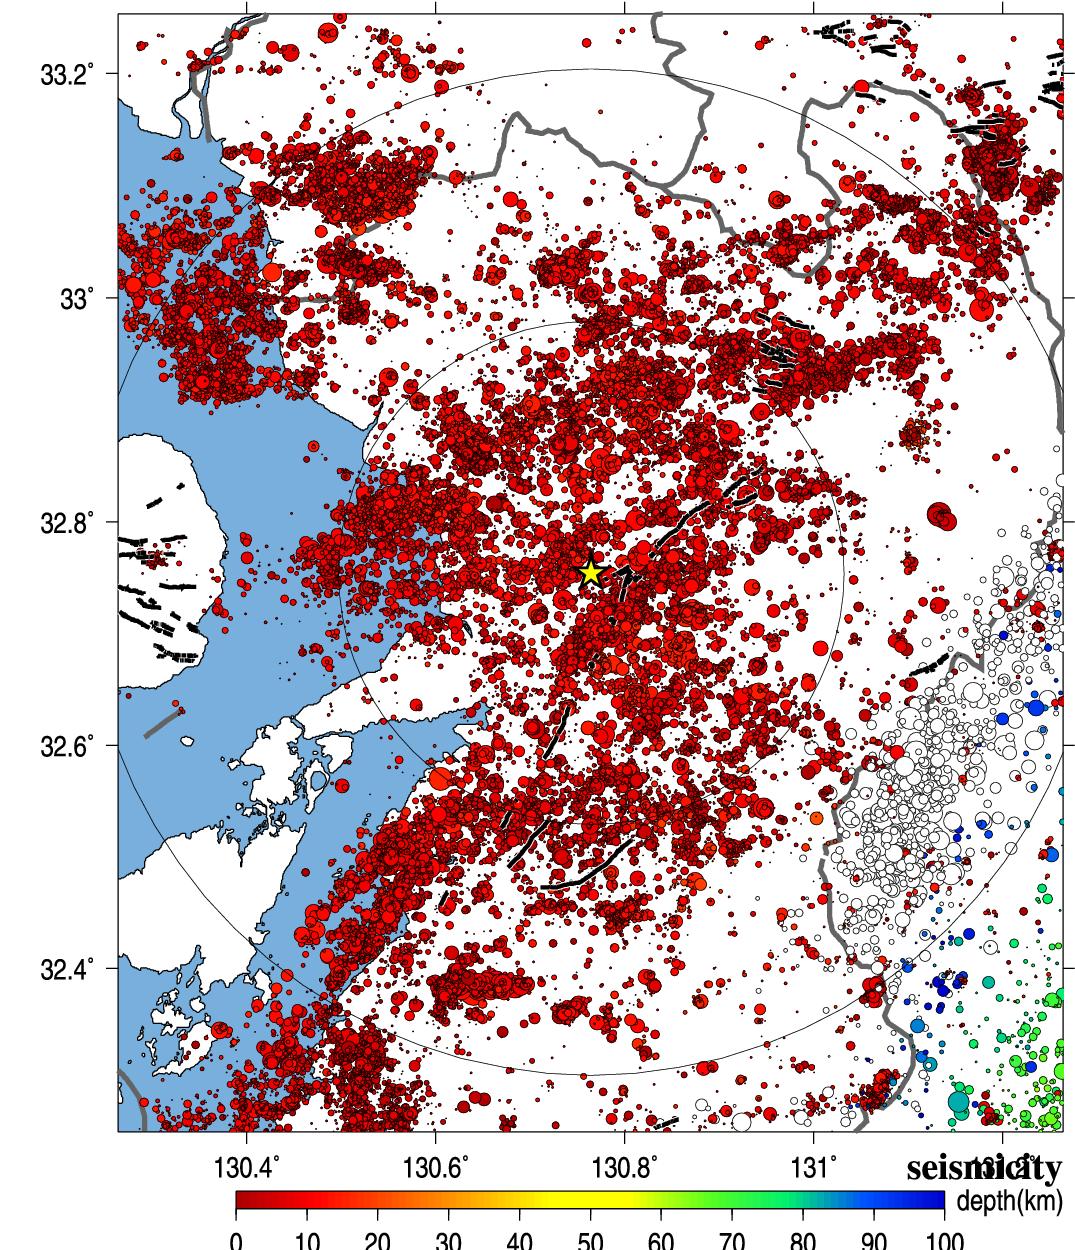
Fig.6. Seismic activity of past 40 years.
5.解析結果 (Analytical Result)
-------------------------------------------------------
KMM0061604160125 130.777 32.793 1.672 7.760 2.257 7.1 6.0
KMMH161604160125 130.820 32.797 1.167 2.594 7.013 7.3 5.6
KMM0051604160125 130.877 32.876 1.278 9.240 11.123 7.1 5.7
KMMH141604160125 130.752 32.634 0.306 -46.196 13.295 7.3 4.4
KMM0111604160125 130.865 32.617 2.214 9.340 21.227 7.1 6.2
KMM0091604160125 130.986 32.686 1.039 9.790 21.517 7.1 5.5
KMM0021604160125 130.685 33.019 3.368 11.300 26.529 7.1 6.6
KMMH031604160125 130.830 32.998 1.520 5.464 27.796 7.3 5.9
KMM0031604160125 130.548 32.934 2.577 10.830 27.878 7.1 6.3
KMM0071604160125 131.123 32.827 2.427 11.790 30.356 7.1 6.3
Observed/Estimated Mw(median) tauc 7.1 5.95 1.6
-------------------------------------------------------
Table3. Analytical results using Tau_c method (Wu and Kanamori, 2005). Station ID, Station longitude, latitude, tauc, P-arrival time, epicentral distance(km) , magnitude, and estimated magnitude from the left.
Wu, Y. M. and H. Kanamori (2005). Experiment on an onsite early warning method for the Taiwan early warning system, Bull. Seism. Soc. Am., 95, 347-353.
Wu, S, Yamada, M., K. Tamaribuchi, and J. Beck (2014). Multi-events Earthquake Early Warning algorithm using a Bayesian approach. Geophysical Journal International.
気象庁の震度情報、防災科学技術研究所のK-NET,KiK-netの波形、気象庁の強震波形、関西地震観測研究協議会の強震波形、一元化震源カタログをを利用しました。
緊急地震速報を発表した地震の解析結果
山田真澄 ホーム