━━━━━━━━━━━━━━━━━━━━━━━━
2016年4月1日 三重県沖の地震
━━━━━━━━━━━━━━━━━━━━━━━━
1.地震について (Earthquake Information)
----------------------------------------------------
2016/04/01,11:39:07.85 33.323 136.383 28.7 6.5
----------------------------------------------------
Table1. Earthquake information. Origin time, Epicentral latitude, longitude, depth, and JMA magnitude from the left.(ref. Hi-net catalog)
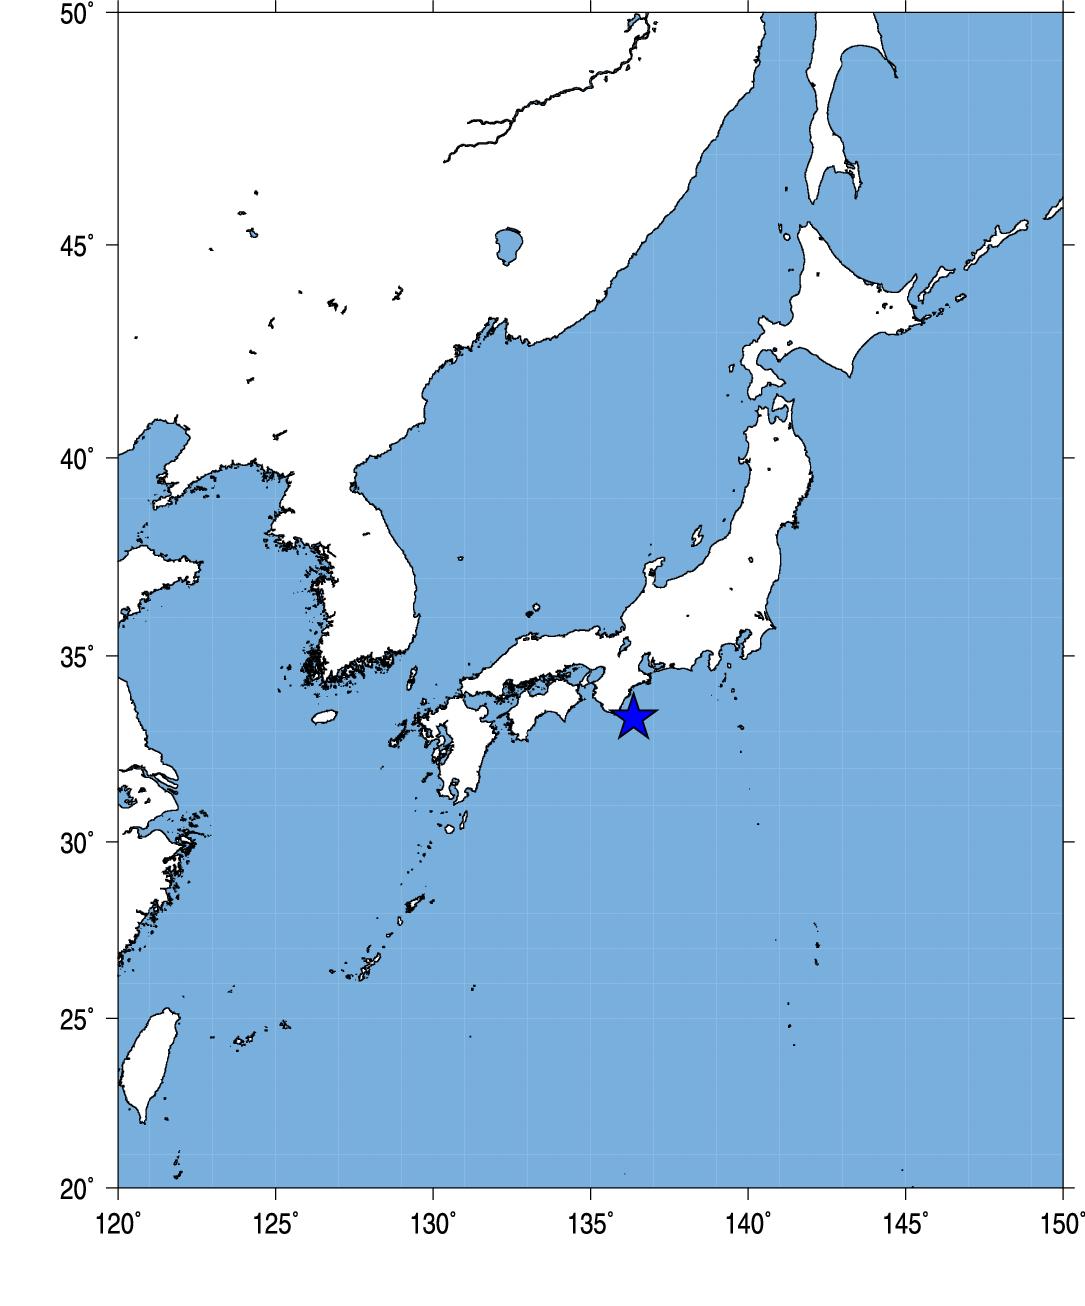
Fig.1. Event location.
2.観測点分布 (Station Distribution)
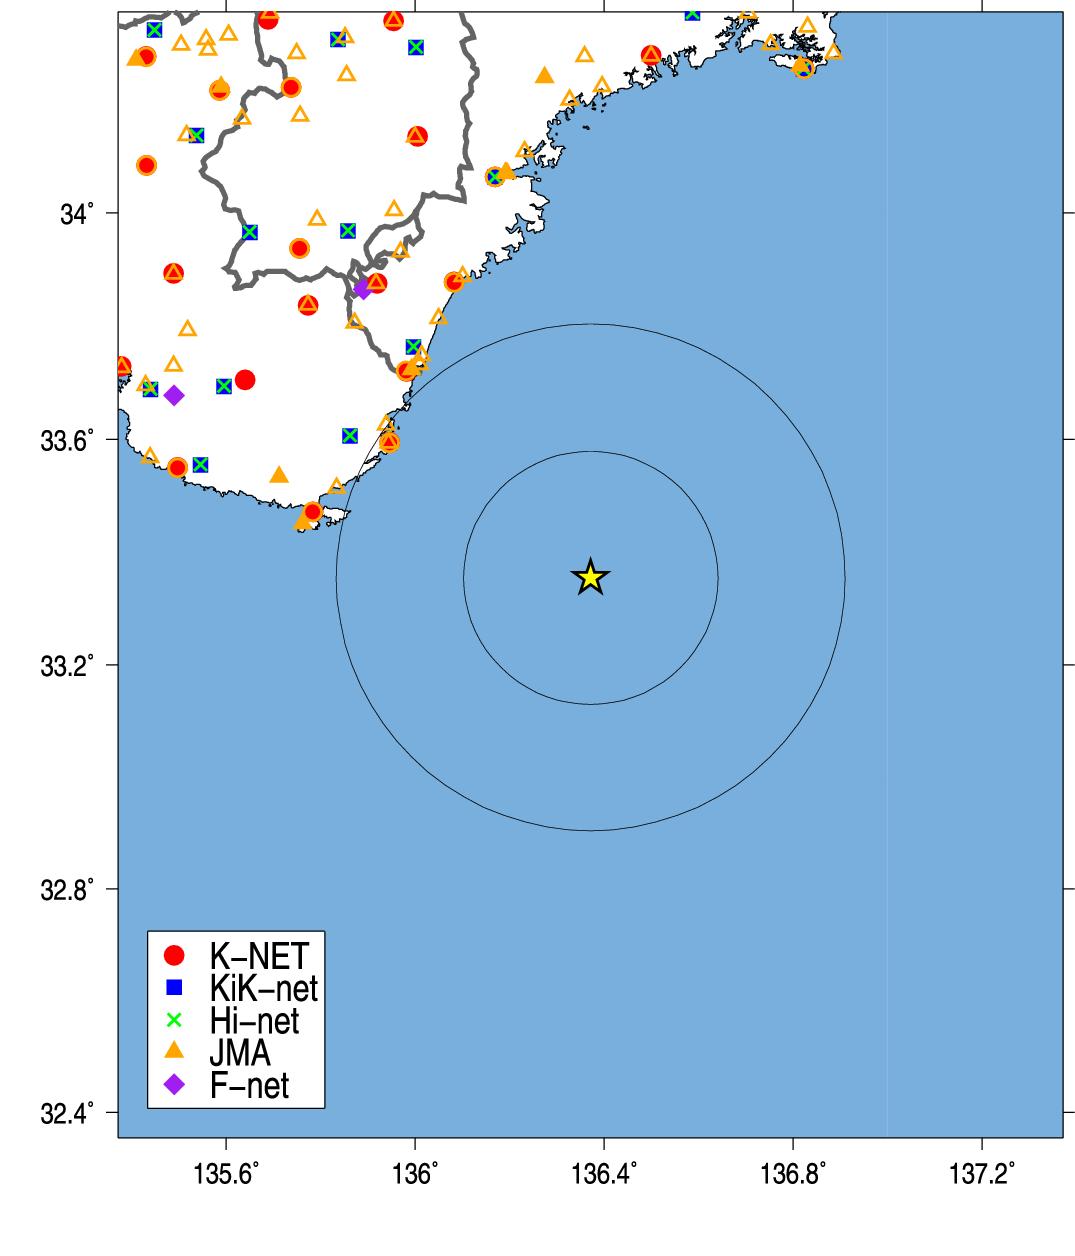
Fig.2. Station Distribution.
3.緊急地震速報発信状況 (Earthquake Early Warning Report)
-------------------------------------------------------------------[01] 16/04/01-11:39:08 04 M5.8 33.3N 136.4E 010km (16/04/01-11:39:21)
[09] 16/04/01-11:39:06 04 M6.5 33.3N 136.5E 010km (16/04/01-11:39:47)
[11] 16/04/01-11:39:06 04 M6.6 33.3N 136.5E 010km (16/04/01-11:40:19)
---------------------------------------------------------------------
(左から順に情報番号,震源時,最大予測震度,マグニチュード, 震央緯度,震央経度,震源深さ,電文発表時刻) from CEORKA
-------------------------------------------------------------------
Table2. Earthquake early warning reports. Information ID, Origin time, Maximum Intensity, JMA magnitude, Epicentral latitude, longitude, depth, and time to issue the report from the left.(ref. The Committee of Earthquake Observation and Research in the Kansai Area)
--> 気象庁による緊急地震速報の内容
4.観測記録 (Observed Records)
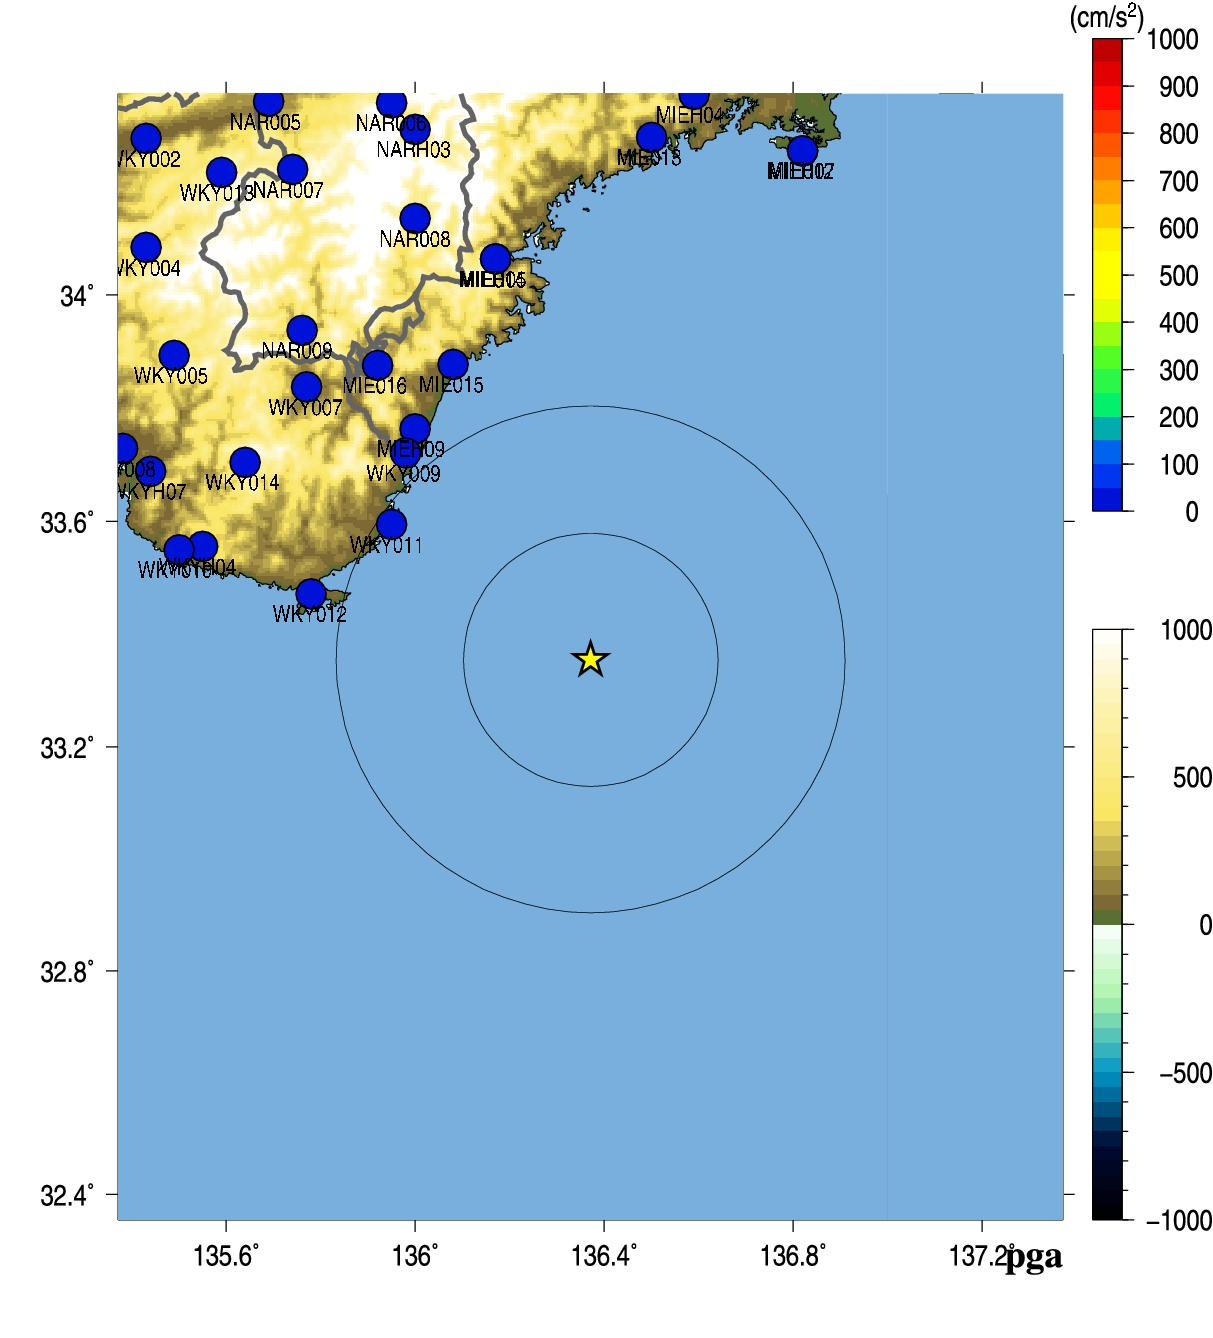
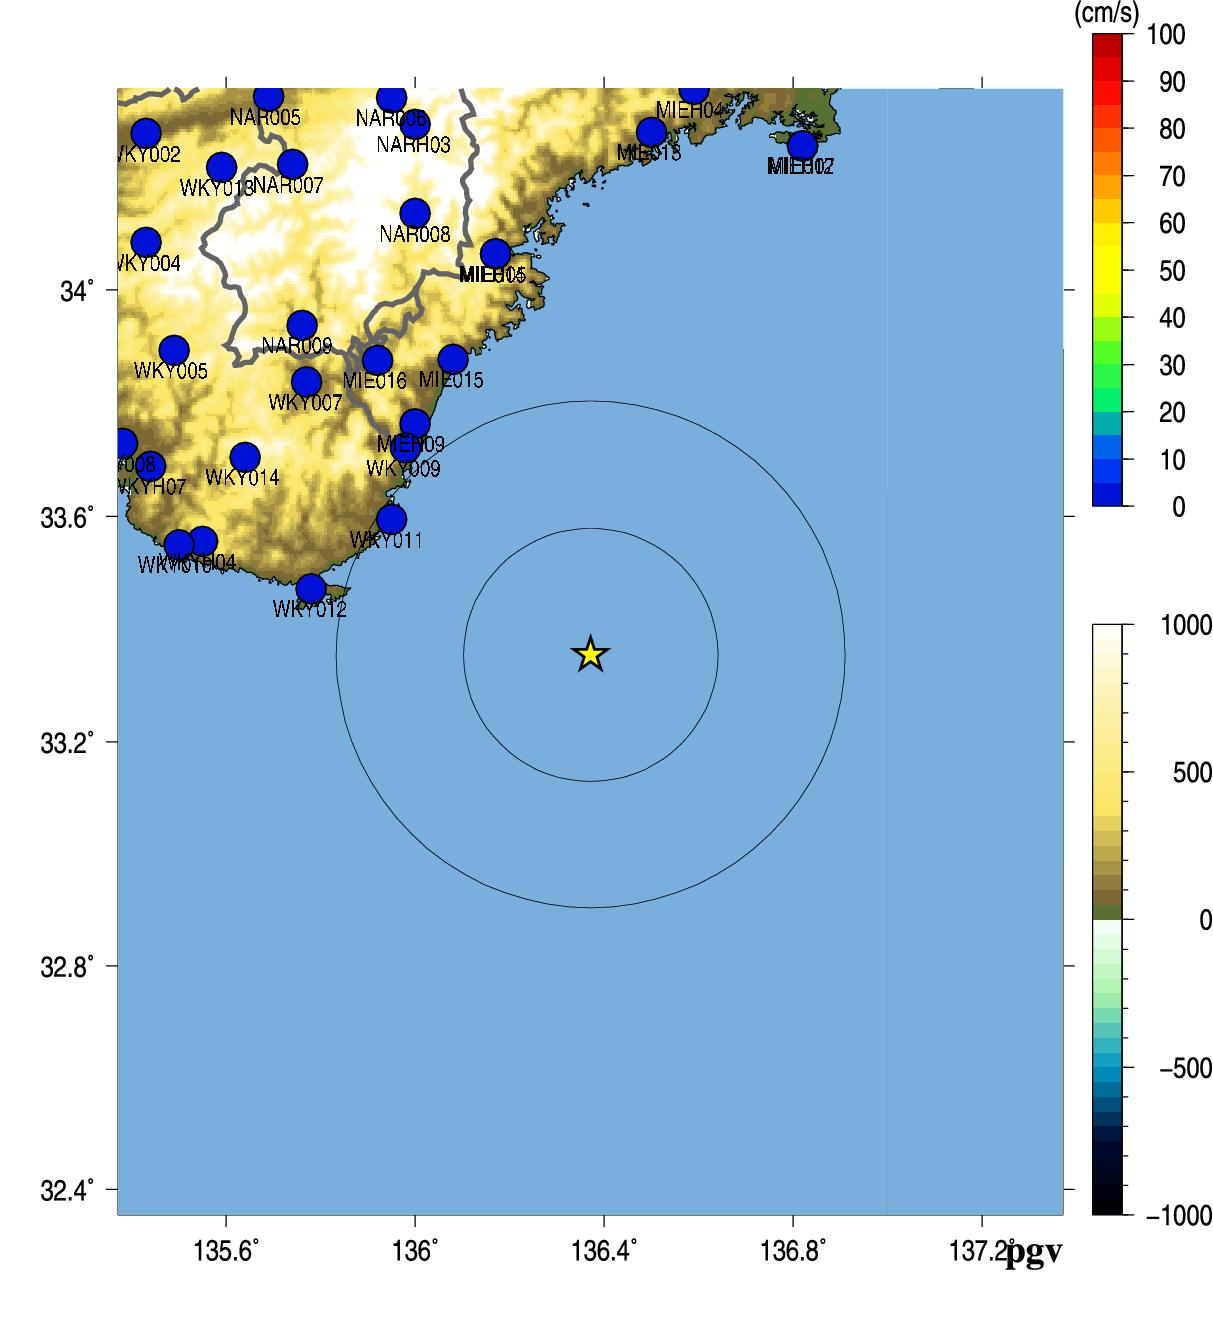
Fig.3. Peak Ground Acceleration (left) and Peak Ground Velocity (right).
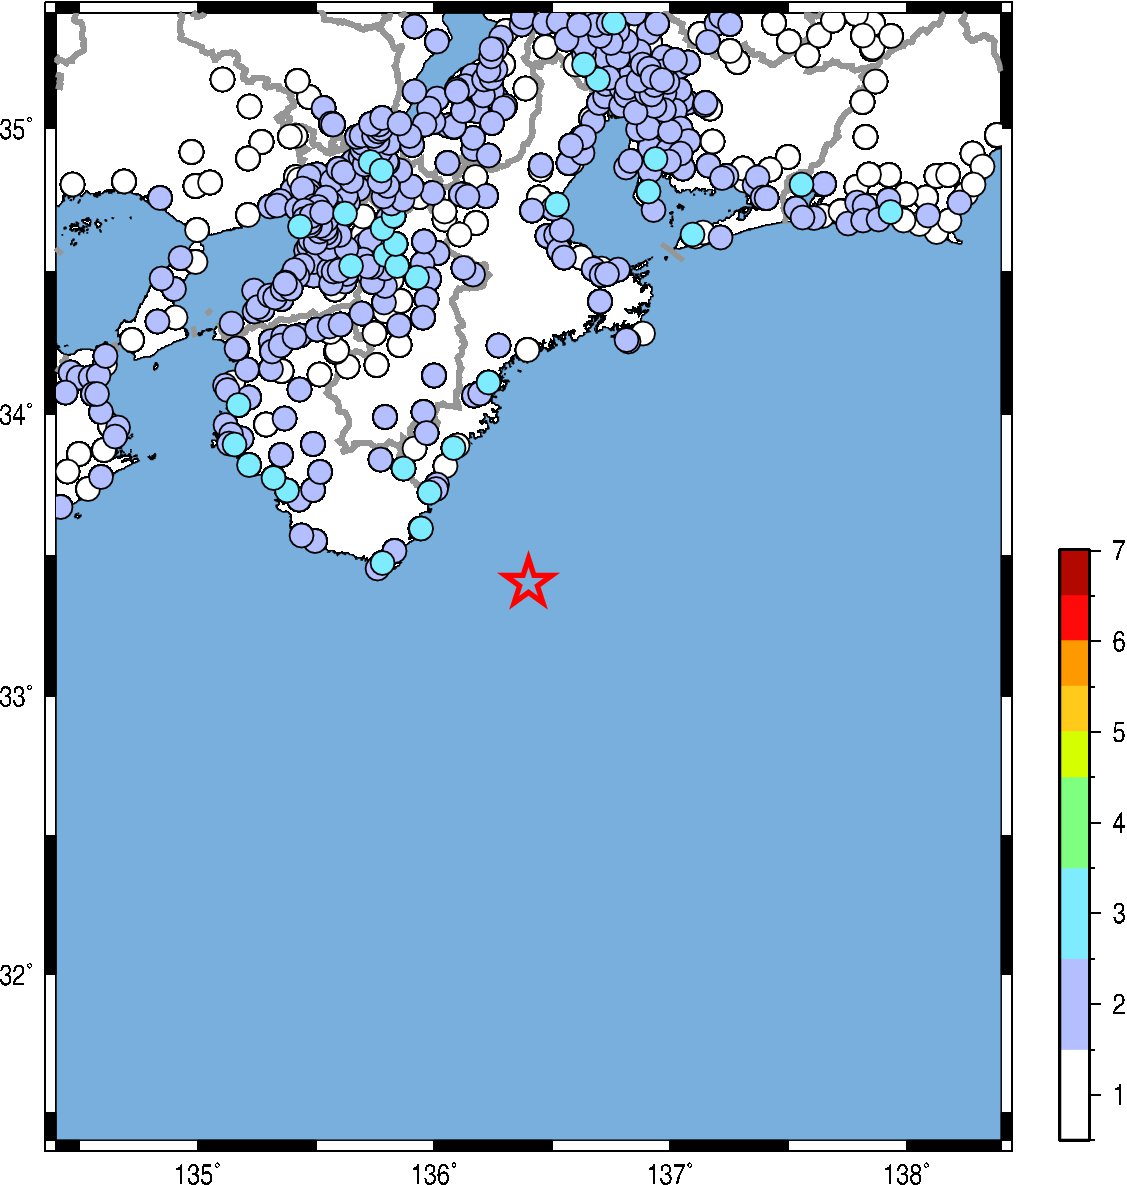
Fig.4. JMA seismic intensity.
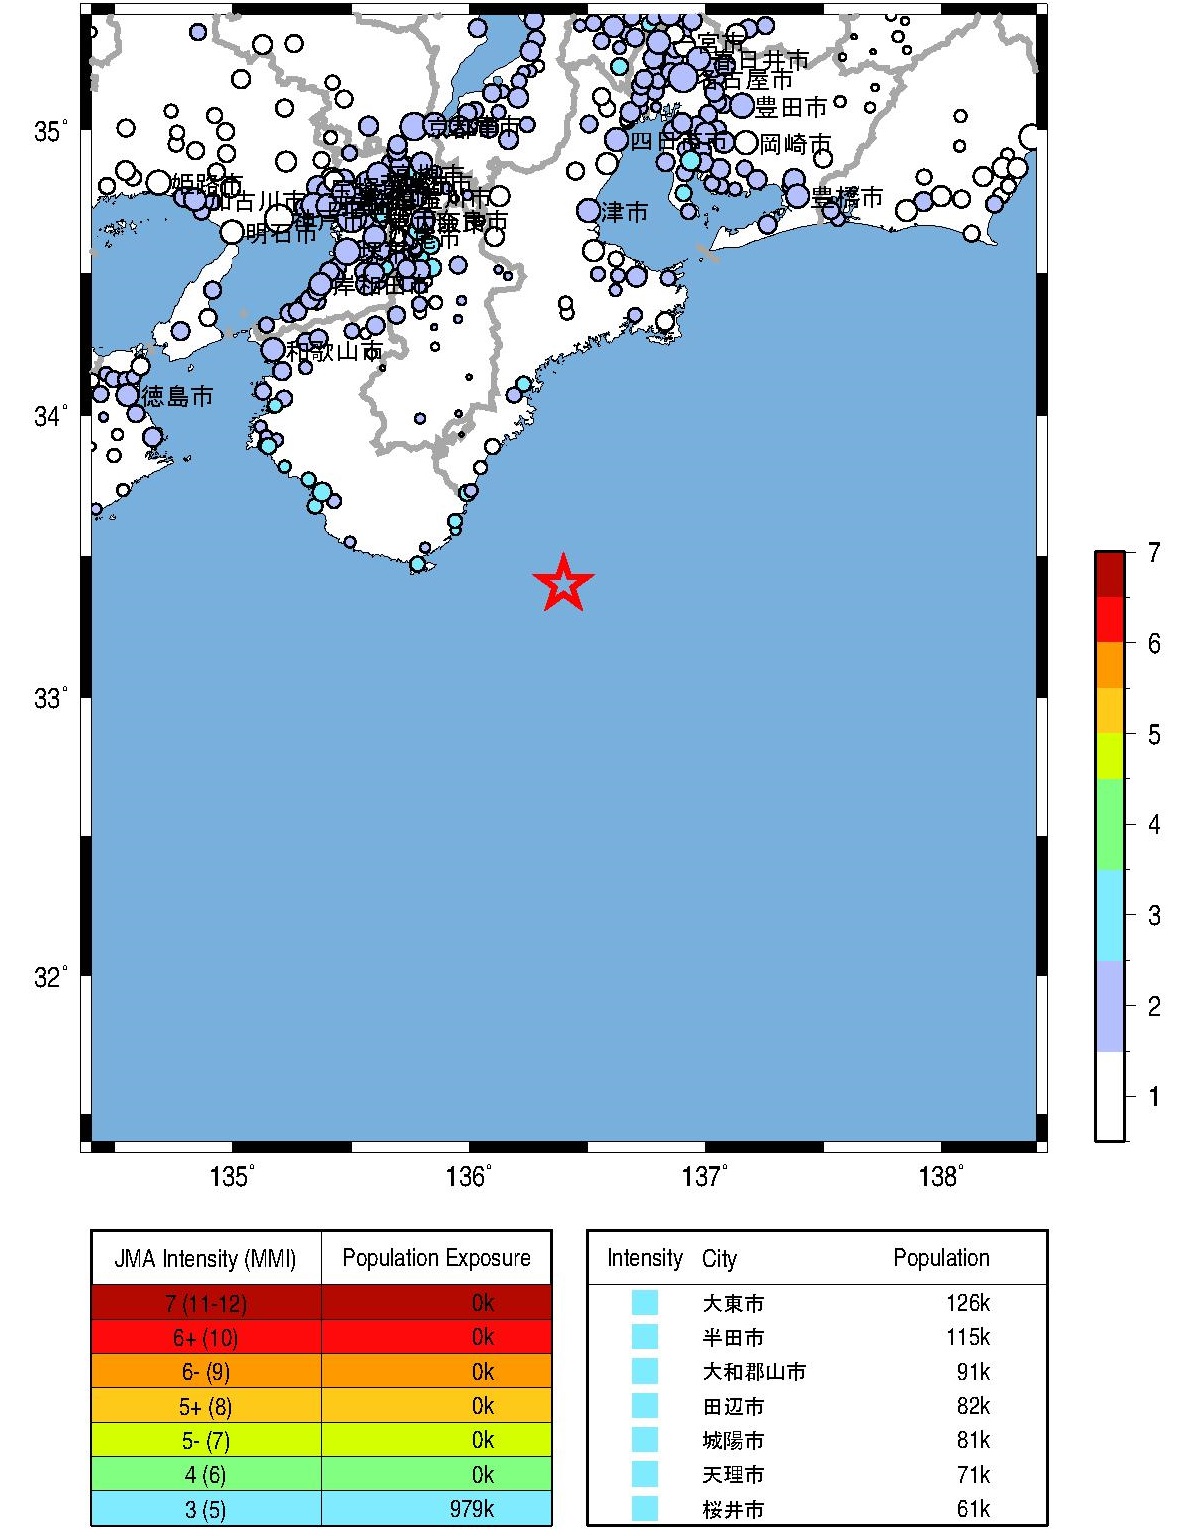
Fig.5. Population exposure. A circle size shows the population at the town, and a circle color shows the seismic intensity at the town.
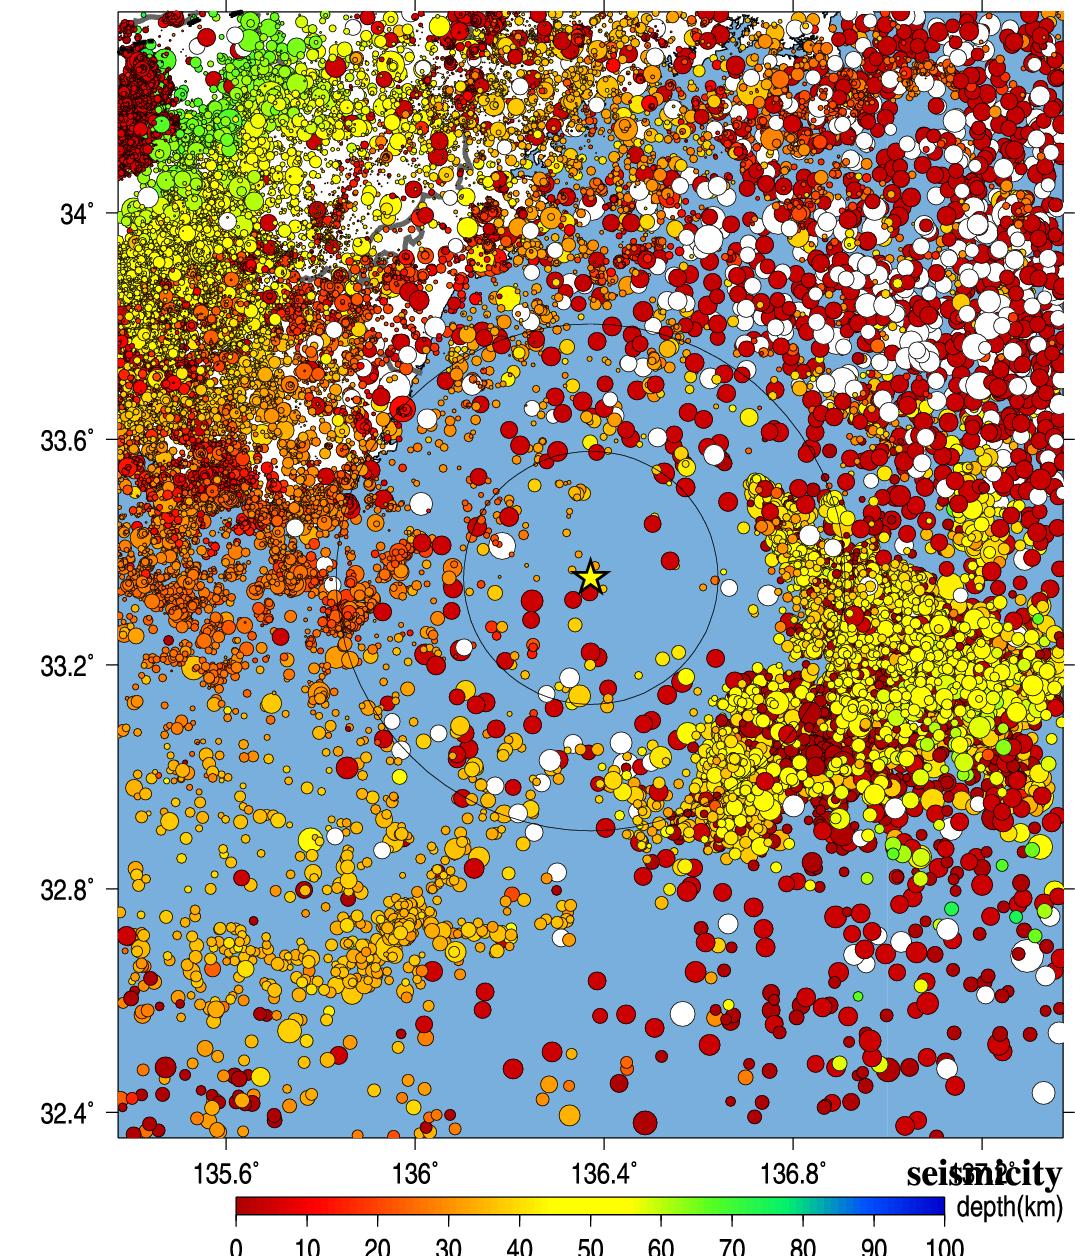
Fig.6. Seismic activity of past 40 years.
5.解析結果 (Analytical Result)
-------------------------------------------------------
WKY0111604011139 135.946 33.595 2.587 8.620 50.582 6.5 6.4
WKY0091604011139 135.981 33.721 2.348 9.670 57.795 6.5 6.3
WKY0121604011139 135.783 33.472 2.899 9.600 58.170 6.5 6.5
MIEH091604011139 135.997 33.764 2.703 9.890 60.685 6.5 6.4
MIE0151604011139 136.082 33.878 2.561 10.800 67.623 6.5 6.3
MIE0161604011139 135.919 33.876 3.285 11.680 74.993 6.5 6.6
WKY0071604011139 135.773 33.838 2.109 11.310 80.363 6.5 6.2
WKY0141604011139 135.640 33.705 2.773 12.650 81.037 6.5 6.4
WKYH041604011139 135.545 33.556 3.344 12.780 82.058 6.5 6.6
MIEH051604011139 136.169 34.064 2.899 12.860 84.520 6.5 6.5
Observed/Estimated Mw(median) tauc 6.5 6.4 2.7
-------------------------------------------------------
Table3. Analytical results using Tau_c method (Wu and Kanamori, 2005). Station ID, Station longitude, latitude, tauc, P-arrival time, epicentral distance(km) , magnitude, and estimated magnitude from the left.
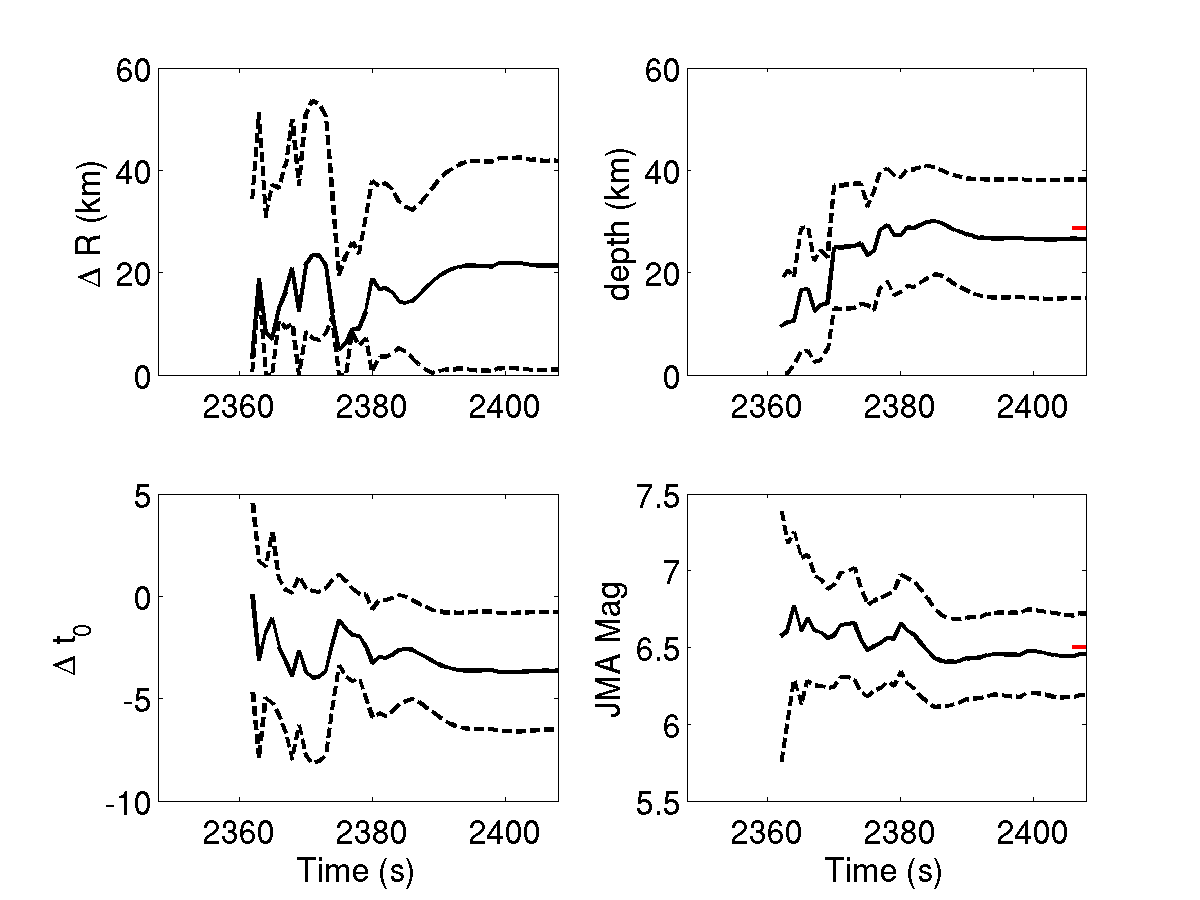
Fig.7. Time history of the estimates for source parameters by the IPF method (Wu et al., 2014). The error of epicenter, depth, error of origin time, JMA magnitude are shown. X-axis shows the time after the closest o'clocck sharp.
Wu, Y. M. and H. Kanamori (2005). Experiment on an onsite early warning method for the Taiwan early warning system, Bull. Seism. Soc. Am., 95, 347-353.
Wu, S, Yamada, M., K. Tamaribuchi, and J. Beck (2014). Multi-events Earthquake Early Warning algorithm using a Bayesian approach. Geophysical Journal International.
気象庁の震度情報、防災科学技術研究所のK-NET,KiK-netの波形、気象庁の強震波形、関西地震観測研究協議会の強震波形、一元化震源カタログをを利用しました。
緊急地震速報を発表した地震の解析結果
山田真澄 ホーム