━━━━━━━━━━━━━━━━━━━━━━━━
2015年5月13日 宮城県沖の地震
━━━━━━━━━━━━━━━━━━━━━━━━
1.地震について (Earthquake Information)
----------------------------------------------------
2015/05/13,06:12:58.862 38.8569 142.1664 42.1 6.7
----------------------------------------------------
Table1. Earthquake information. Origin time, Epicentral latitude, longitude, depth, and JMA magnitude from the left.(ref. Hi-net and JMA source mechanisms)
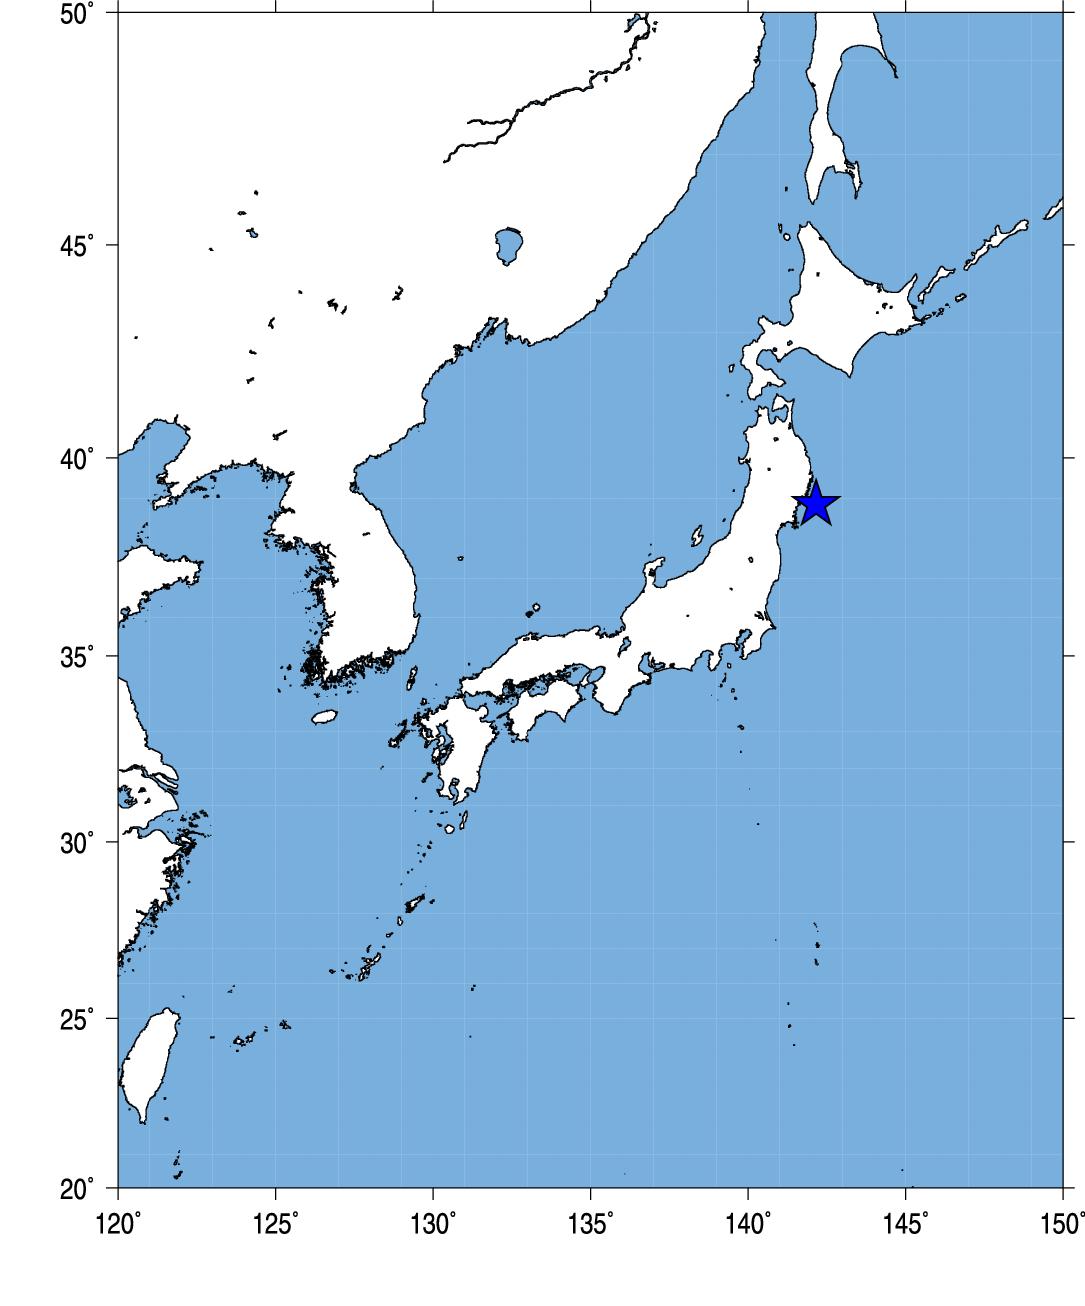
Fig.1. Event location.
2.観測点分布 (Station Distribution)
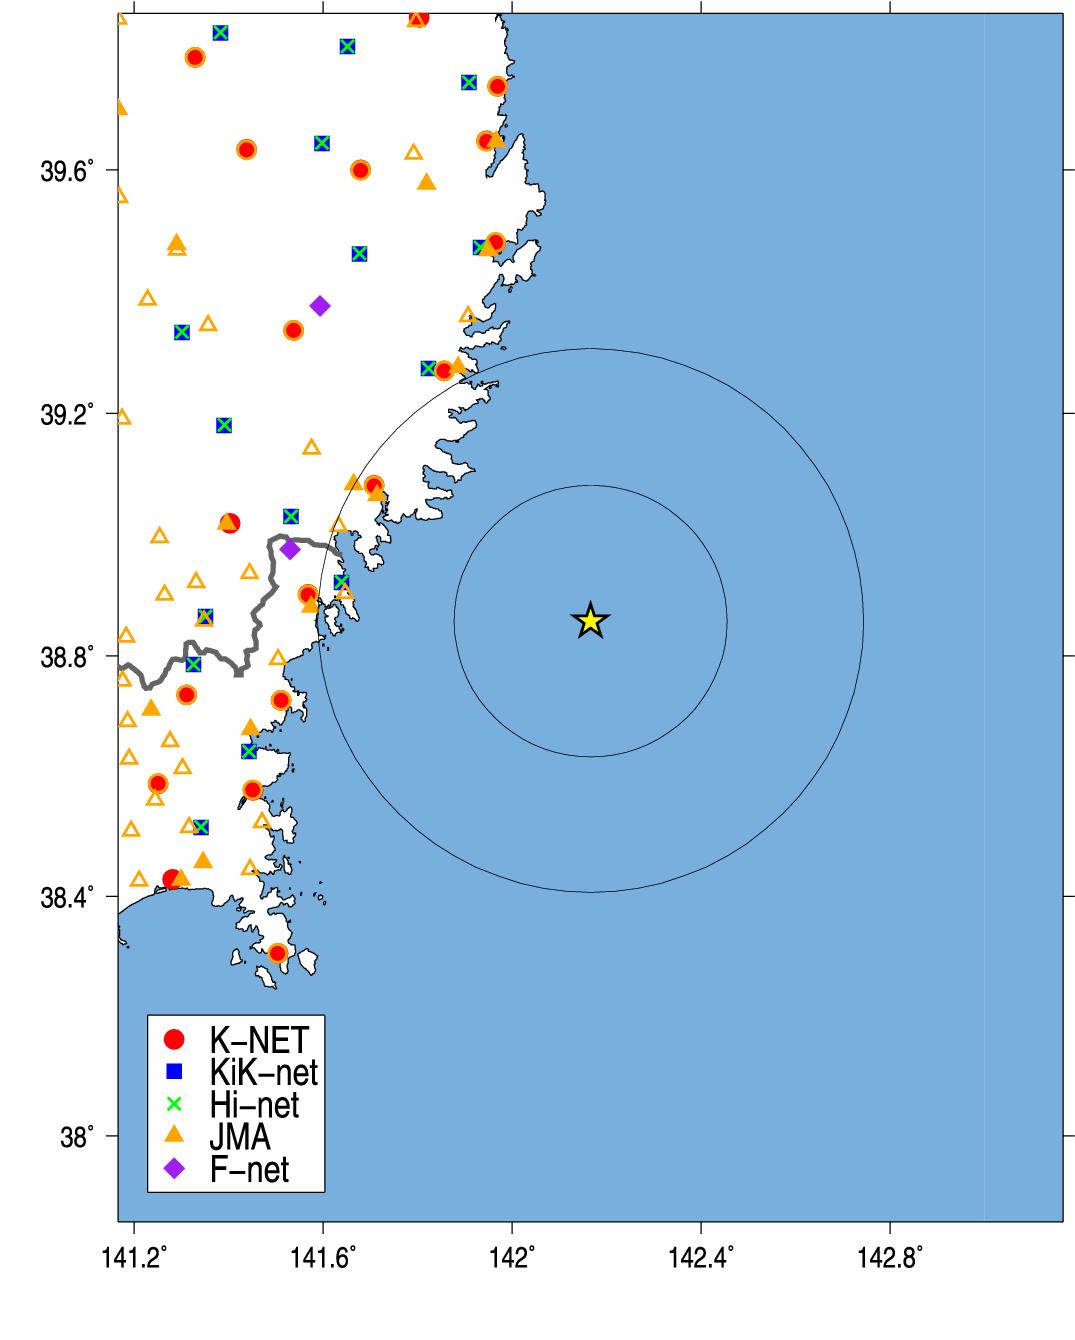
Fig.2. Station Distribution.
3.緊急地震速報発信状況 (Earthquake Early Warning Report)
-------------------------------------------------------------------[01] 15/02/17-13:46:42 04 M5.5 40.1N 142.2E 010km (15/02/17-13:46:51)
[03] 15/02/17-13:46:39 04 M5.7 40.1N 142.2E 050km (15/02/17-13:46:53)
[04] 15/02/17-13:46:39 04 M5.6 40.1N 142.2E 050km (15/02/17-13:46:59)
[05] 15/02/17-13:46:39 04 M5.8 40.1N 142.2E 050km (15/02/17-13:47:08)
[06] 15/02/17-13:46:39 04 M5.8 40.1N 142.2E 050km (15/02/17-13:47:18)
[07] 15/02/17-13:46:39 04 M5.7 40.1N 142.1E 050km (15/02/17-13:47:38)
[08] 15/02/17-13:46:39 04 M5.8 40.1N 142.2E 050km (15/02/17-13:47:42)
---------------------------------------------------------------------
(左から順に情報番号,震源時,最大予測震度,マグニチュード, 震央緯度,震央経度,震源深さ,電文発表時刻) from CEORKA
-------------------------------------------------------------------
Table2. Earthquake early warning reports. Information ID, Origin time, Maximum Intensity, JMA magnitude, Epicentral latitude, longitude, depth, and time to issue the report from the left.(ref. The Committee of Earthquake Observation and Research in the Kansai Area)
--> 気象庁による緊急地震速報の内容
4.観測記録 (Observed Records)
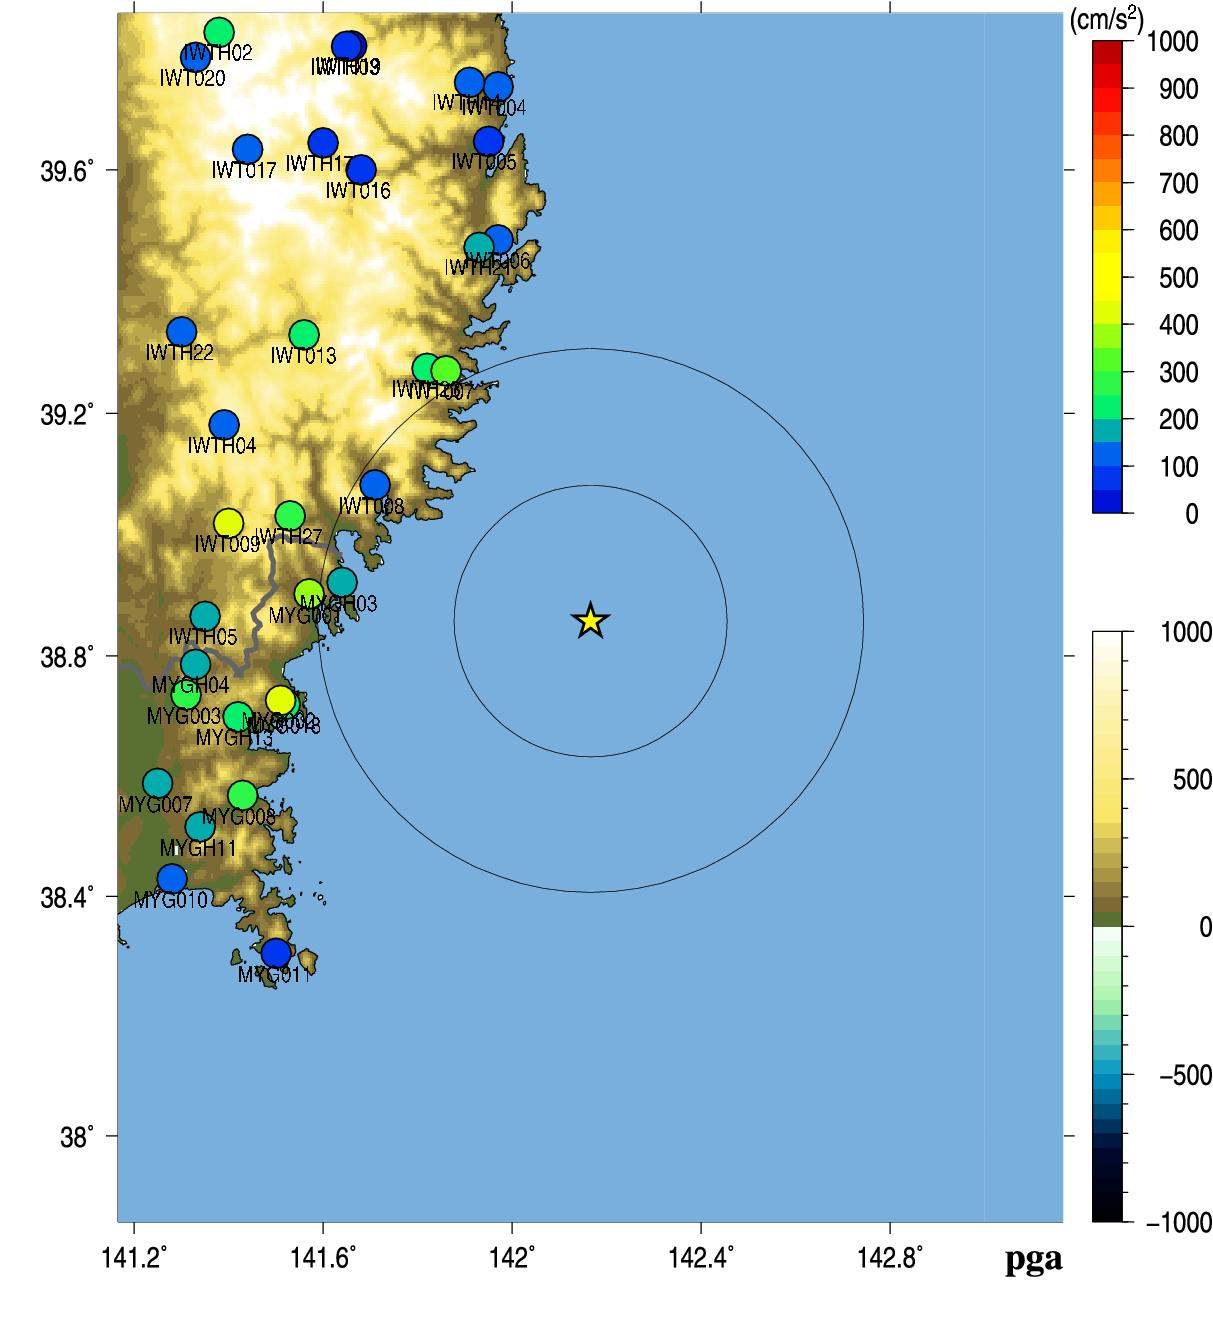
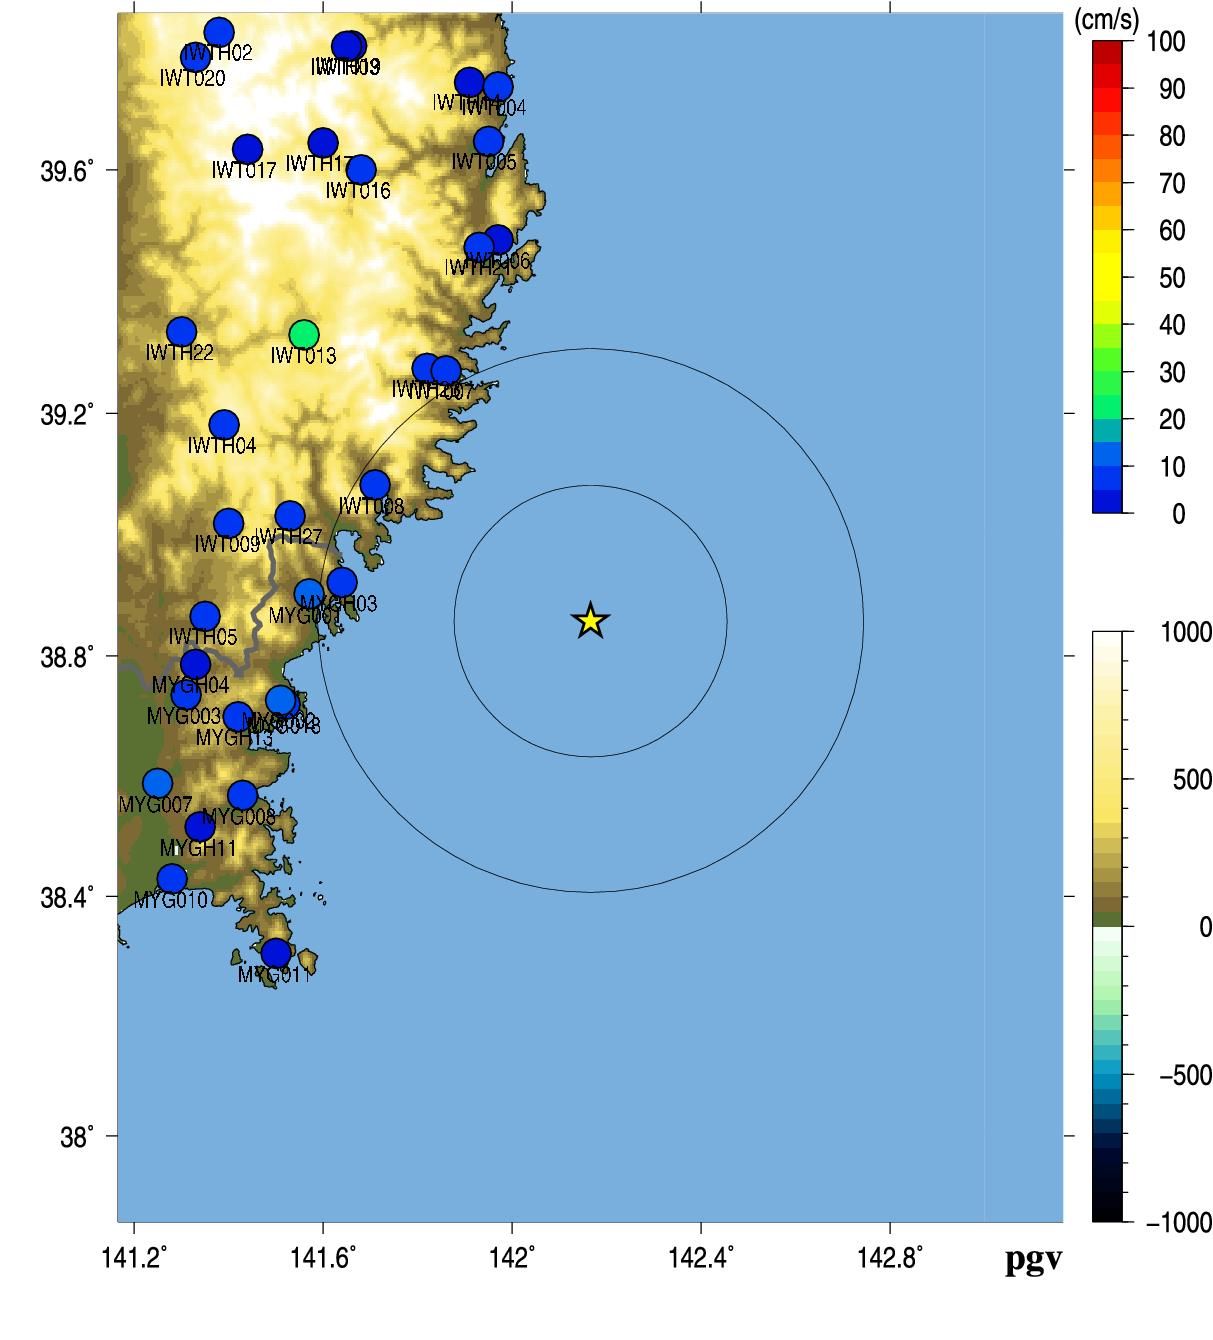
Fig.3. Peak Ground Acceleration (left) and Peak Ground Velocity (right).
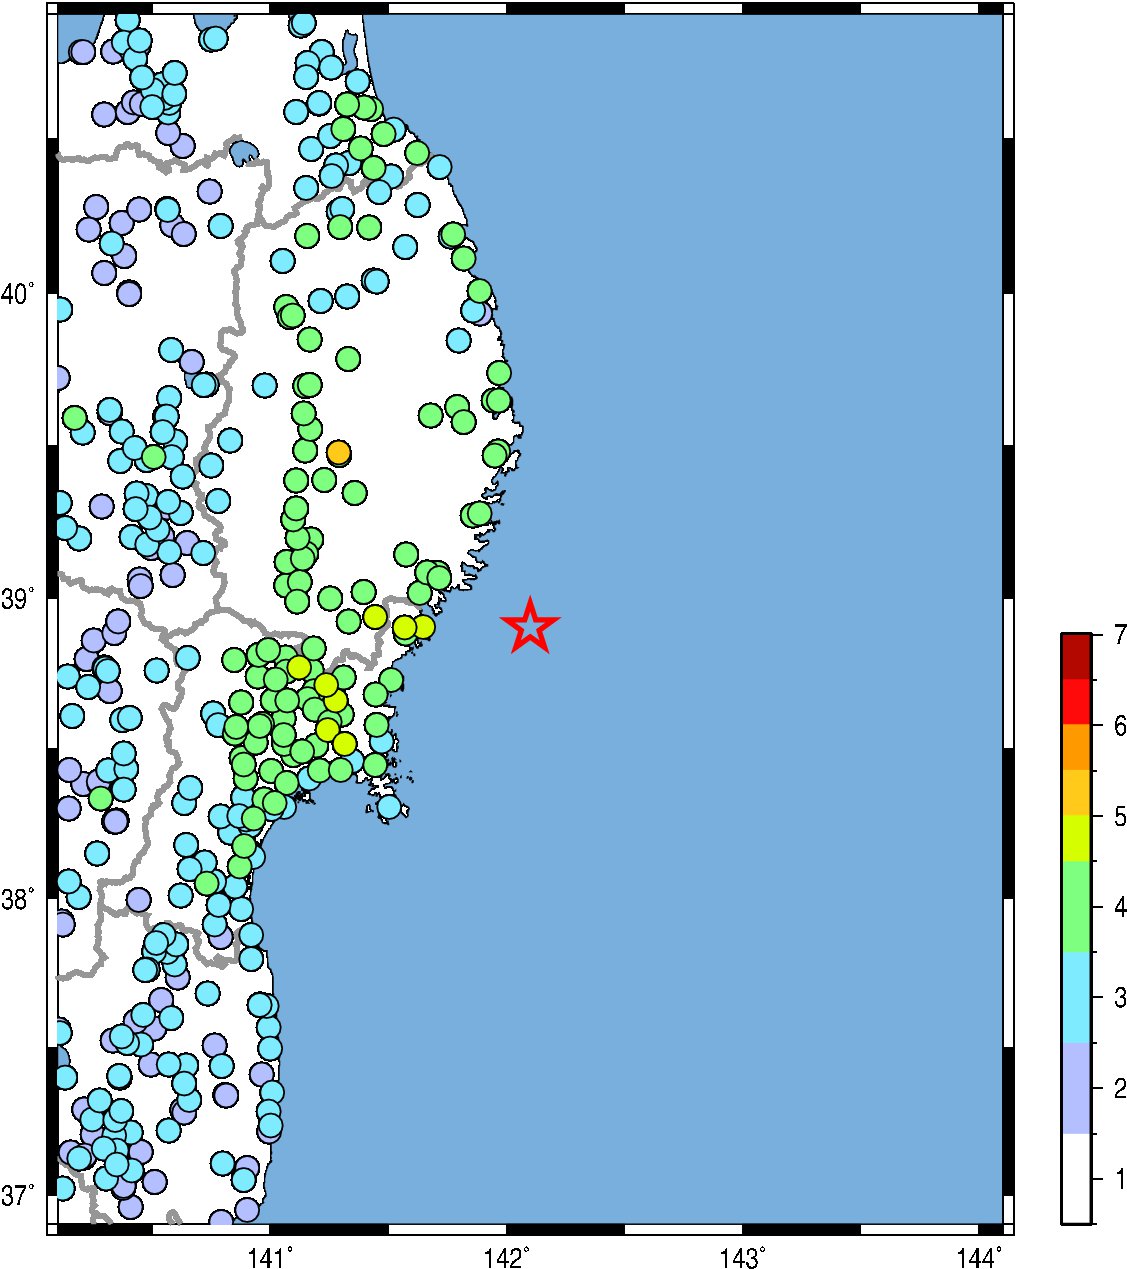
Fig.4. JMA seismic intensity.
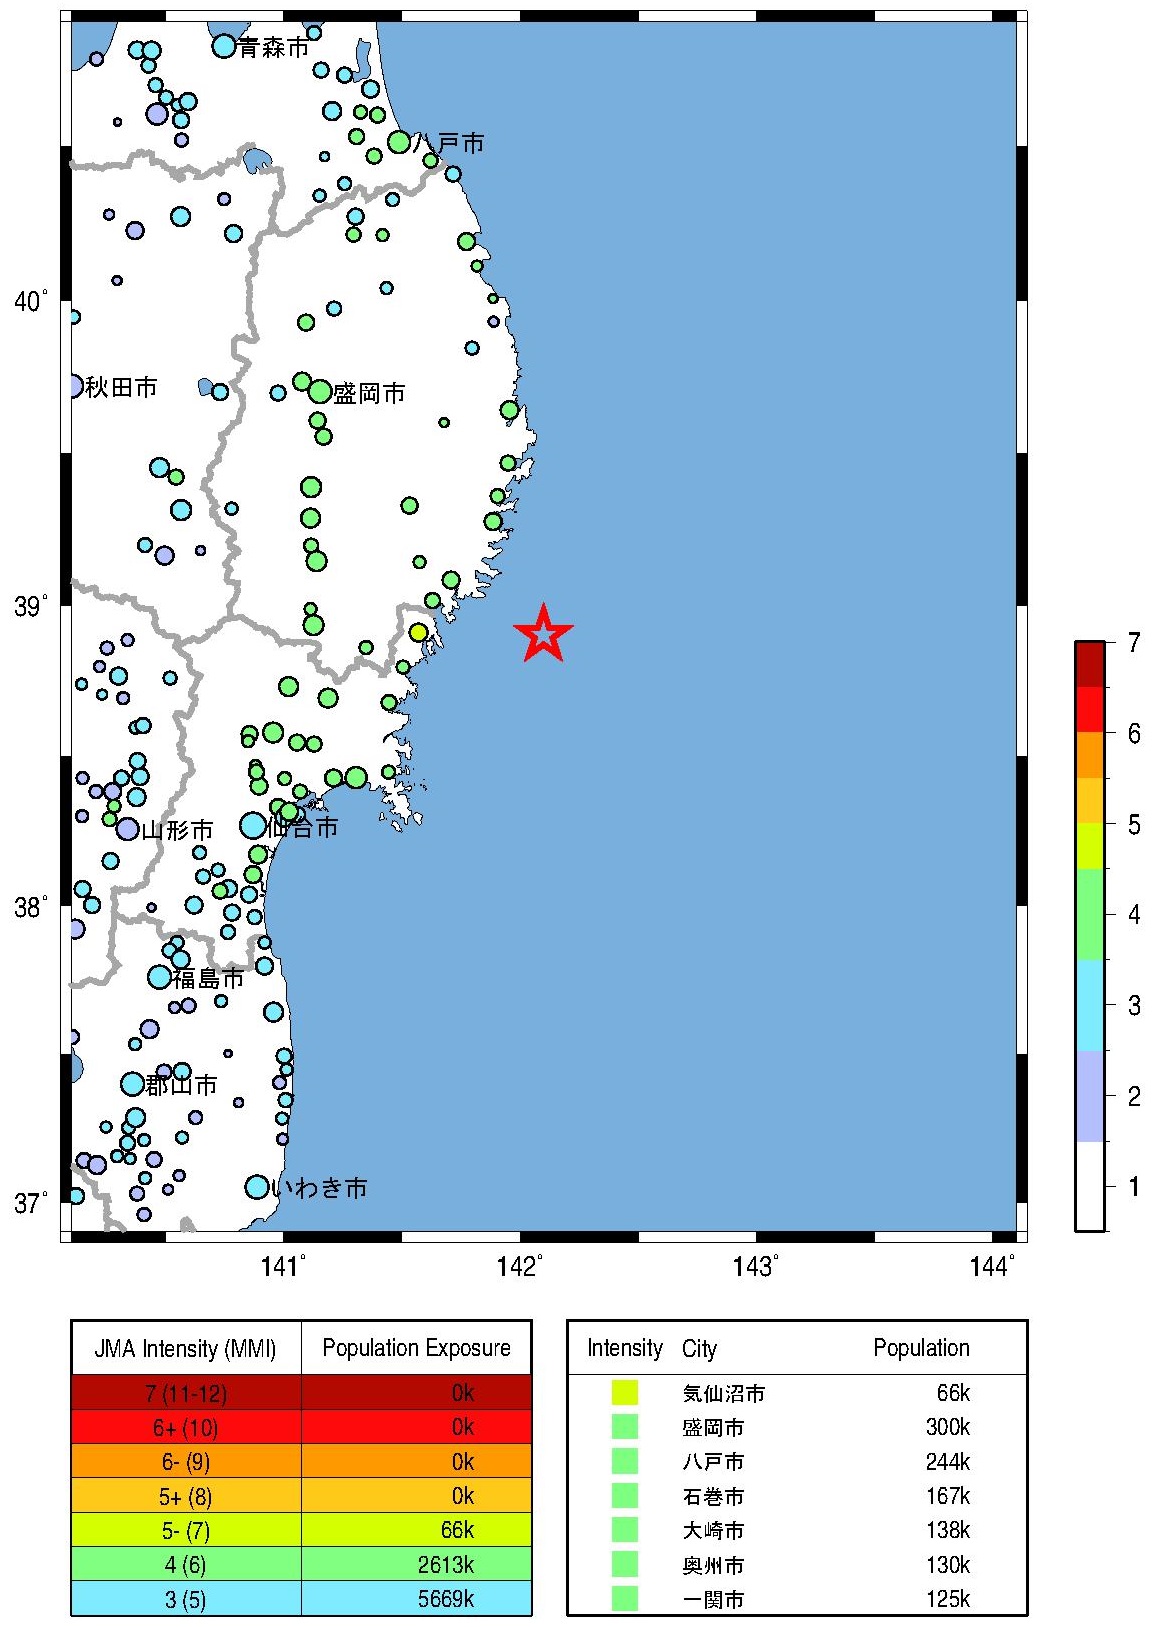
Fig.5. Population exposure. A circle size shows the population at the town, and a circle color shows the seismic intensity at the town.
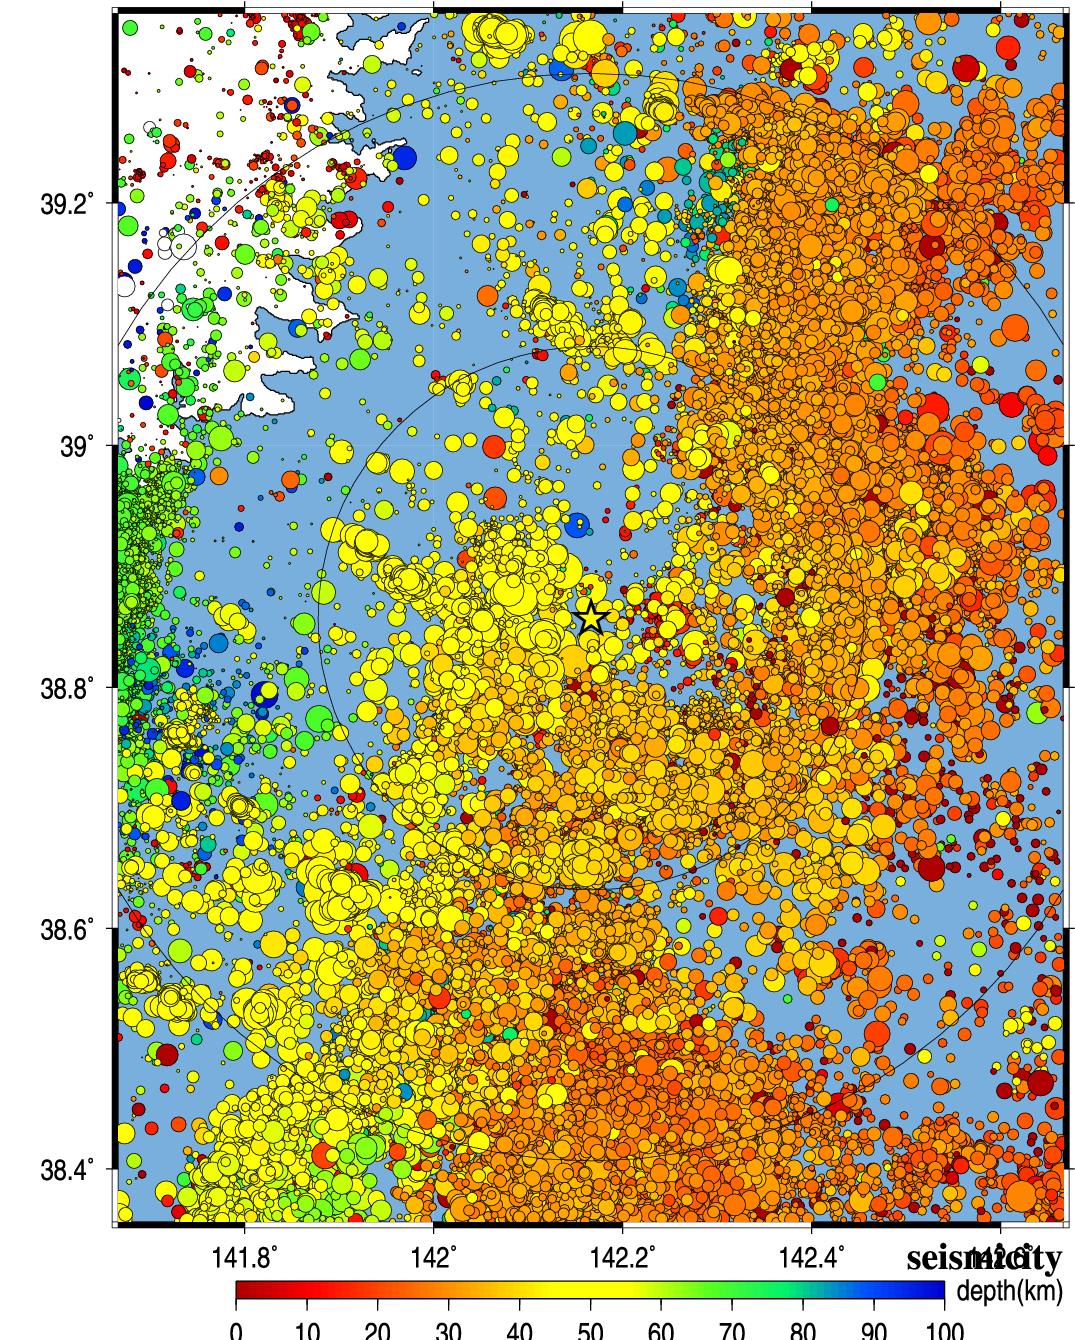
Fig.6. Seismic activity of past 40 years.
5.解析結果 (Analytical Result)
-------------------------------------------------------
MYGH031505130613 141.638 38.921 2.091 9.508 46.415 6.7 6.2
IWT0082015051306 141.708 39.082 2.137 9.568 46.881 6.7 6.2
MYG0012015051306 141.568 38.902 1.566 10.098 52.126 6.7 5.9
IWT0072015051306 141.856 39.270 2.008 10.168 53.156 6.7 6.1
IWTH231505130613 141.823 39.274 2.210 10.398 55.018 6.7 6.2
MYG0182015051306 141.523 38.719 1.972 10.868 57.965 6.7 6.1
IWTH271505130613 141.532 39.031 2.408 10.768 58.285 6.7 6.3
MYG0022015051306 141.511 38.726 1.616 10.938 58.769 6.7 5.9
MYGH131505130613 141.418 38.699 1.410 11.918 67.379 6.7 5.8
IWT0092015051306 141.403 39.019 2.154 11.968 68.573 6.7 6.2
Observed/Estimated Mw(median) tauc 6.7 6.15 2.0
-------------------------------------------------------
Table3. Analytical results using Tau_c method (Wu and Kanamori, 2005). Station ID, Station longitude, latitude, tauc, P-arrival time, epicentral distance(km) , magnitude, and estimated magnitude from the left.
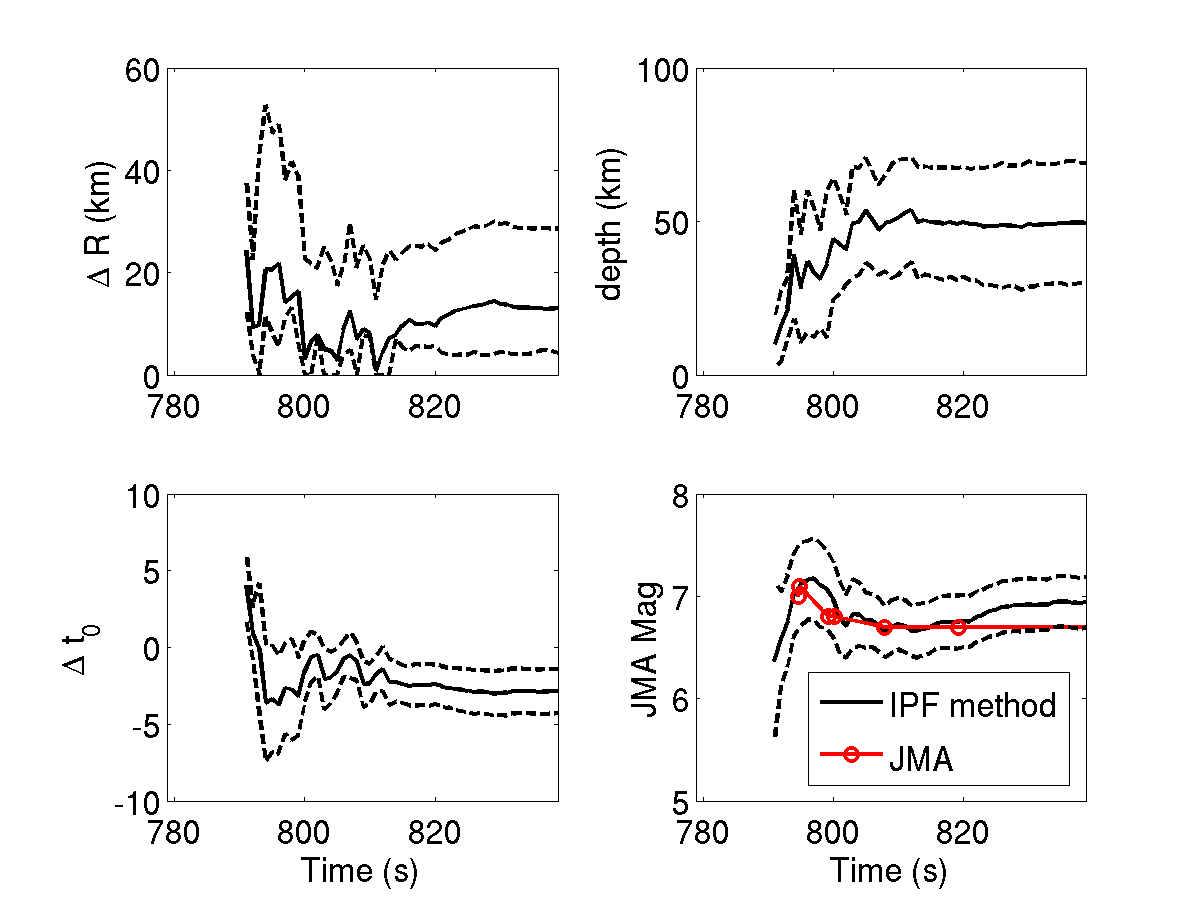
Fig.7. Time history of the estimates for source parameters by the IPF method (Wu et al., 2014). The error of epicenter, depth, error of origin time, JMA magnitude are shown. X-axis shows the time after the closest o'clocck sharp.
Wu, Y. M. and H. Kanamori (2005). Experiment on an onsite early warning method for the Taiwan early warning system, Bull. Seism. Soc. Am., 95, 347-353.
Wu, S, Yamada, M., K. Tamaribuchi, and J. Beck (2014). Multi-events Earthquake Early Warning algorithm using a Bayesian approach. Geophysical Journal International.
気象庁の震度情報、防災科学技術研究所のK-NET,KiK-netの波形、気象庁の強震波形、関西地震観測研究協議会の強震波形、一元化震源カタログをを利用しました。
緊急地震速報を発表した地震の解析結果
山田真澄 ホーム