━━━━━━━━━━━━━━━━━━━━━━━━
2015年2月17日 三陸沖の地震
━━━━━━━━━━━━━━━━━━━━━━━━
1.地震について (Earthquake Information)
----------------------------------------------------
2015/02/17,08:06:34.68 39.872 143.193 12.7 6.9
----------------------------------------------------
Table1. Earthquake information. Origin time, Epicentral latitude, longitude, depth, and JMA magnitude from the left.(ref. Hi-net and JMA source mechanisms)
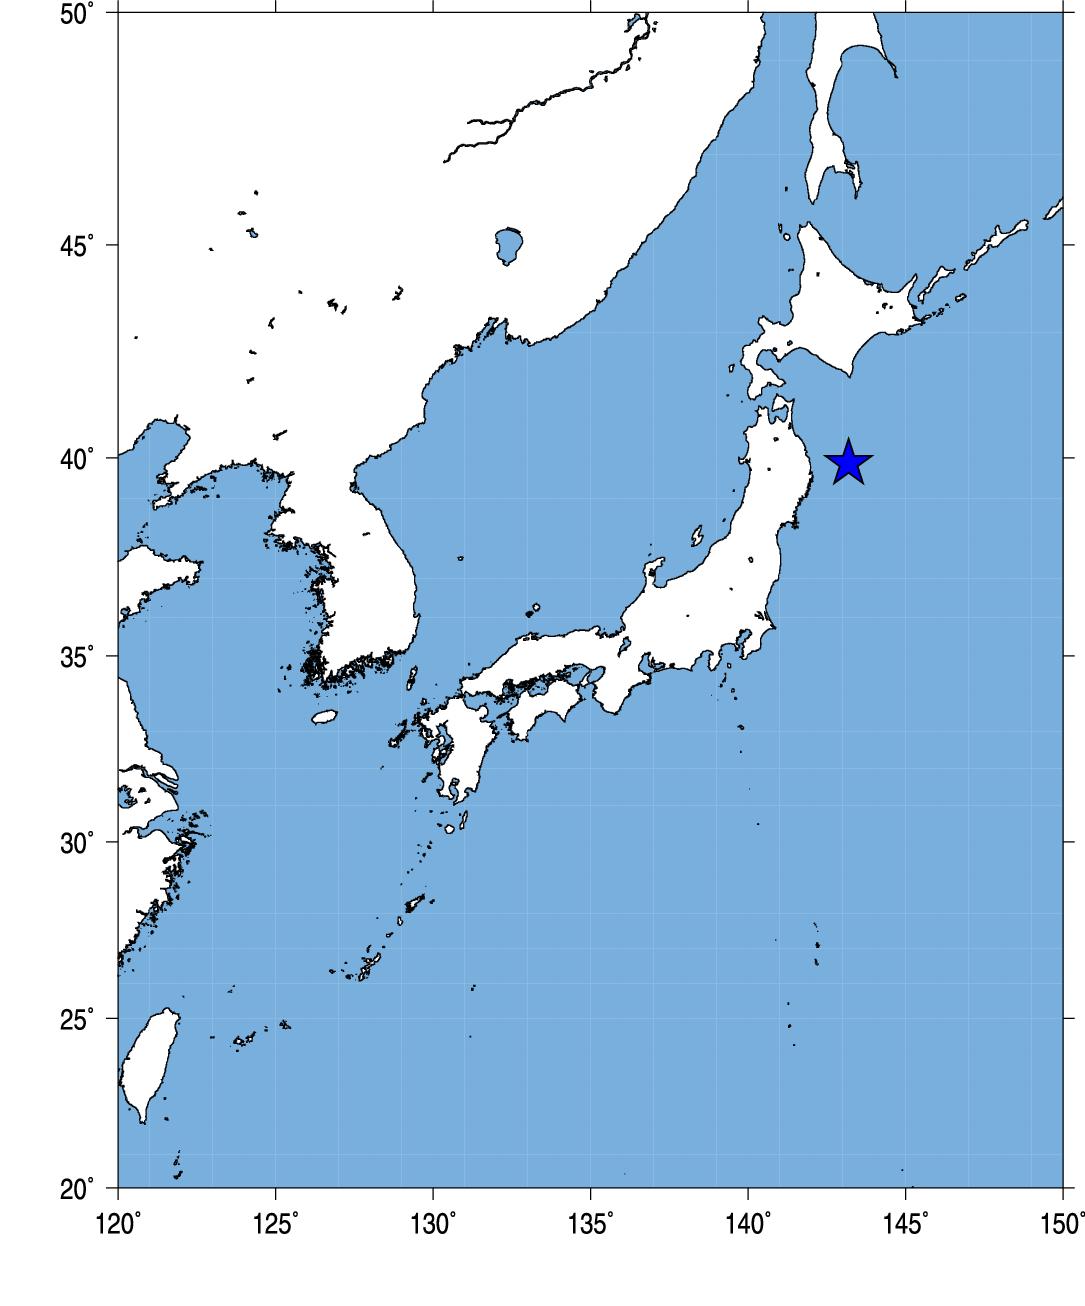
Fig.1. Event location.
2.観測点分布 (Station Distribution)
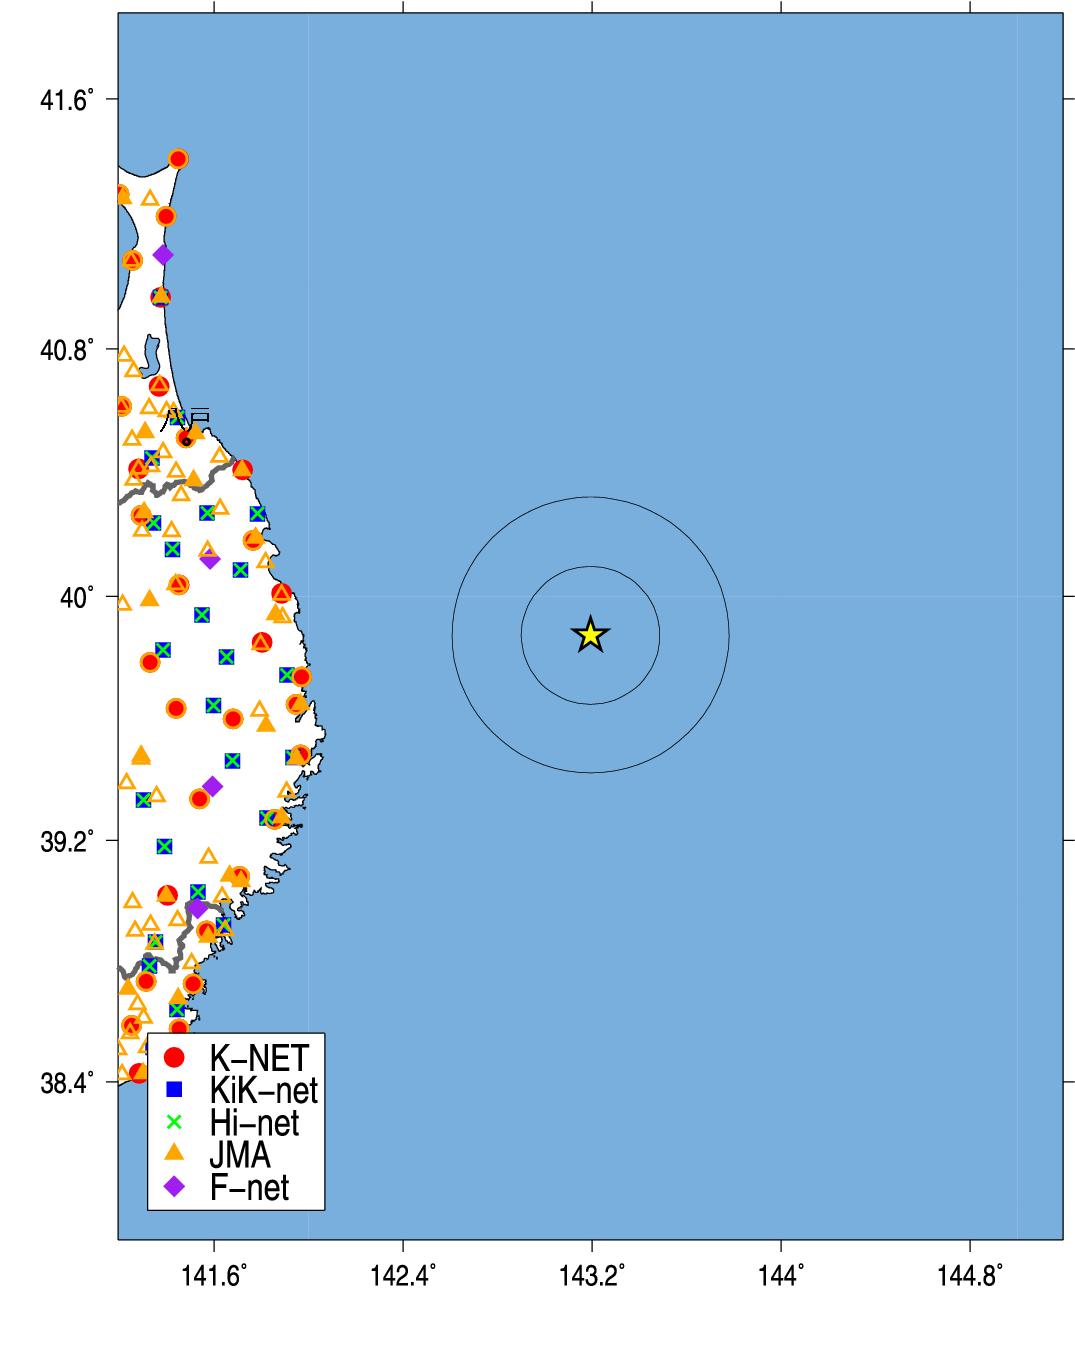
Fig.2. Station Distribution.
3.緊急地震速報発信状況 (Earthquake Early Warning Report)
-------------------------------------------------------------------[01] 15/02/17-08:06:19 03 M5.8 39.8N 143.6E 010km (15/02/17-08:06:52)
[04] 15/02/17-08:06:22 03 M6.0 39.8N 143.3E 010km (15/02/17-08:06:55)
[05] 15/02/17-08:06:23 04 M6.5 39.7N 143.3E 010km (15/02/17-08:07:01)
[06] 15/02/17-08:06:24 04 M6.9 39.7N 143.2E 010km (15/02/17-08:07:12)
[07] 15/02/17-08:06:24 04 M6.9 39.7N 143.2E 010km (15/02/17-08:07:14)
[08] 15/02/17-08:06:23 04 M6.9 39.7N 143.3E 010km (15/02/17-08:07:23)
[09] 15/02/17-08:06:22 04 M7.0 39.7N 143.4E 010km (15/02/17-08:07:36)
[10] 15/02/17-08:06:22 04 M7.0 39.7N 143.4E 010km (15/02/17-08:07:56)
[11] 15/02/17-08:06:22 04 M7.0 39.7N 143.4E 010km (15/02/17-08:08:13)
---------------------------------------------------------------------
(左から順に情報番号,震源時,最大予測震度,マグニチュード, 震央緯度,震央経度,震源深さ,電文発表時刻) from CEORKA
-------------------------------------------------------------------
Table2. Earthquake early warning reports. Information ID, Origin time, Maximum Intensity, JMA magnitude, Epicentral latitude, longitude, depth, and time to issue the report from the left.(ref. The Committee of Earthquake Observation and Research in the Kansai Area)
--> 気象庁による緊急地震速報の内容
4.観測記録 (Observed Records)
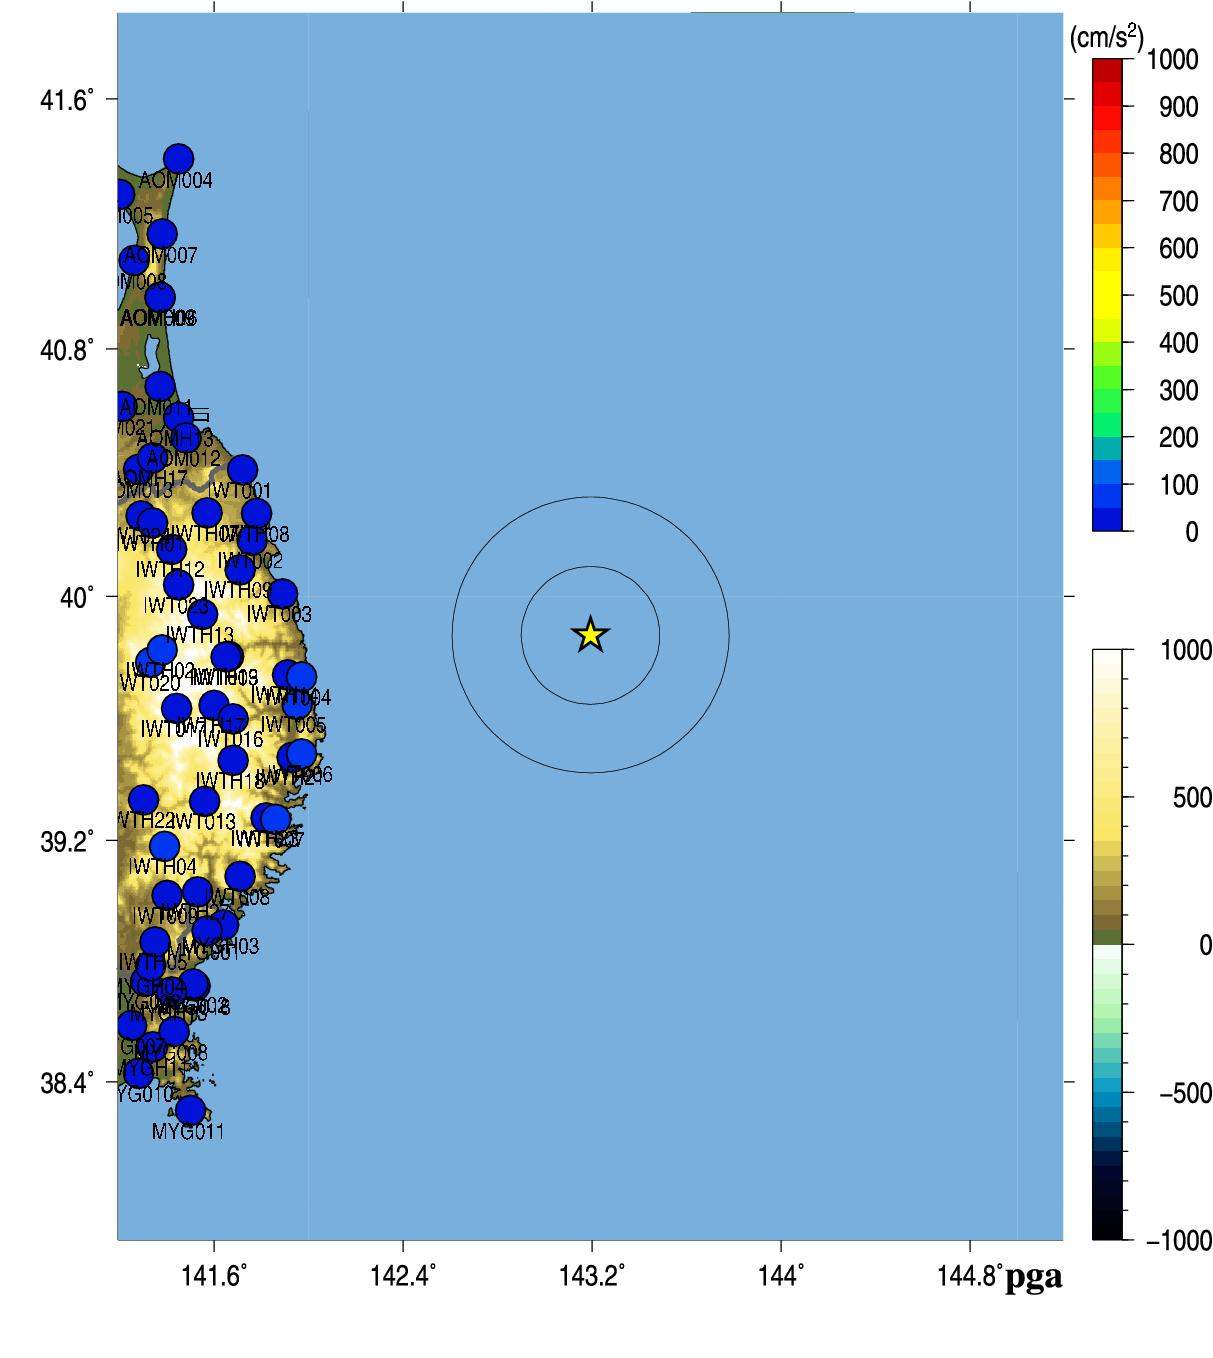
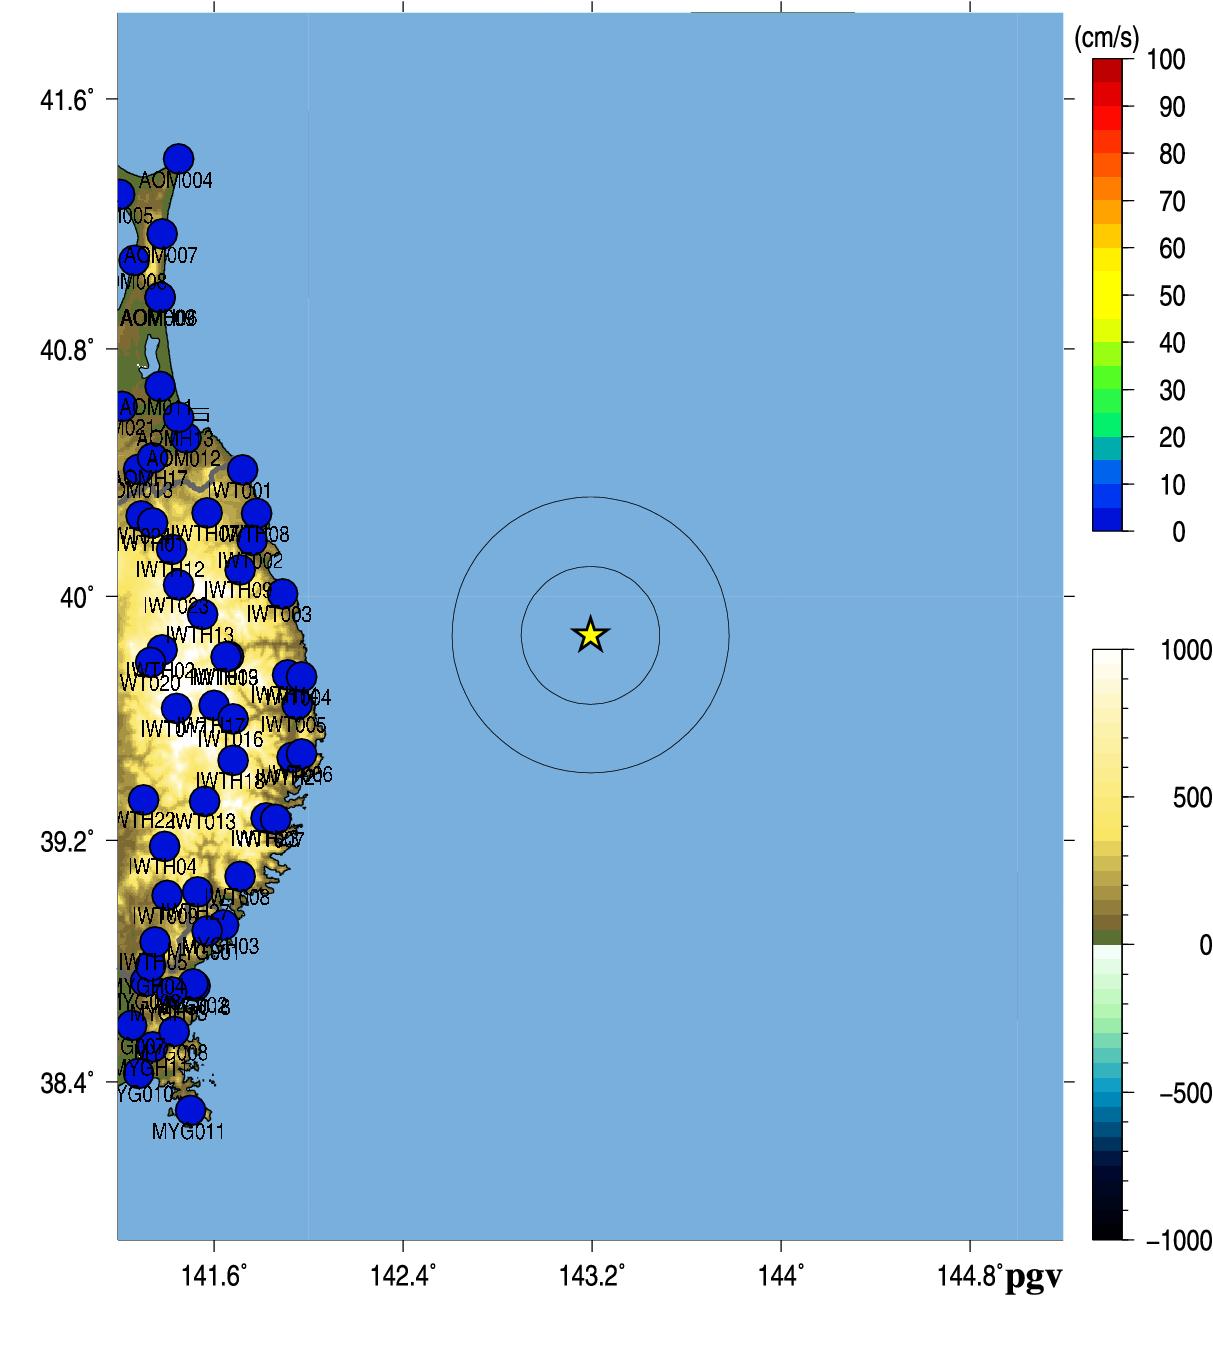
Fig.3. Peak Ground Acceleration (left) and Peak Ground Velocity (right).
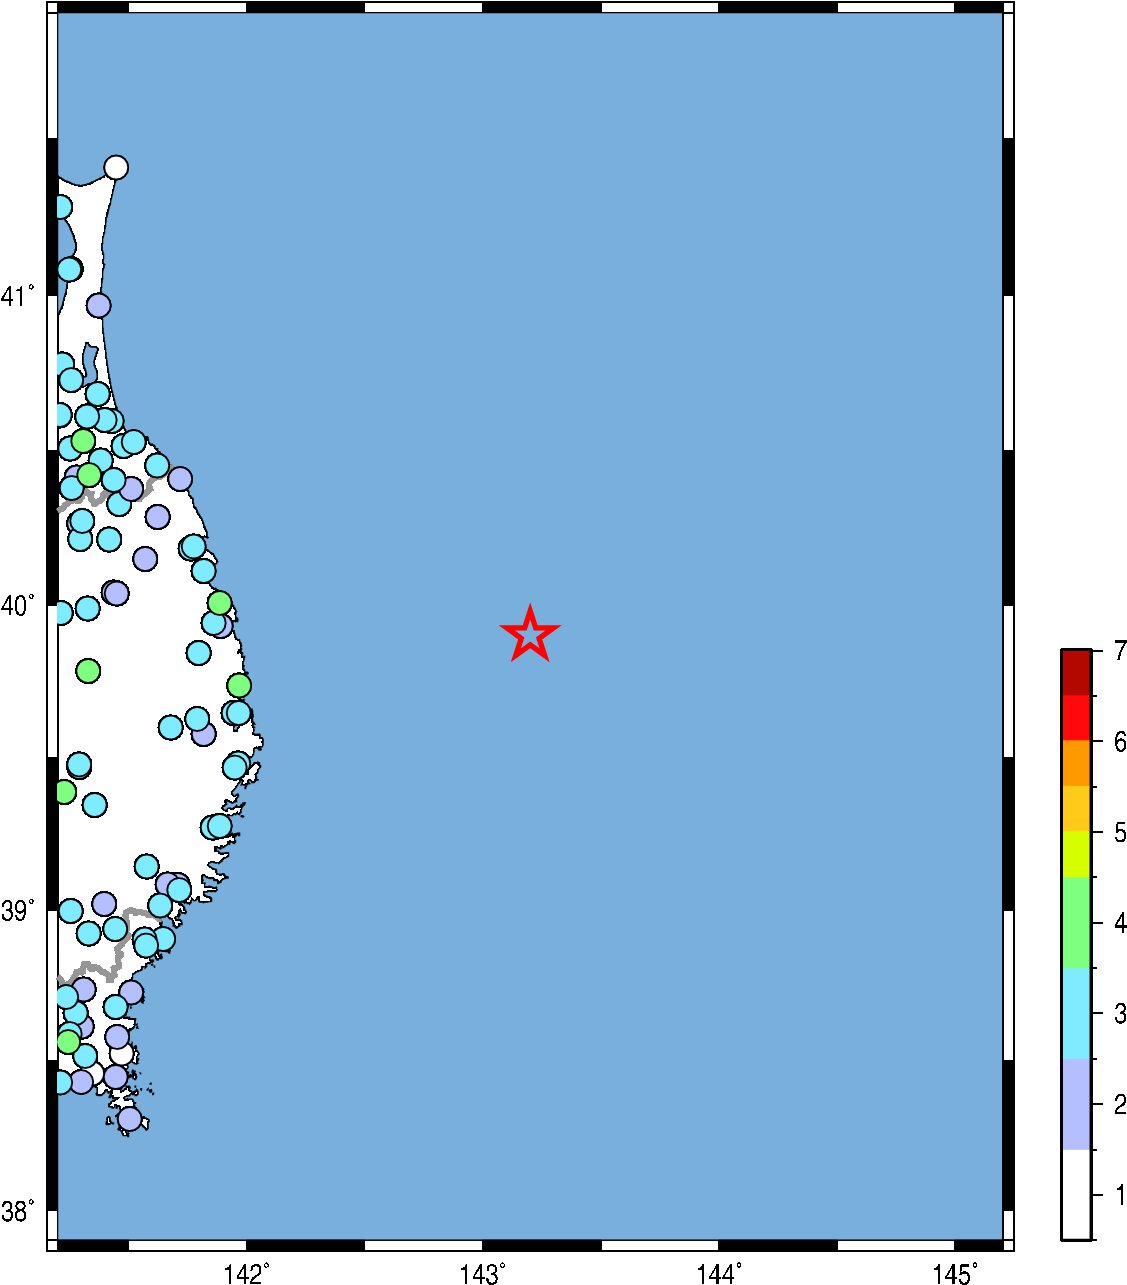
Fig.4. JMA seismic intensity.
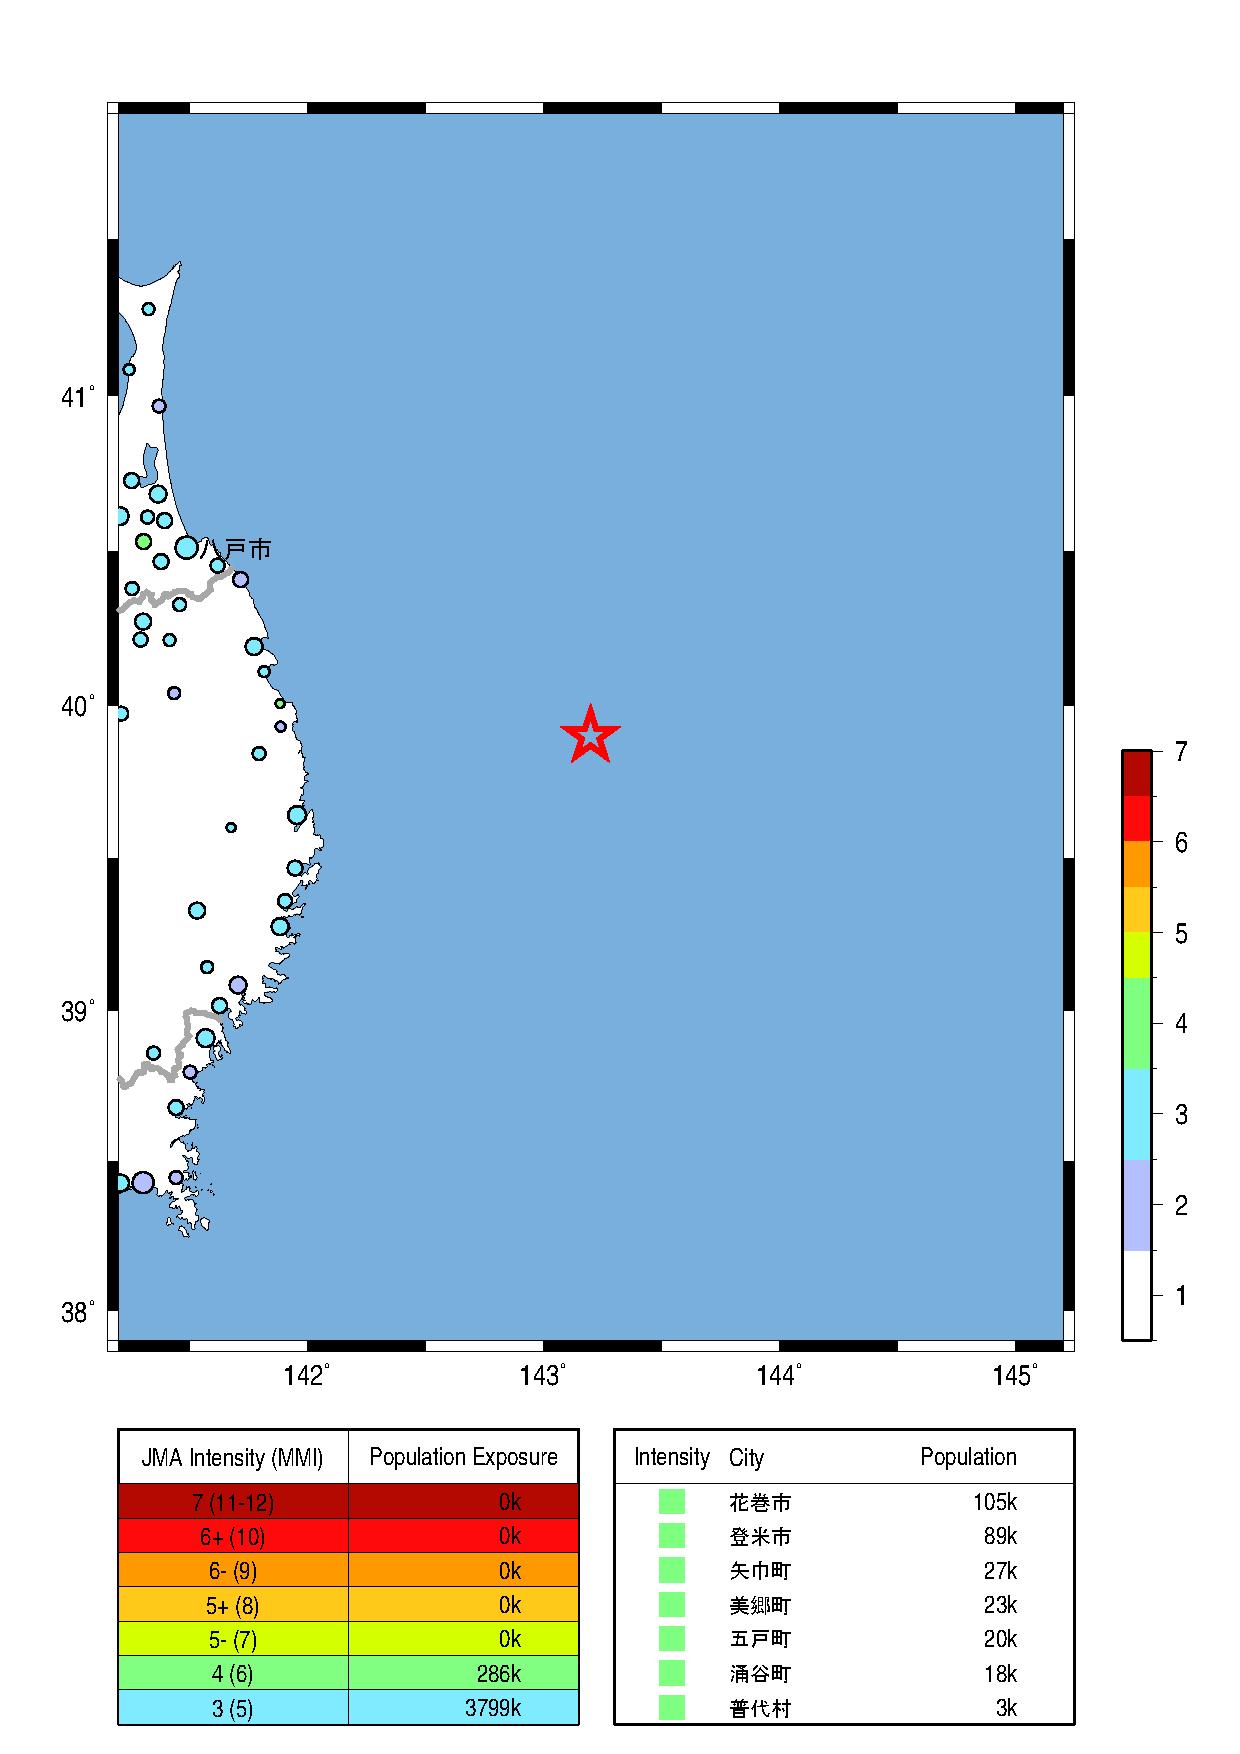
Fig.5. Population exposure. A circle size shows the population at the town, and a circle color shows the seismic intensity at the town.
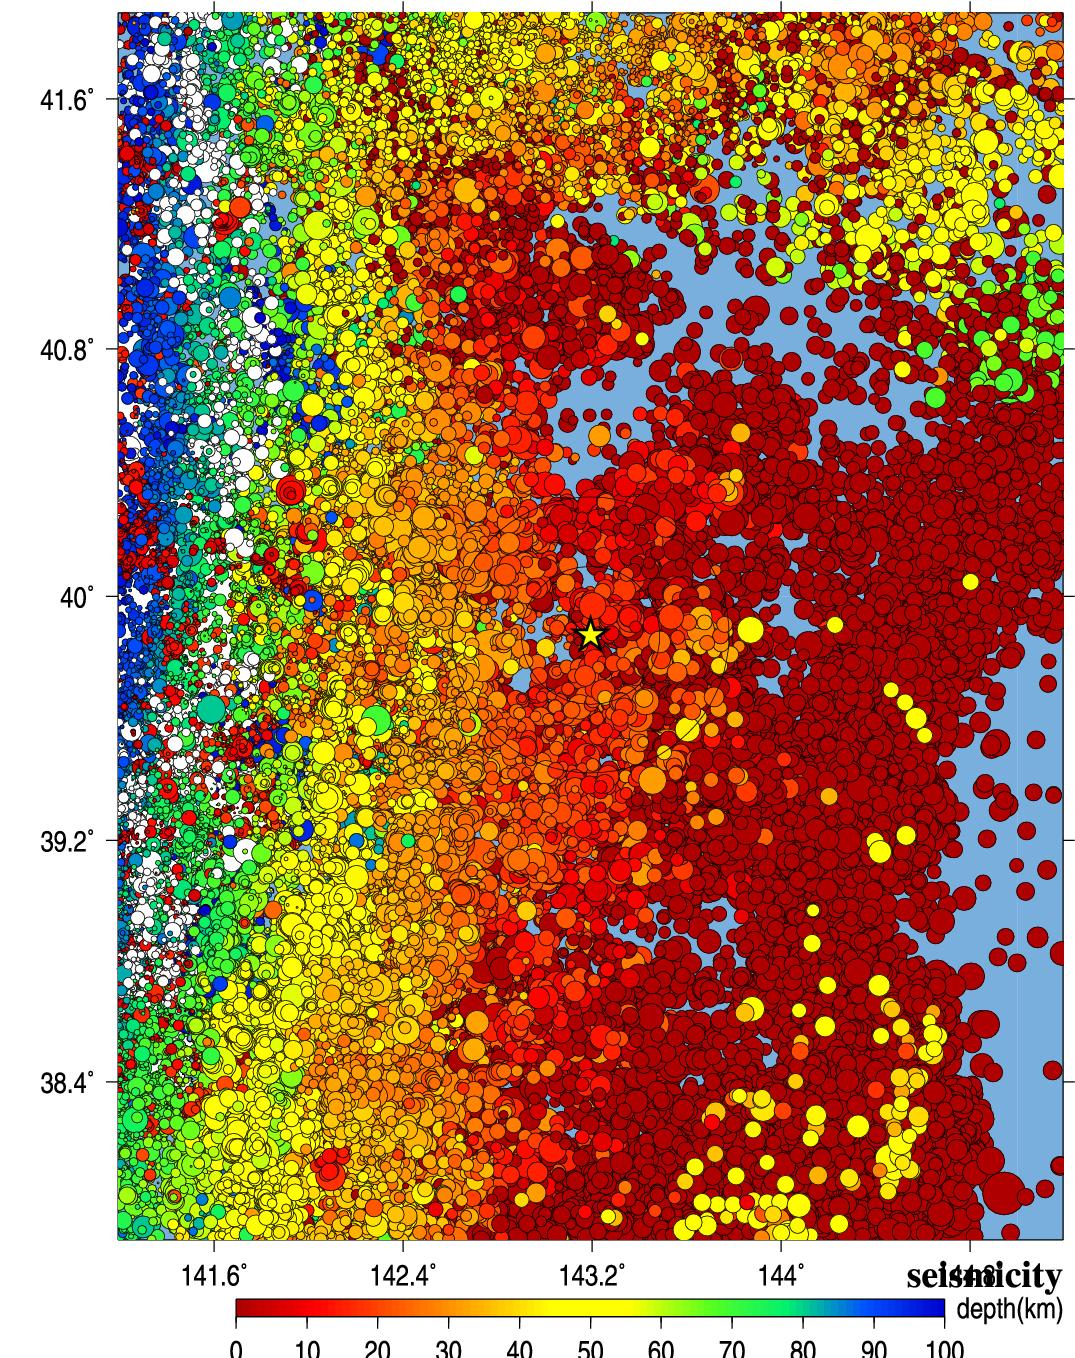
Fig.6. Seismic activity of past 40 years.
5.解析結果 (Analytical Result)
-------------------------------------------------------
file stlo stla tau_c triggr dist Mj Mest IWT0041502170806 141.967 39.736 0.507 8.940 106.067 6.9 4.9
IWT0051502170806 141.946 39.647 0.890 8.830 109.701 6.9 5.4
IWTH141502170806 141.909 39.743 1.729 9.060 110.898 6.9 6.0
IWT0031502170806 141.886 40.008 1.187 9.630 112.719 6.9 5.6
IWT0061502170806 141.975 39.485 0.737 8.770 113.000 6.9 5.2
IWTH211502170806 141.934 39.473 1.402 9.360 116.767 6.9 5.8
IWT0021502170806 141.764 40.182 1.362 13.430 126.730 6.9 5.8
IWTH081502170806 141.783 40.269 0.945 12.900 128.080 6.9 5.4
IWTH091502170806 141.712 40.086 1.325 15.620 128.719 6.9 5.7
IWT0191502170806 141.658 39.803 1.543 15.940 131.577 6.9 5.9
Observed/Estimated Mw(median) tauc 6.9 5.65 1.3
-------------------------------------------------------
Table3. Analytical results using Tau_c method (Wu and Kanamori, 2005). Station ID, Station longitude, latitude, tauc, P-arrival time, epicentral distance(km) , magnitude, and estimated magnitude from the left.
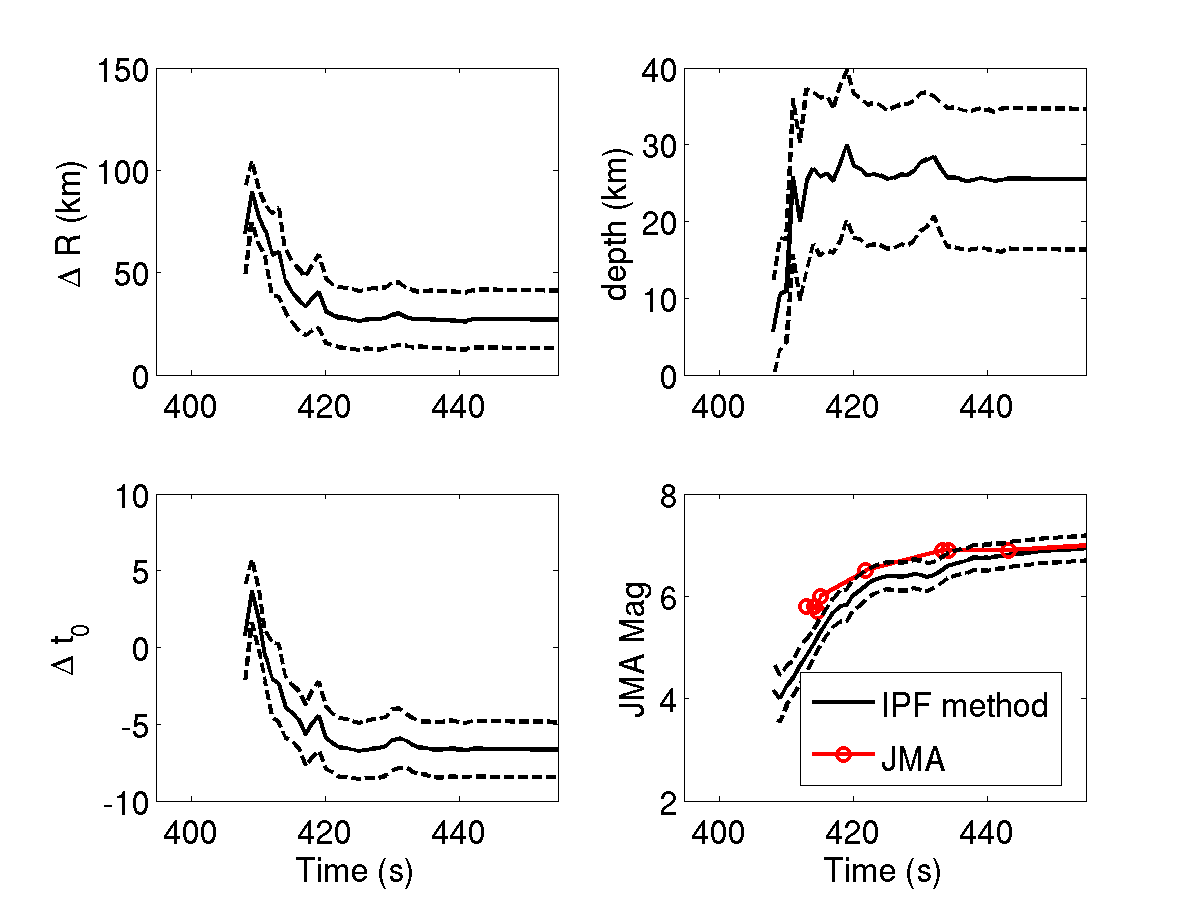
Fig.7. Time history of the estimates for source parameters by the IPF method (Wu et al., 2014). The error of epicenter, depth, error of origin time, JMA magnitude are shown. X-axis shows the time after the closest o'clocck sharp.
Wu, Y. M. and H. Kanamori (2005). Experiment on an onsite early warning method for the Taiwan early warning system, Bull. Seism. Soc. Am., 95, 347-353.
Wu, S, Yamada, M., K. Tamaribuchi, and J. Beck (2014). Multi-events Earthquake Early Warning algorithm using a Bayesian approach. Geophysical Journal International.
気象庁の震度情報、防災科学技術研究所のK-NET,KiK-netの波形、気象庁の強震波形、関西地震観測研究協議会の強震波形、一元化震源カタログをを利用しました。
緊急地震速報を発表した地震の解析結果
山田真澄 ホーム