━━━━━━━━━━━━━━━━━━━━━━━━
2015年2月6日 徳島県南部の地震
━━━━━━━━━━━━━━━━━━━━━━━━
1.地震について (Earthquake Information)
----------------------------------------------------
2015/02/06,10:25:12.44 33.734 134.370 11.2 5.1
----------------------------------------------------
Table1. Earthquake information. Origin time, Epicentral latitude, longitude, depth, and JMA magnitude from the left.(ref. Hi-net and JMA source mechanisms)
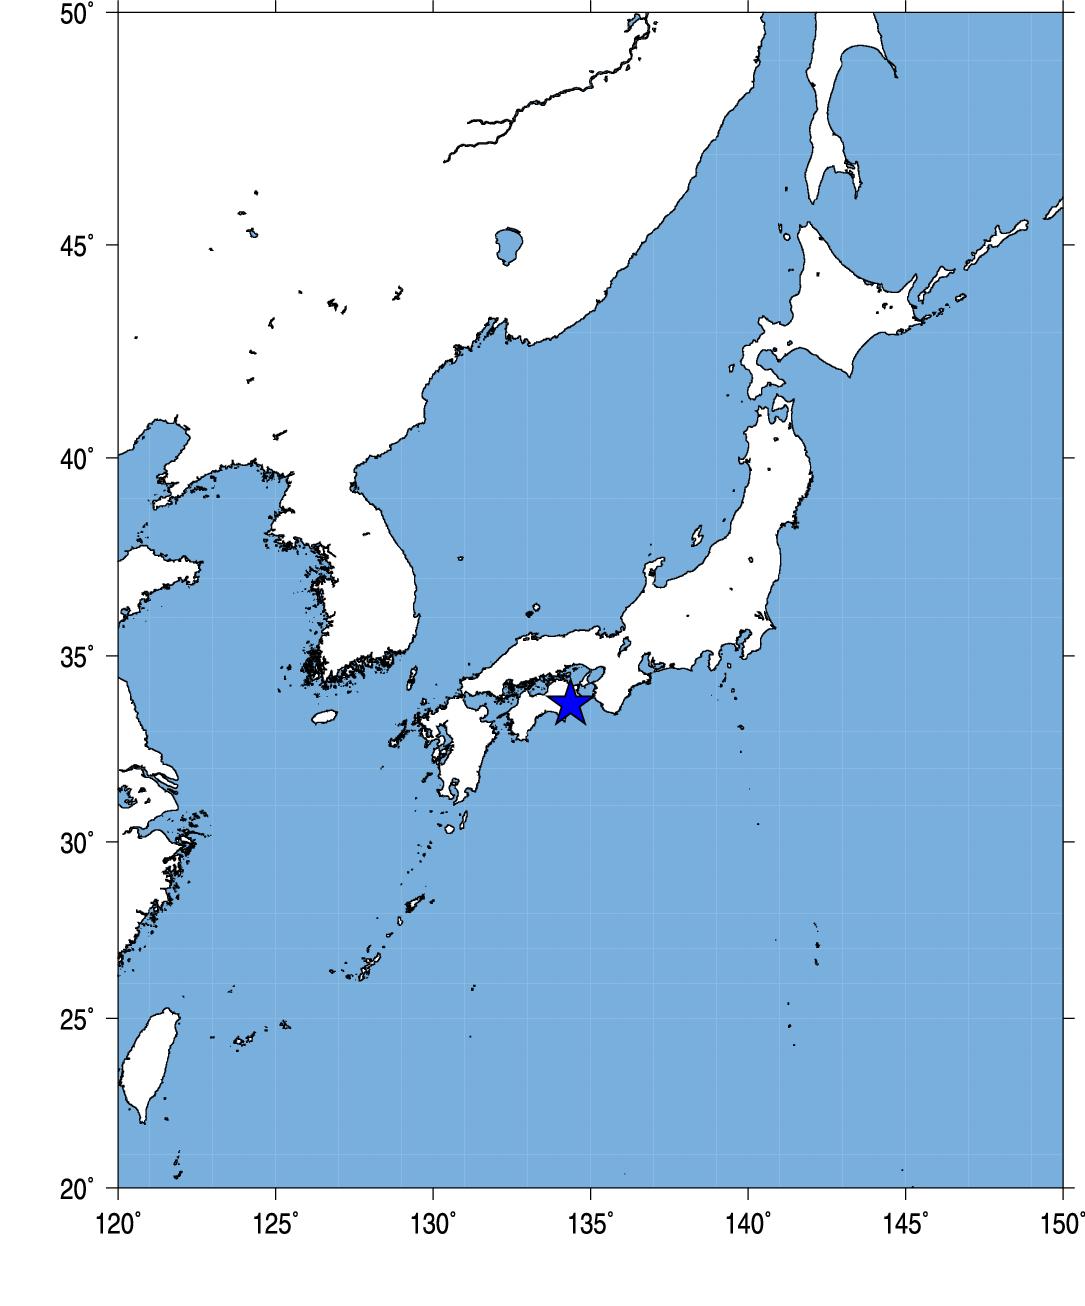
Fig.1. Event location.
2.観測点分布 (Station Distribution)
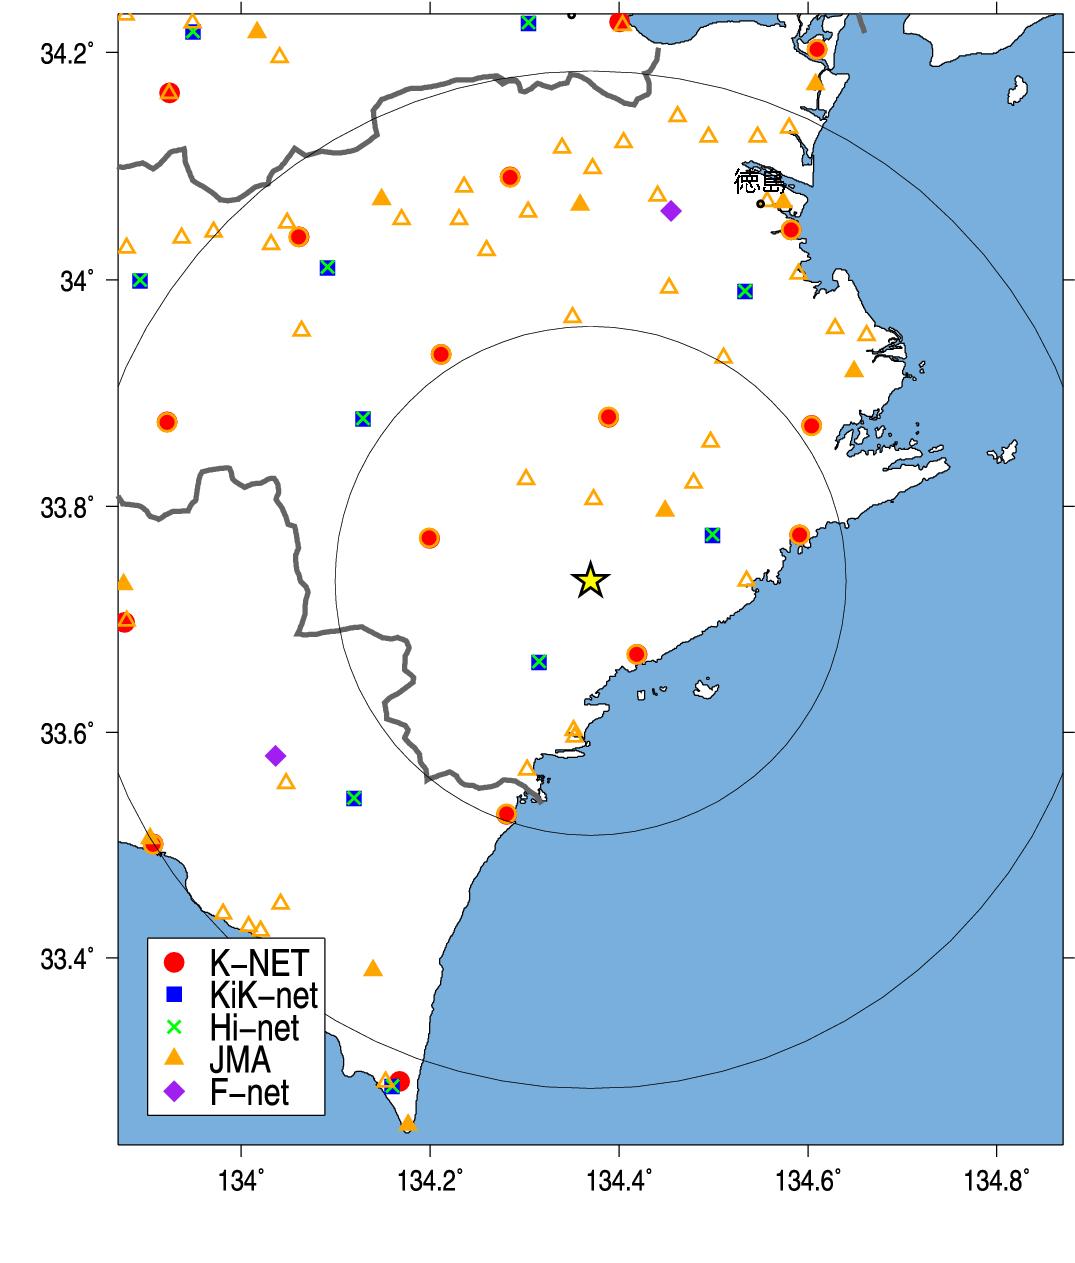
Fig.2. Station Distribution.
3.緊急地震速報発信状況 (Earthquake Early Warning Report)
-------------------------------------------------------------------[01] 15/02/06-10:25:12 03 M4.3 33.8N 134.4E 010km (15/02/06-10:25:18)
[04] 15/02/06-10:25:12 5- M5.4 33.7N 134.4E 010km (15/02/06-10:25:22)
[08] 15/02/06-10:25:12 04 M5.0 33.7N 134.4E 010km (15/02/06-10:25:32)
[09] 15/02/06-10:25:12 04 M4.9 33.7N 134.4E 010km (15/02/06-10:25:40)
[10] 15/02/06-10:25:12 04 M4.9 33.7N 134.4E 010km (15/02/06-10:25:45)
[11] 15/02/06-10:25:12 04 M4.9 33.7N 134.4E 010km (15/02/06-10:26:05)
[12] 15/02/06-10:25:12 04 M4.9 33.7N 134.4E 010km (15/02/06-10:26:10)
---------------------------------------------------------------------
(左から順に情報番号,震源時,最大予測震度,マグニチュード, 震央緯度,震央経度,震源深さ,電文発表時刻) from CEORKA
-------------------------------------------------------------------
Table2. Earthquake early warning reports. Information ID, Origin time, Maximum Intensity, JMA magnitude, Epicentral latitude, longitude, depth, and time to issue the report from the left.(ref. The Committee of Earthquake Observation and Research in the Kansai Area)
--> 気象庁による緊急地震速報の内容
4.観測記録 (Observed Records)

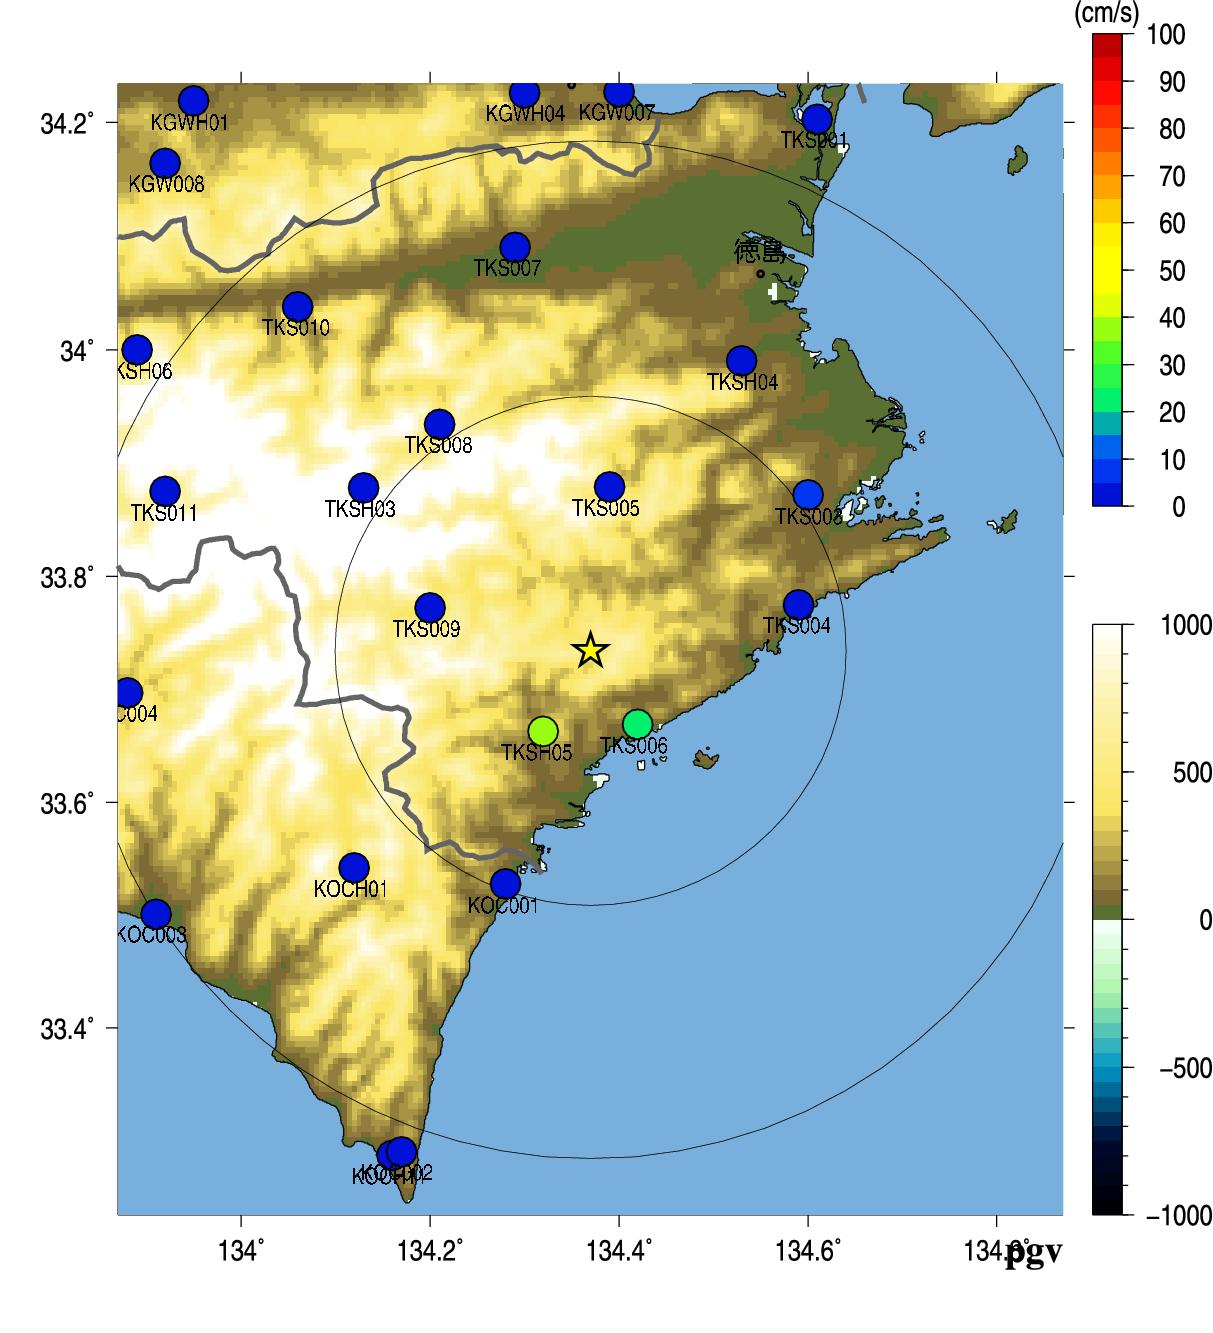
Fig.3. Peak Ground Acceleration (left) and Peak Ground Velocity (right).
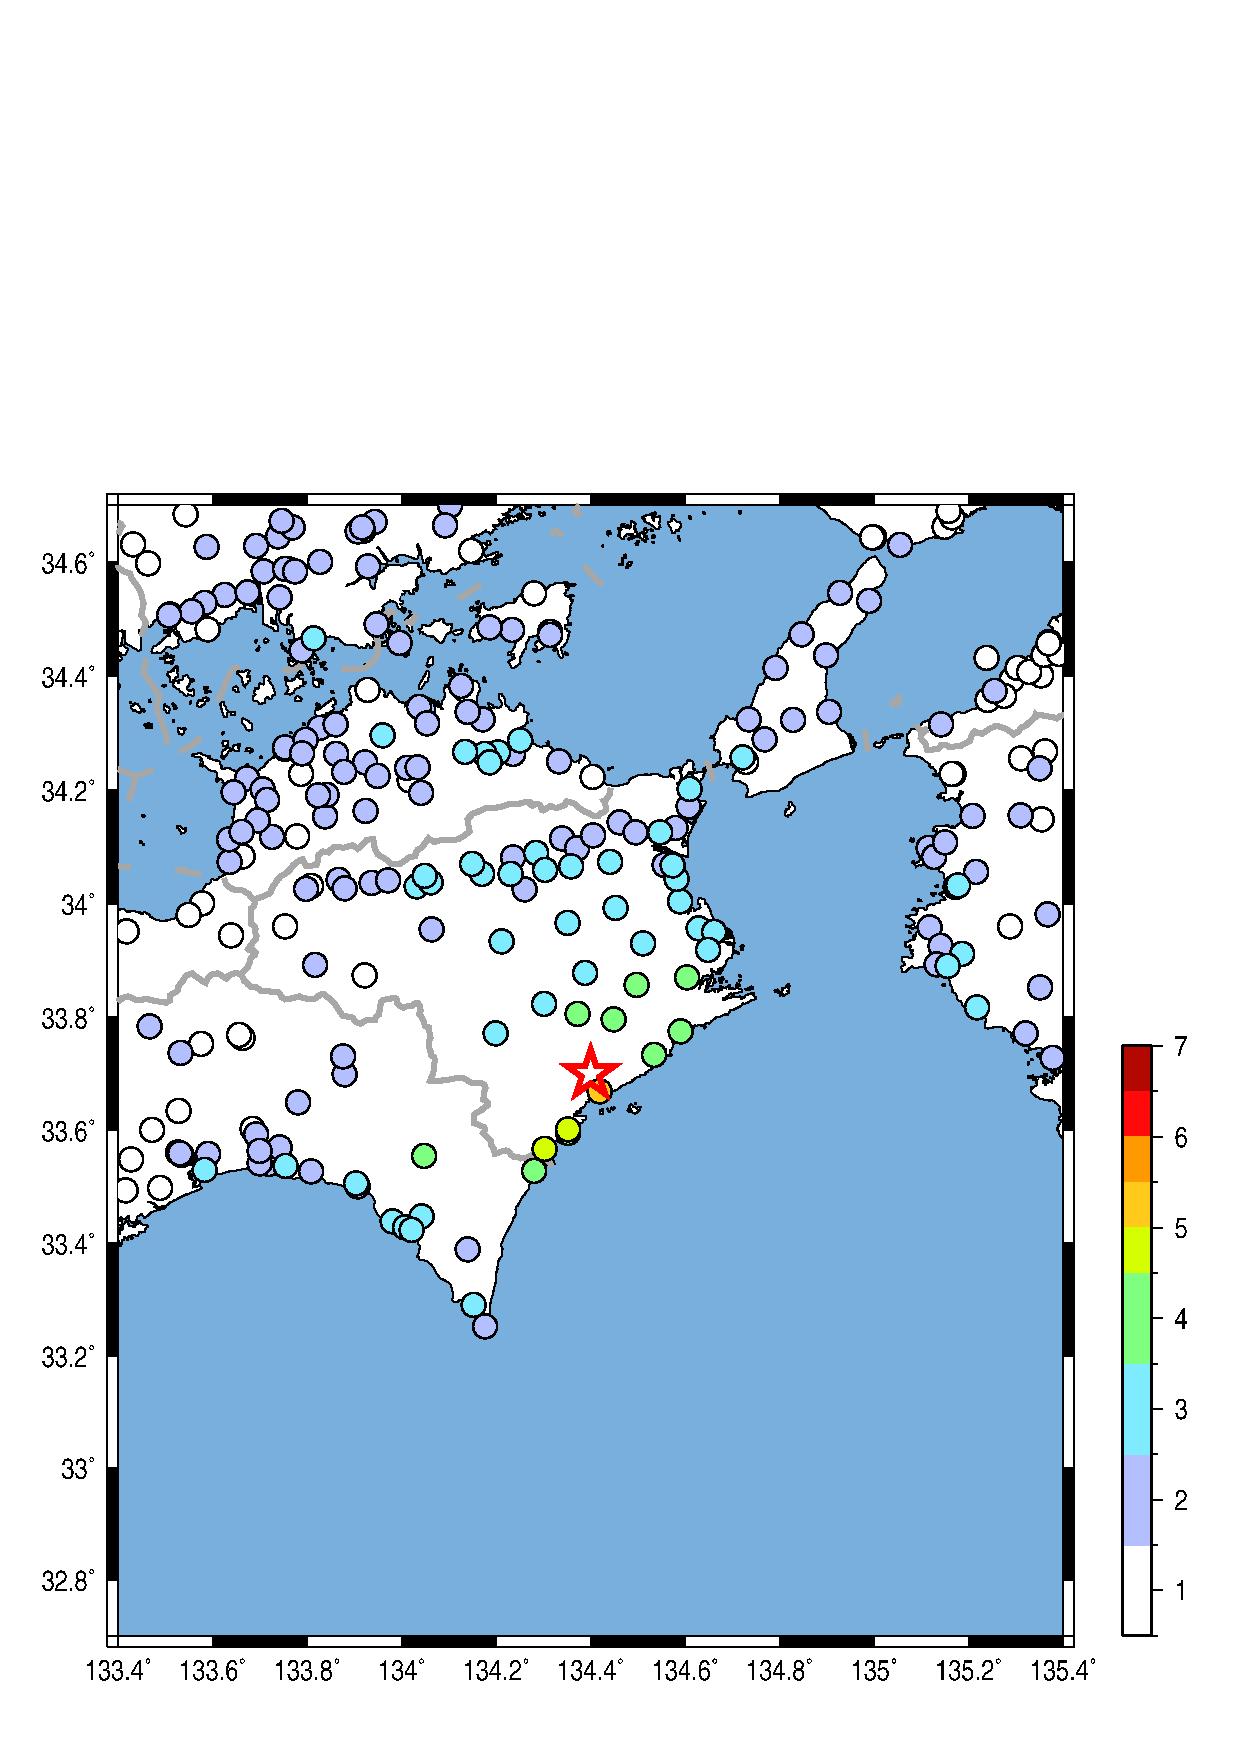
Fig.4. JMA seismic intensity.
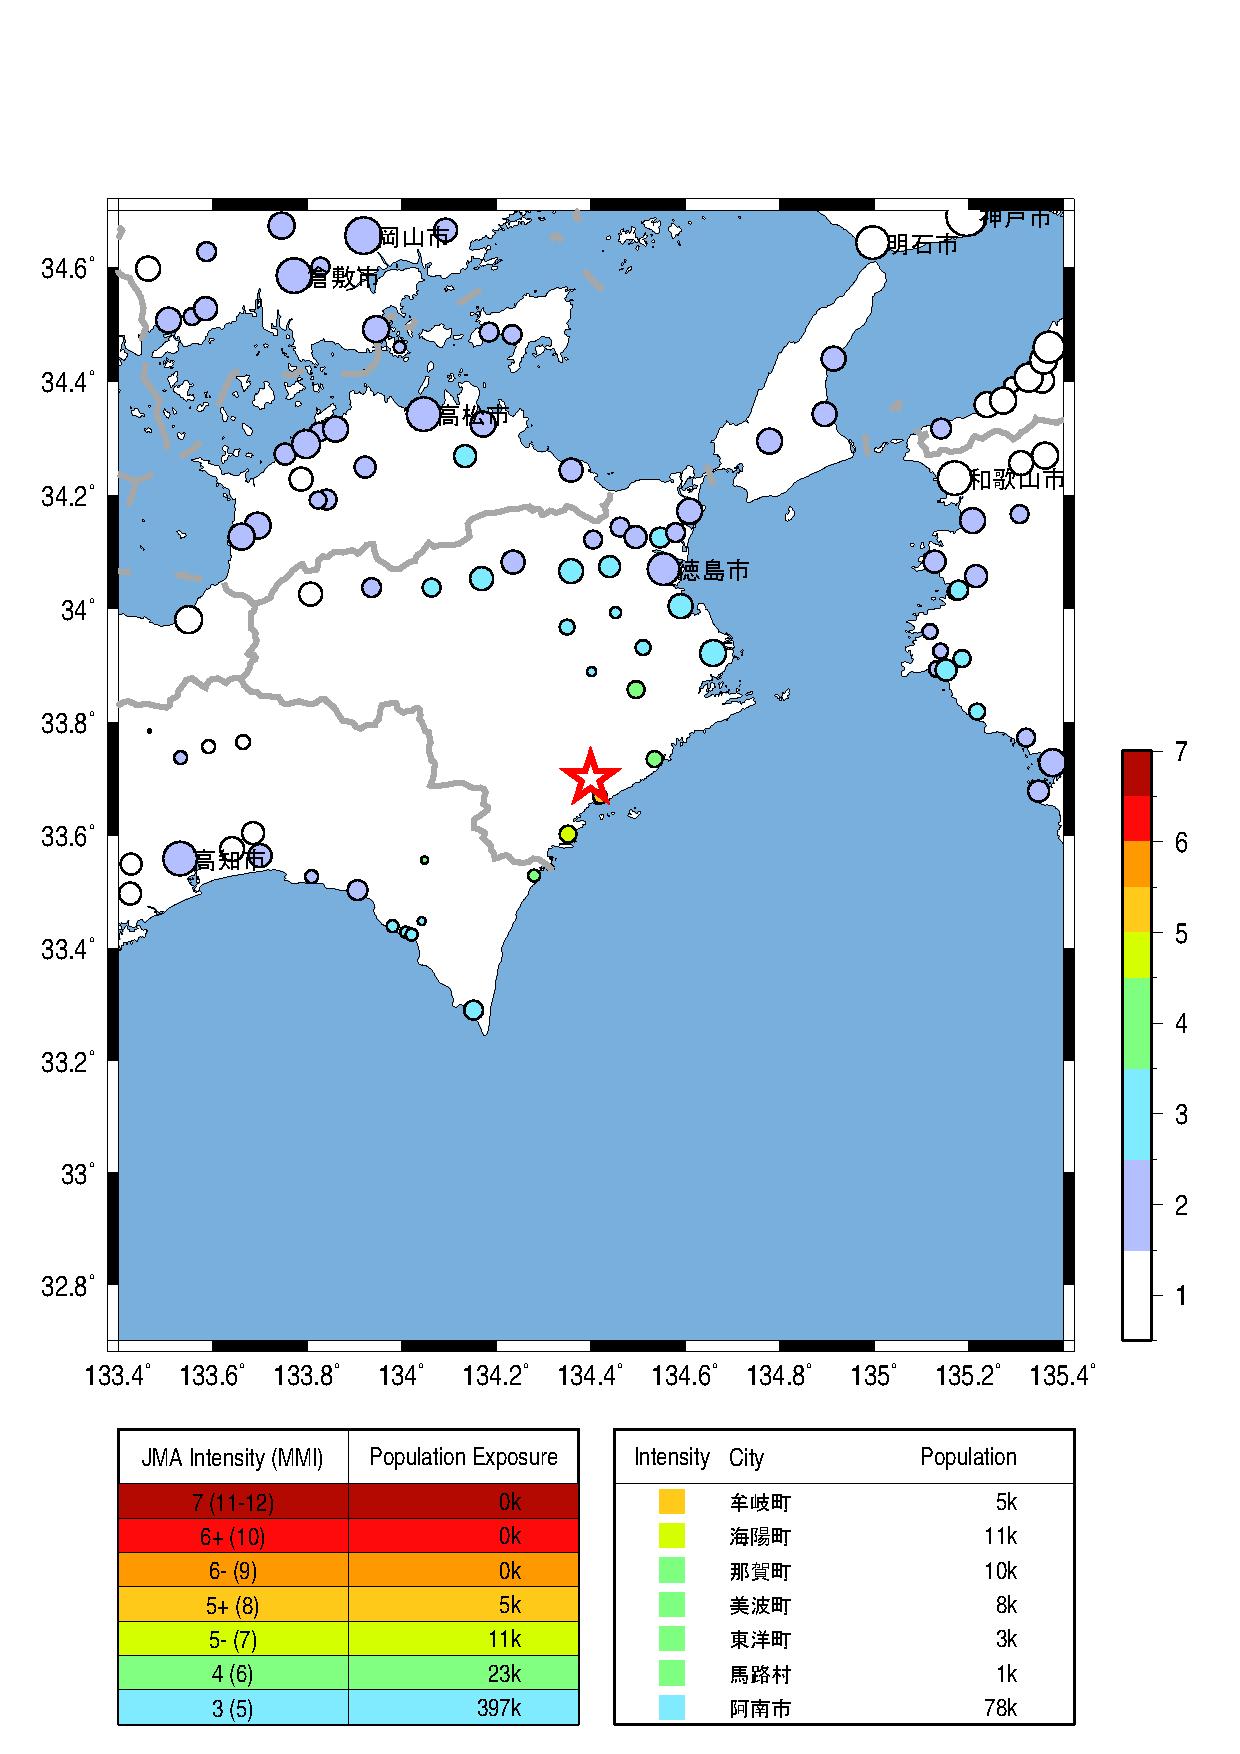
Fig.5. Population exposure. A circle size shows the population at the town, and a circle color shows the seismic intensity at the town.
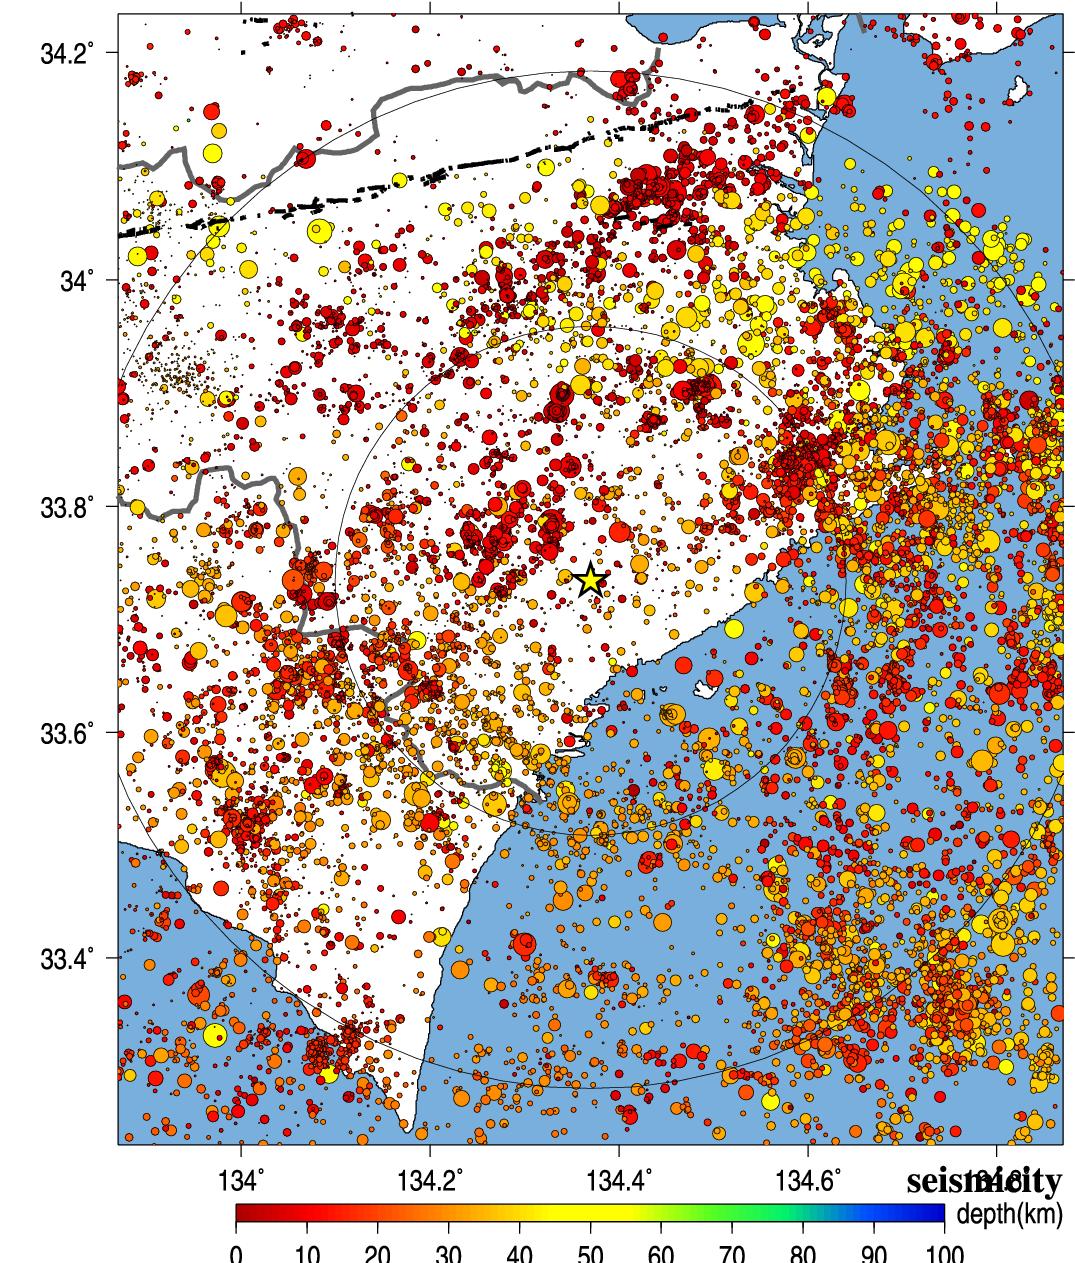
Fig.6. Seismic activity of past 40 years.
5.解析結果 (Analytical Result)
-------------------------------------------------------
TKS0061502061025 134.419 33.669 0.403 2.550 8.513 5.1 4.6
TKSH051502061025 134.316 33.663 1.239 2.600 9.370 5.1 5.7
TKS0051502061025 134.389 33.879 0.535 3.610 16.156 5.1 4.9
TKS0091502061025 134.199 33.772 0.649 3.590 16.347 5.1 5.1
TKS0041502061025 134.591 33.775 0.286 4.180 21.009 5.1 4.3
KOC0011502061025 134.281 33.528 0.492 4.850 24.335 5.1 4.8
TKS0031502061025 134.604 33.872 0.272 5.090 26.496 5.1 4.3
TKS0081502061025 134.212 33.934 0.133 5.210 26.607 5.1 3.6
TKSH031502061025 134.129 33.878 0.303 5.270 27.399 5.1 4.4
KOCH011502061025 134.120 33.542 0.335 5.810 31.500 5.1 4.5
Observed/Estimated Mw(median) tauc 5.1 4.55 0.4
-------------------------------------------------------
Table3. Analytical results using Tau_c method (Wu and Kanamori, 2005). Station ID, Station longitude, latitude, tauc, P-arrival time, epicentral distance(km) , magnitude, and estimated magnitude from the left.
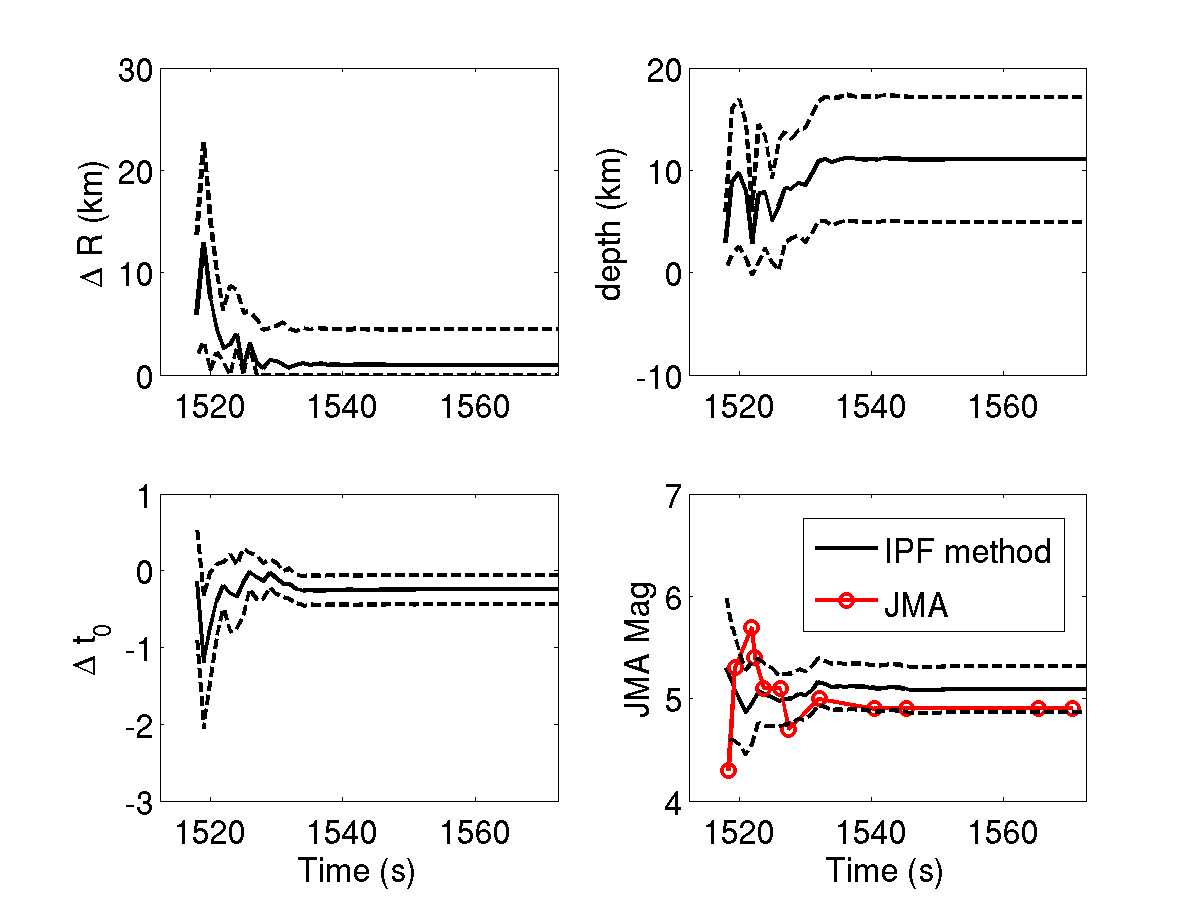
Fig.7. Time history of the estimates for source parameters by the IPF method (Wu et al., 2014). The error of epicenter, depth, error of origin time, JMA magnitude are shown. X-axis shows the time after the closest o'clocck sharp.
Wu, Y. M. and H. Kanamori (2005). Experiment on an onsite early warning method for the Taiwan early warning system, Bull. Seism. Soc. Am., 95, 347-353.
Wu, S, Yamada, M., K. Tamaribuchi, and J. Beck (2014). Multi-events Earthquake Early Warning algorithm using a Bayesian approach. Geophysical Journal International.
気象庁の震度情報、防災科学技術研究所のK-NET,KiK-netの波形、気象庁の強震波形、関西地震観測研究協議会の強震波形、一元化震源カタログをを利用しました。
緊急地震速報を発表した地震の解析結果
山田真澄 ホーム