━━━━━━━━━━━━━━━━━━━━━━━━
2013年4月13日 淡路島の地震
━━━━━━━━━━━━━━━━━━━━━━━━
1.地震について (Earthquake Information)
----------------------------------------------------
2013/04/13,05:33:17.833 34.4218 134.8279 14.6 6.3
----------------------------------------------------
Table1. Earthquake information. Origin time, Epicentral latitude, longitude, depth, and JMA magnitude from the left.(ref. Hi-net and JMA source mechanisms)
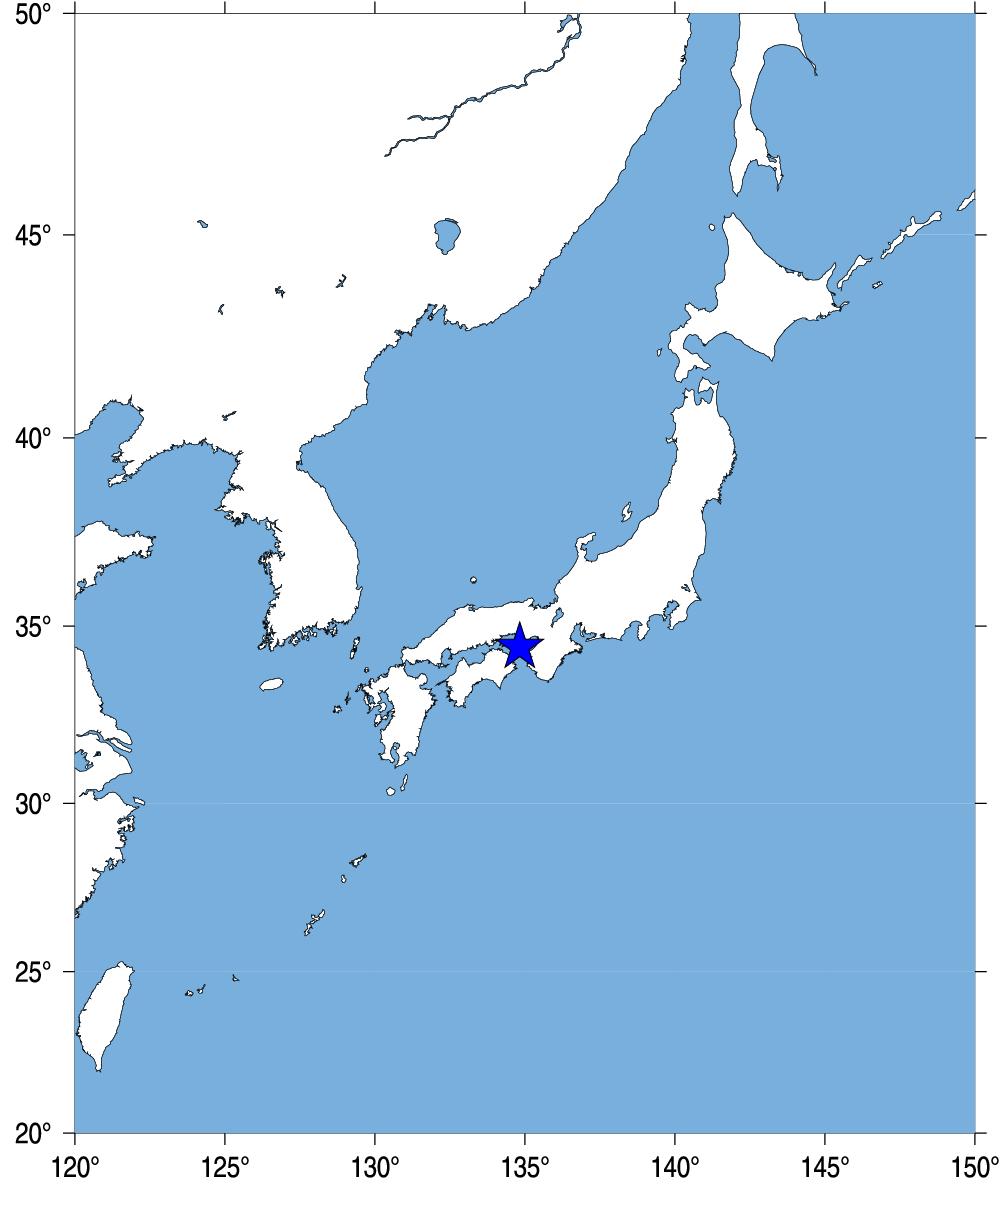
Fig.1. Event location.
2.観測点分布 (Station Distribution)
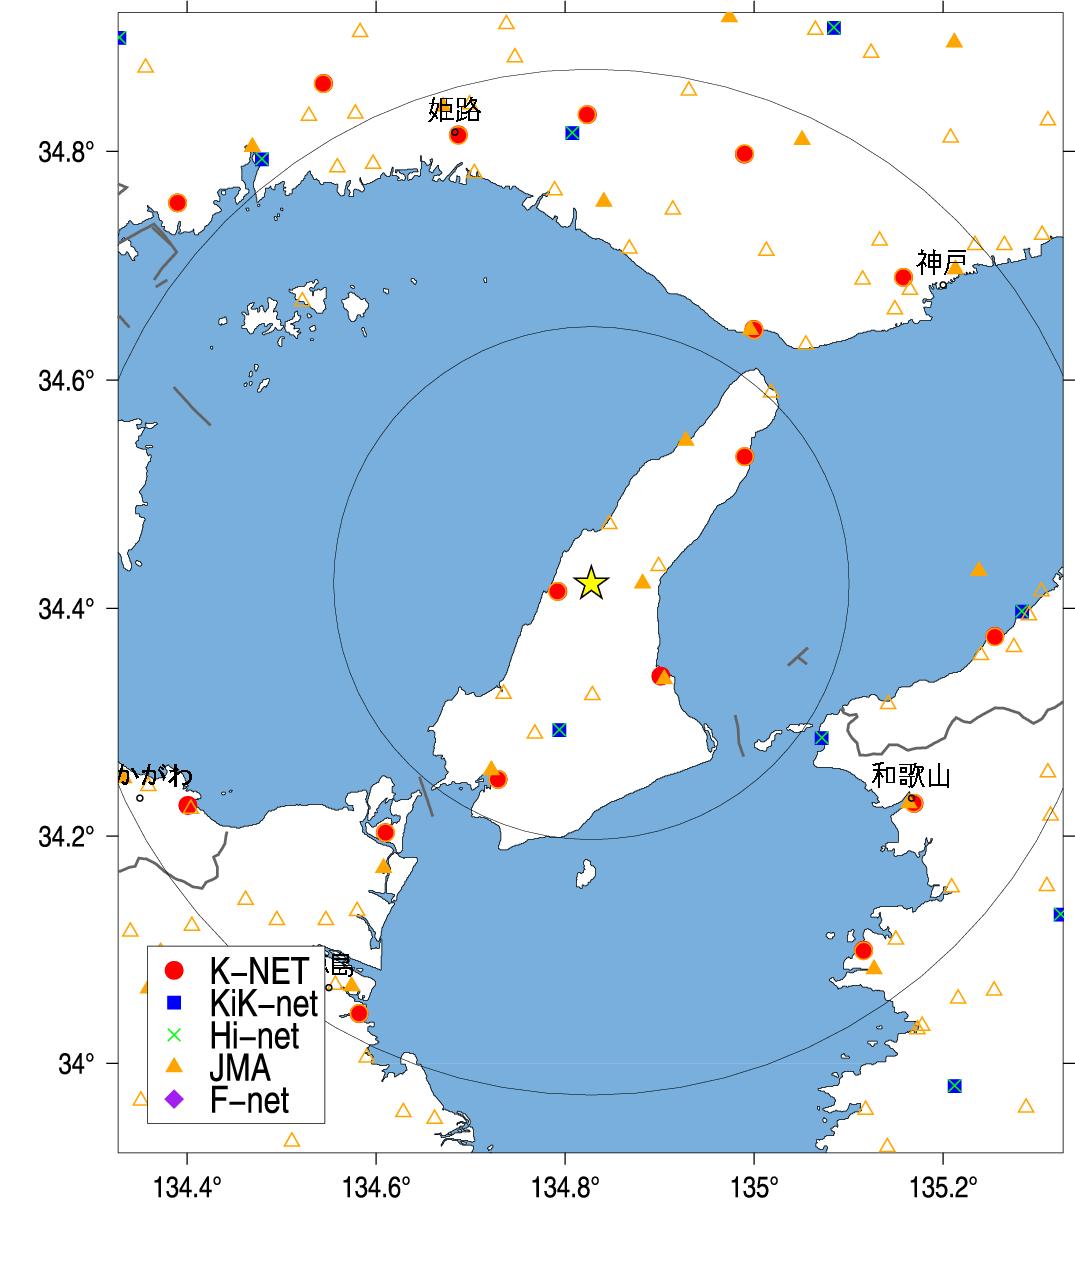
Fig.2. Station Distribution.
3.緊急地震速報発信状況 (Earthquake Early Warning Report)
-------------------------------------------------------------------[01] 13/04/13-05:33:18 5- M5.9 34.5N 134.8E 010km (13/04/13-05:33:23)
[04] 13/04/13-05:33:16 6- M6.7 34.4N 134.7E 010km (13/04/13-05:33:28)
[08] 13/04/13-05:33:18 5+ M6.1 34.4N 134.8E 010km (13/04/13-05:33:43)
[09] 13/04/13-05:33:18 6- M6.2 34.4N 134.8E 010km (13/04/13-05:33:50)
[10] 13/04/13-05:33:18 6- M6.2 34.4N 134.8E 010km (13/04/13-05:34:10)
[11] 13/04/13-05:33:18 6- M6.2 34.4N 134.8E 010km (13/04/13-05:34:16)
---------------------------------------------------------------------
(左から順に情報番号,震源時,最大予測震度,マグニチュード, 震央緯度,震央経度,震源深さ,電文発表時刻) from CEORKA
-------------------------------------------------------------------
Table2. Earthquake early warning reports. Information ID, Origin time, Maximum Intensity, JMA magnitude, Epicentral latitude, longitude, depth, and time to issue the report from the left.(ref. The Committee of Earthquake Observation and Research in the Kansai Area)
--> 気象庁による緊急地震速報の内容
4.解析結果 (Analytical Result)
-------------------------------------------------------
HYG0252013041305 134.901 34.340 0.891 3.107 11.271 6.3 5.4
HYG0272013041305 134.729 34.250 2.271 4.667 21.121 6.3 6.2
HYG0232013041305 135.000 34.644 1.008 5.567 29.311 6.3 5.5
TKS0012013041305 134.610 34.203 0.887 6.177 31.497 6.3 5.4
WKY0012013041305 135.169 34.229 1.866 6.727 38.028 6.3 6.1
OSK0102013041305 135.255 34.375 0.814 7.217 39.598 6.3 5.3
HYG0212013041305 135.158 34.690 1.289 7.687 42.467 6.3 5.7
HYG0202013041305 134.990 34.798 0.942 7.907 44.258 6.3 5.4
WKY0032013041305 135.116 34.100 1.026 7.907 44.514 6.3 5.5
KGW0072013041305 134.401 34.227 0.953 7.917 44.842 6.3 5.4
Observed/Estimated Mw(median) tauc 6.3 5.45 1.0
-------------------------------------------------------
Table3. Analytical results using Tau_c method (Wu and Kanamori, 2005). Station ID, Station longitude, latitude, tauc, P-arrival time, epicentral distance(km) , magnitude, and estimated magnitude from the left.
5.観測記録 (Observed Records)
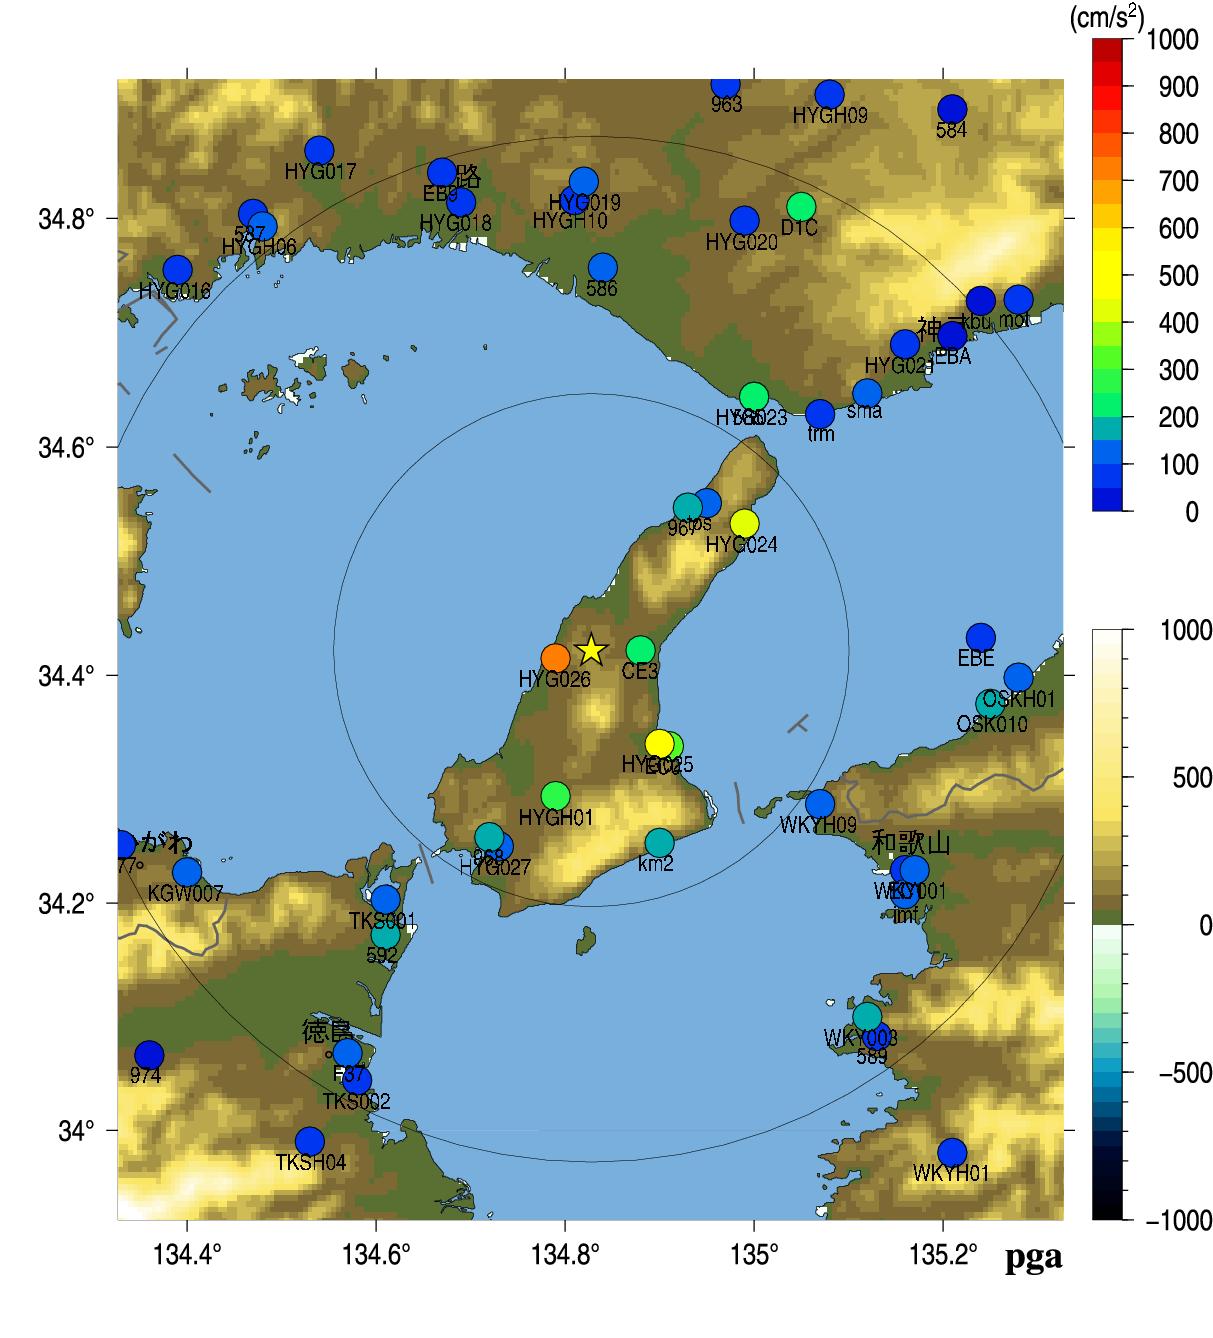
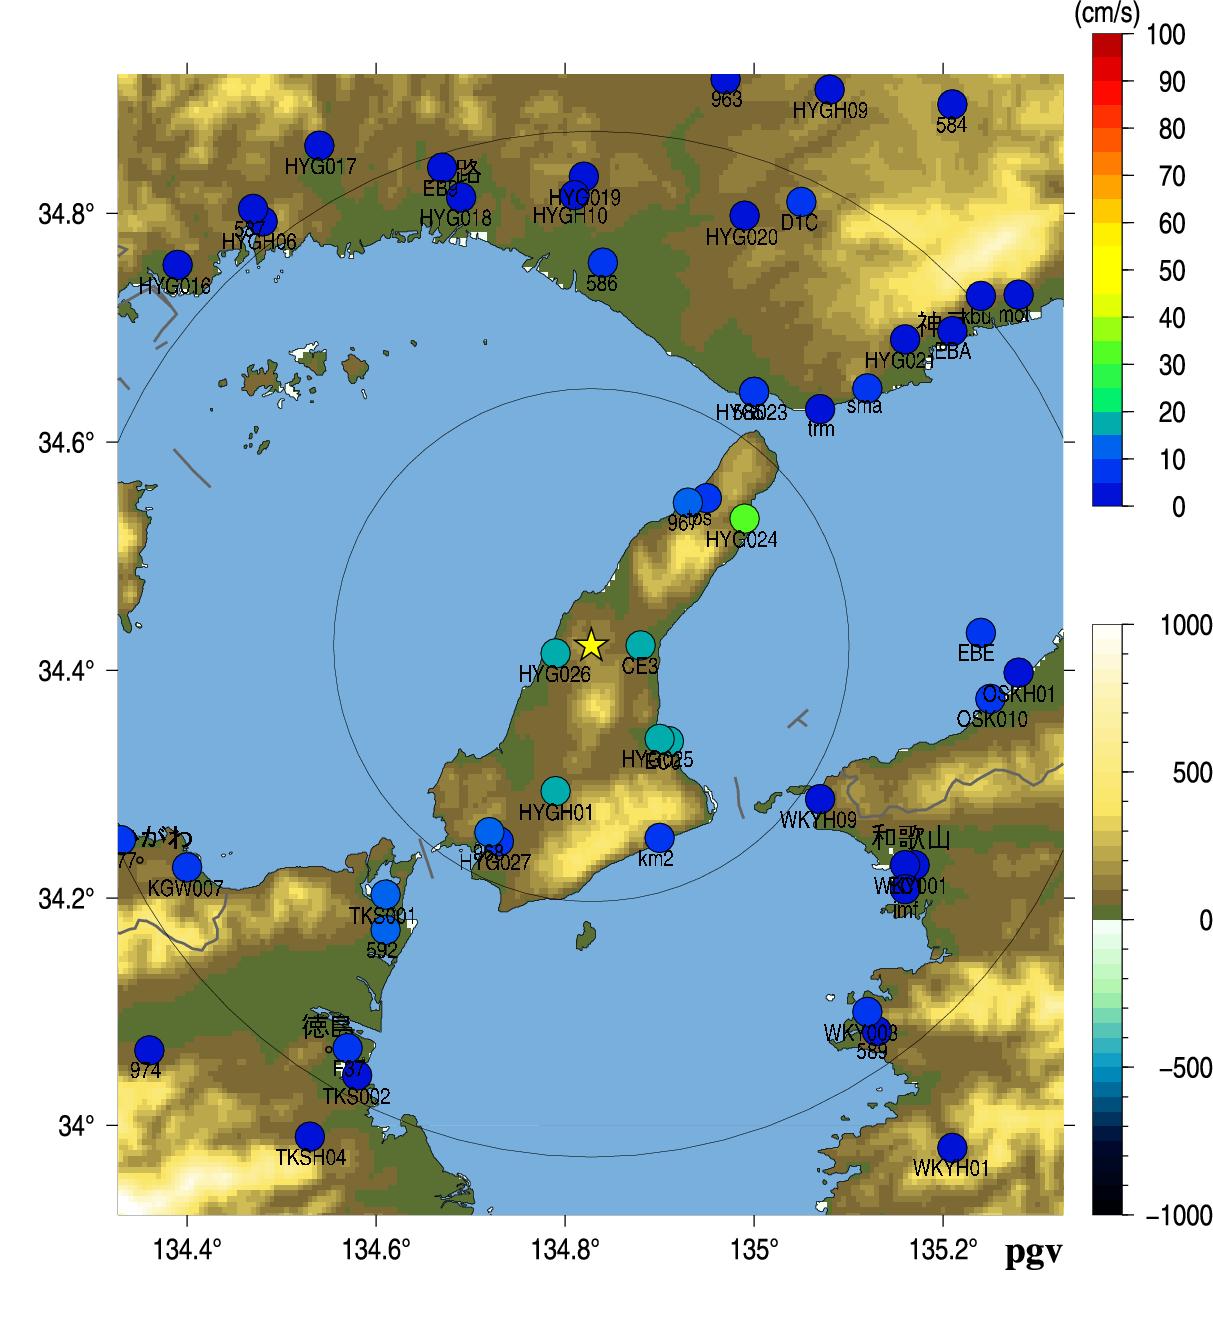
Fig.3. Peak Ground Acceleration (left) and Peak Ground Velocity (right).
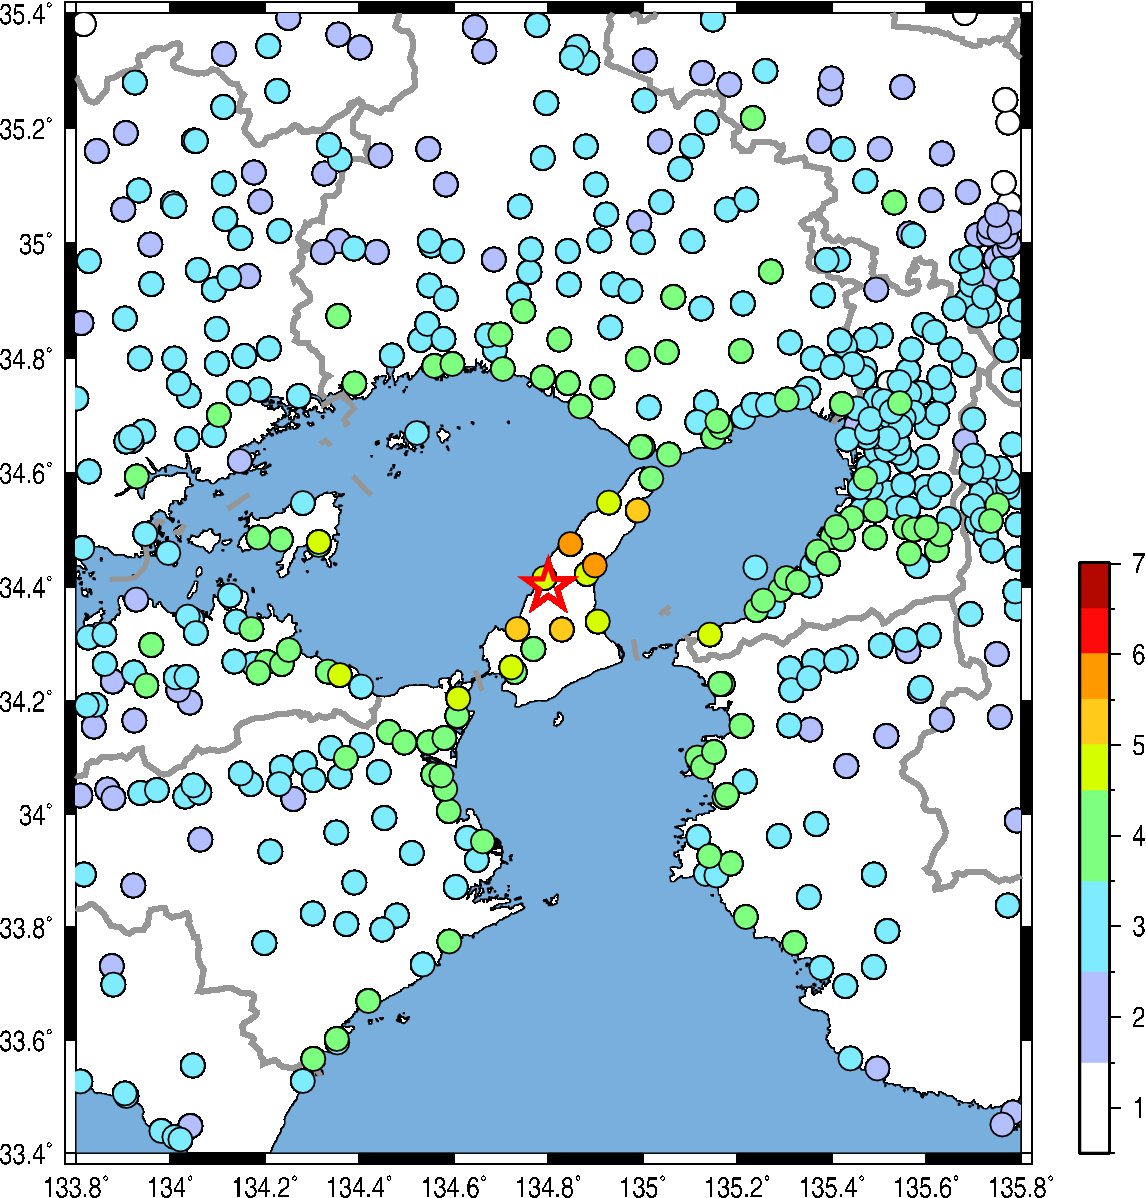
Fig.4. JMA seismic intensity.
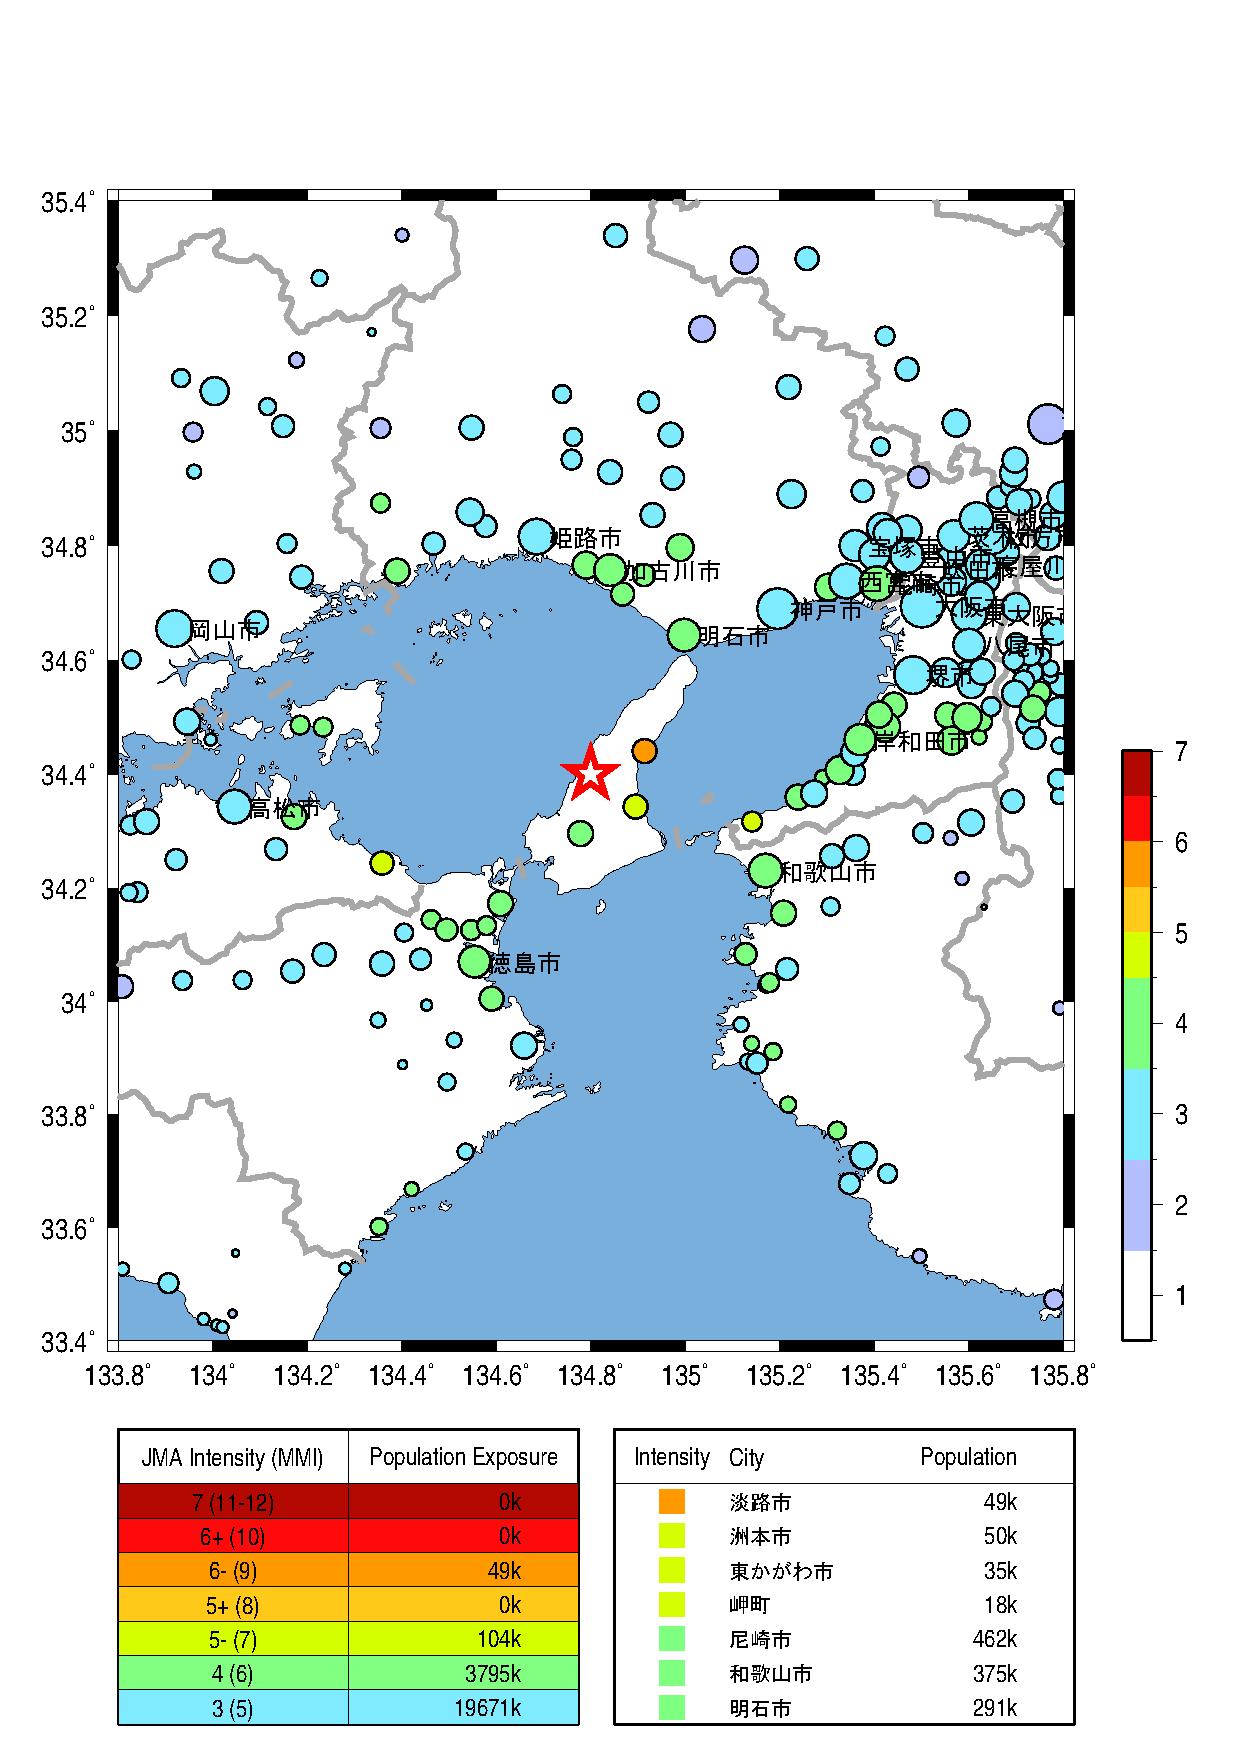
Fig.5. Population exposure. A circle size shows the population at the town, and a circle color shows the seismic intensity at the town.
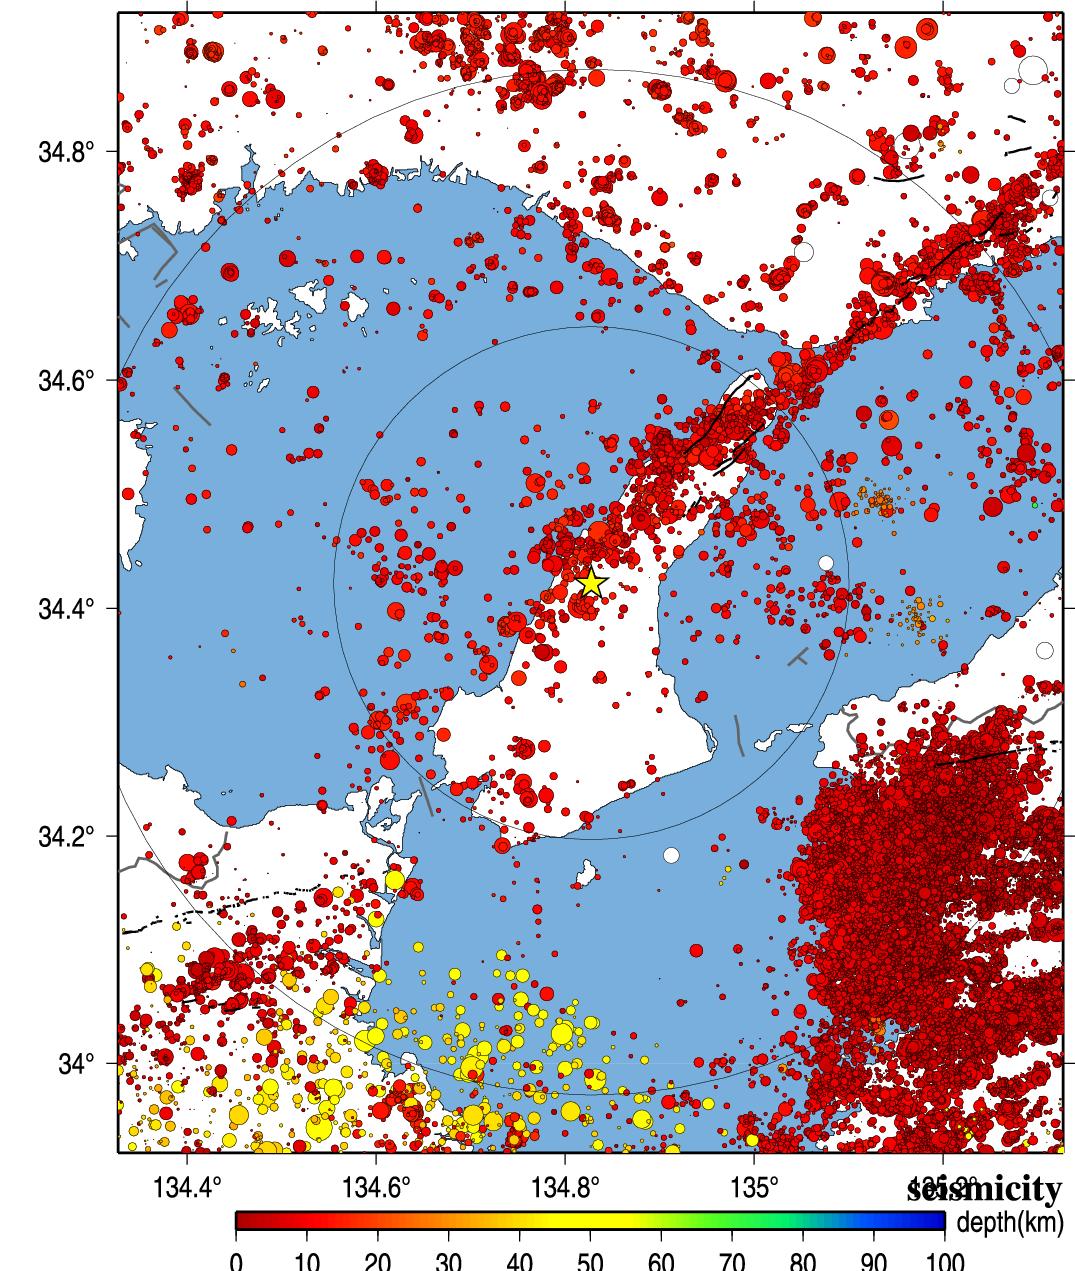
Fig.6. Seismic activity of past 40 years.
Wu, Y. M. and H. Kanamori (2005). Experiment on an onsite early warning method for the Taiwan early warning system, Bull. Seism. Soc. Am., 95, 347-353.
気象庁の震度情報、防災科学技術研究所のK-NET,KiK-netの波形、気象庁の強震波形、関西地震観測研究協議会の強震波形、一元化震源カタログをを利用しました。
緊急地震速報を発表した地震の解析結果
山田真澄 ホーム