━━━━━━━━━━━━━━━━━━━━━━━━
2013年2月25日 栃木県北部の地震
━━━━━━━━━━━━━━━━━━━━━━━━
1.地震について (Earthquake Information)
----------------------------------------------------
2013/02/25,16:23:53.738 36.8731 139.4069 2.1 6.2
----------------------------------------------------
Table1. Earthquake information. Origin time, Epicentral latitude, longitude, depth, and JMA magnitude from the left.(ref. Hi-net and JMA source mechanisms)
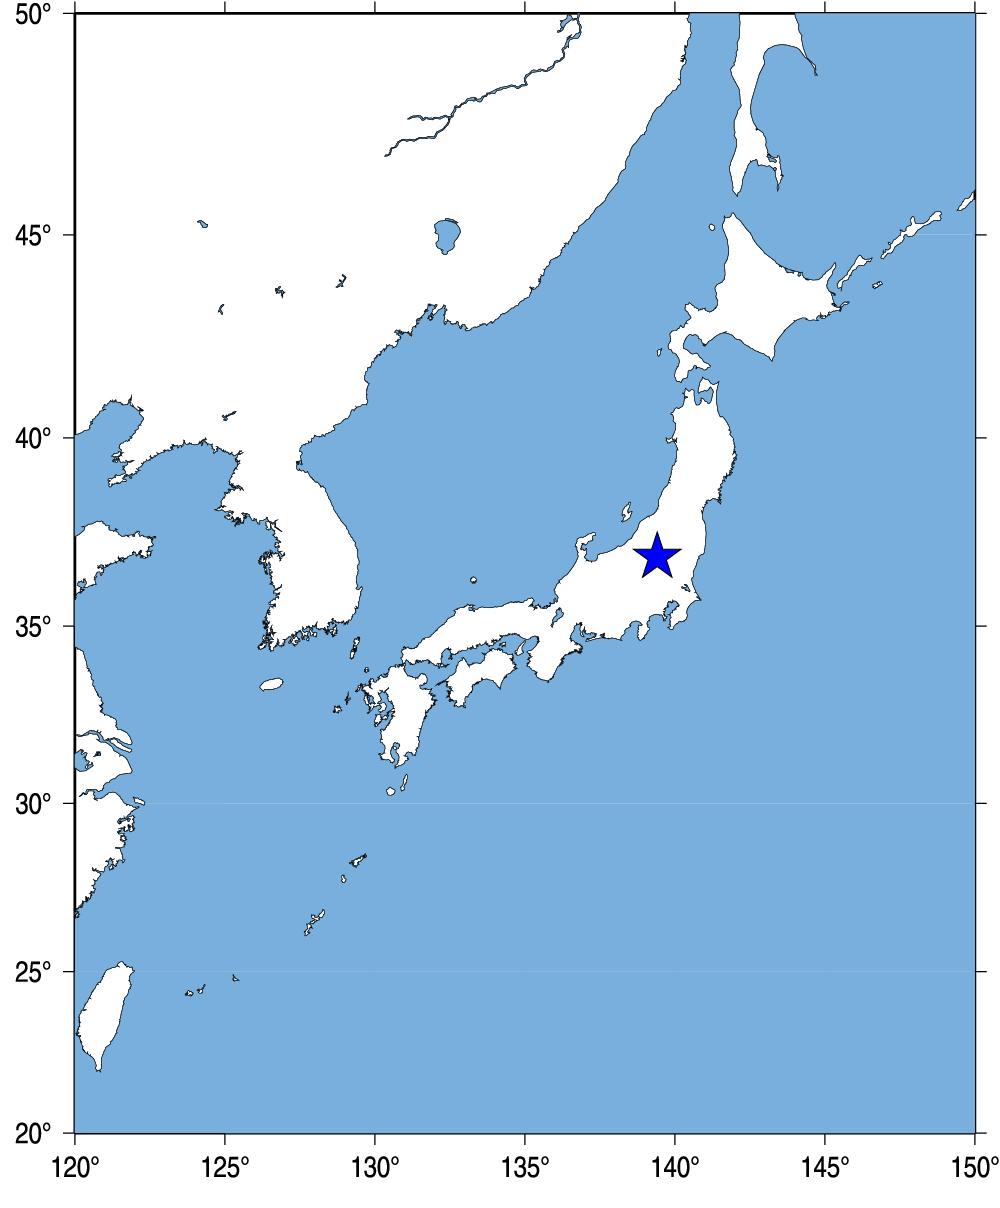
Fig.1. Event location.
2.観測点分布 (Station Distribution)
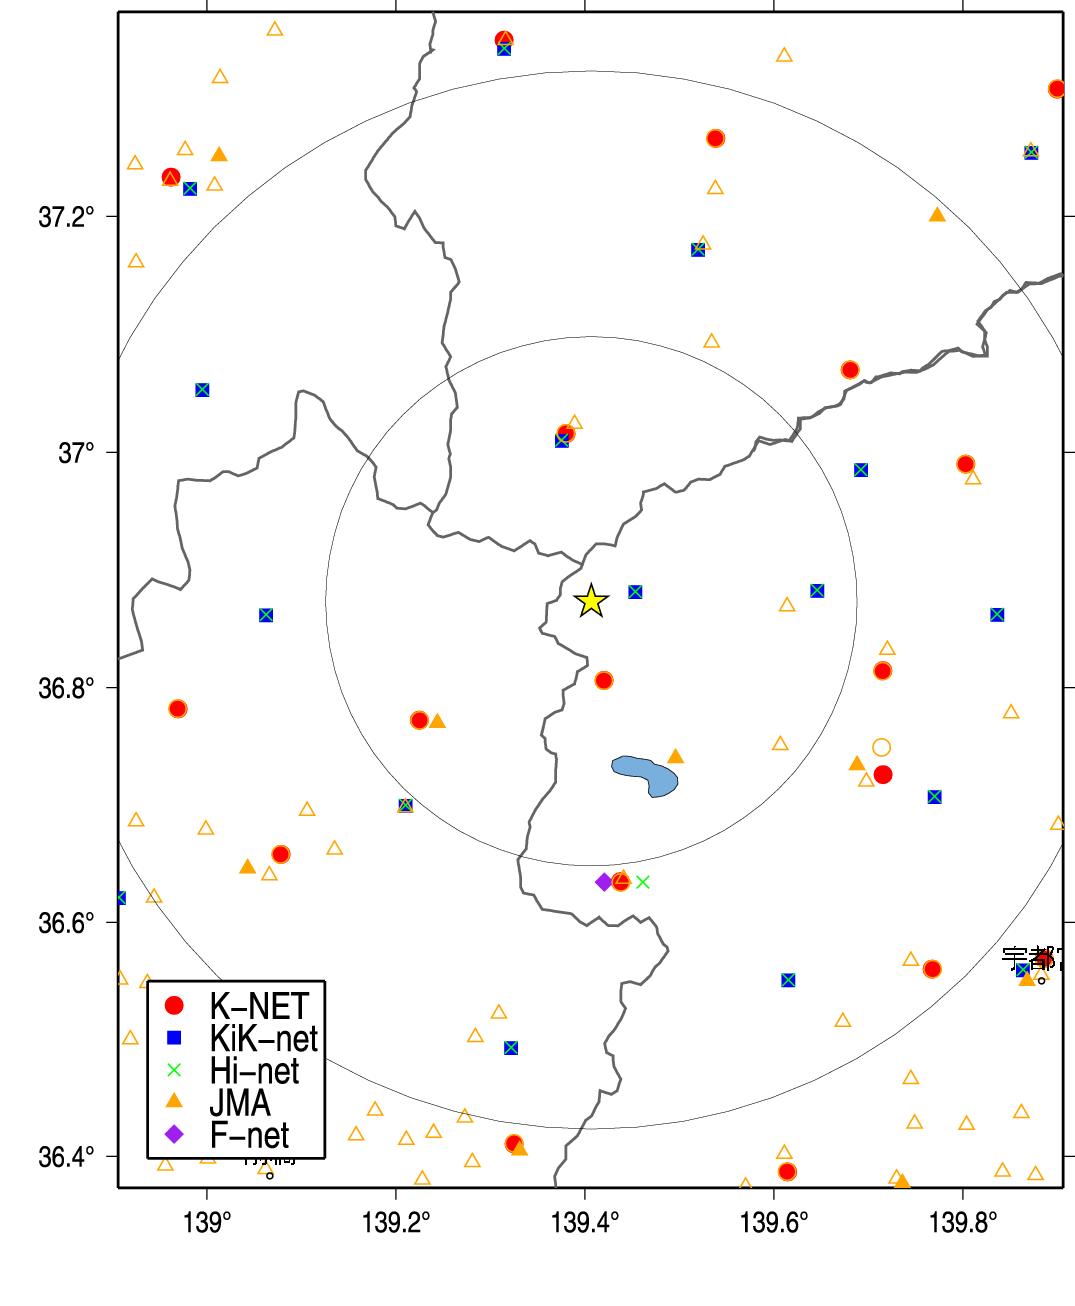
Fig.2. Station Distribution.
3.緊急地震速報発信状況 (Earthquake Early Warning Report)
-------------------------------------------------------------------[01] 13/02/25-16:23:55 5- M5.6 36.8N 139.2E 010km (13/02/25-16:24:02)
[03] 13/02/25-16:23:53 5+ M6.3 36.9N 139.4E 010km (13/02/25-16:24:06)
[04] 13/02/25-16:23:53 5+ M6.4 36.9N 139.4E 010km (13/02/25-16:24:08)
[05] 13/02/25-16:23:53 6- M6.7 36.9N 139.4E 010km (13/02/25-16:24:12)
[06] 13/02/25-16:23:53 5+ M6.3 36.9N 139.4E 010km (13/02/25-16:24:17)
[07] 13/02/25-16:23:53 5+ M6.3 36.9N 139.4E 010km (13/02/25-16:24:27)
[08] 13/02/25-16:23:53 5+ M6.3 36.9N 139.4E 010km (13/02/25-16:24:47)
[09] 13/02/25-16:23:53 5+ M6.3 36.9N 139.4E 010km (13/02/25-16:24:50)
---------------------------------------------------------------------
(左から順に情報番号,震源時,最大予測震度,マグニチュード, 震央緯度,震央経度,震源深さ,電文発表時刻) from CEORKA
-------------------------------------------------------------------
Table2. Earthquake early warning reports. Information ID, Origin time, Maximum Intensity, JMA magnitude, Epicentral latitude, longitude, depth, and time to issue the report from the left.(ref. The Committee of Earthquake Observation and Research in the Kansai Area)
--> 気象庁による緊急地震速報の内容
4.解析結果 (Analytical Result)
-------------------------------------------------------
TCGH071302251623 139.453 36.882 1.371 0.832 4.254 6.2 5.8
TCG0041302251623 139.420 36.806 1.339 1.542 7.532 6.2 5.7
FKSH071302251623 139.376 37.010 1.264 2.882 15.481 6.2 5.7
FKS0291302251623 139.380 37.016 1.038 2.932 16.026 6.2 5.5
GNM0011302251623 139.225 36.772 0.769 3.752 19.732 6.2 5.2
TCGH081302251623 139.646 36.883 1.721 3.842 21.335 6.2 6.0
GNMH071302251623 139.210 36.700 2.686 4.912 26.029 6.2 6.4
TCG0101302251623 139.438 36.635 0.987 4.742 26.598 6.2 5.5
TCG0031302251623 139.715 36.814 2.744 5.012 28.268 6.2 6.4
TCGH171302251623 139.692 36.985 2.226 5.072 28.304 6.2 6.2
Observed/Estimated Mw(median) tauc 6.2 5.75 1.4
-------------------------------------------------------
Table3. Analytical results using Tau_c method (Wu and Kanamori, 2005). Station ID, Station longitude, latitude, tauc, P-arrival time, epicentral distance(km) , magnitude, and estimated magnitude from the left.
5.観測記録 (Observed Records)
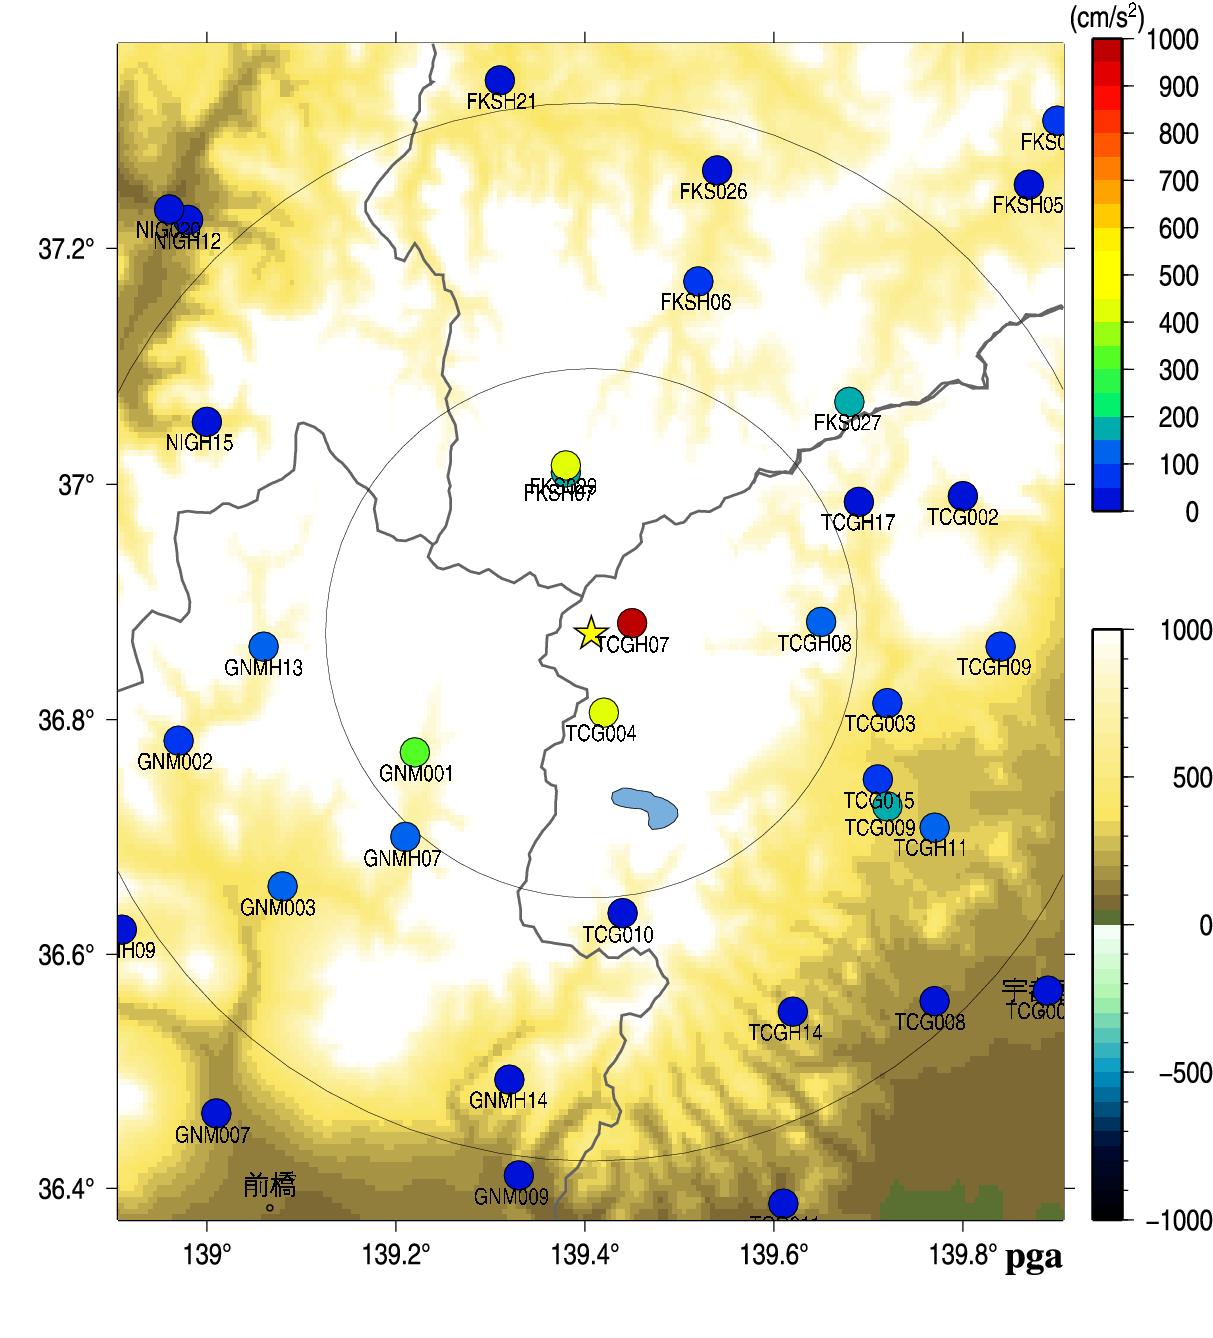
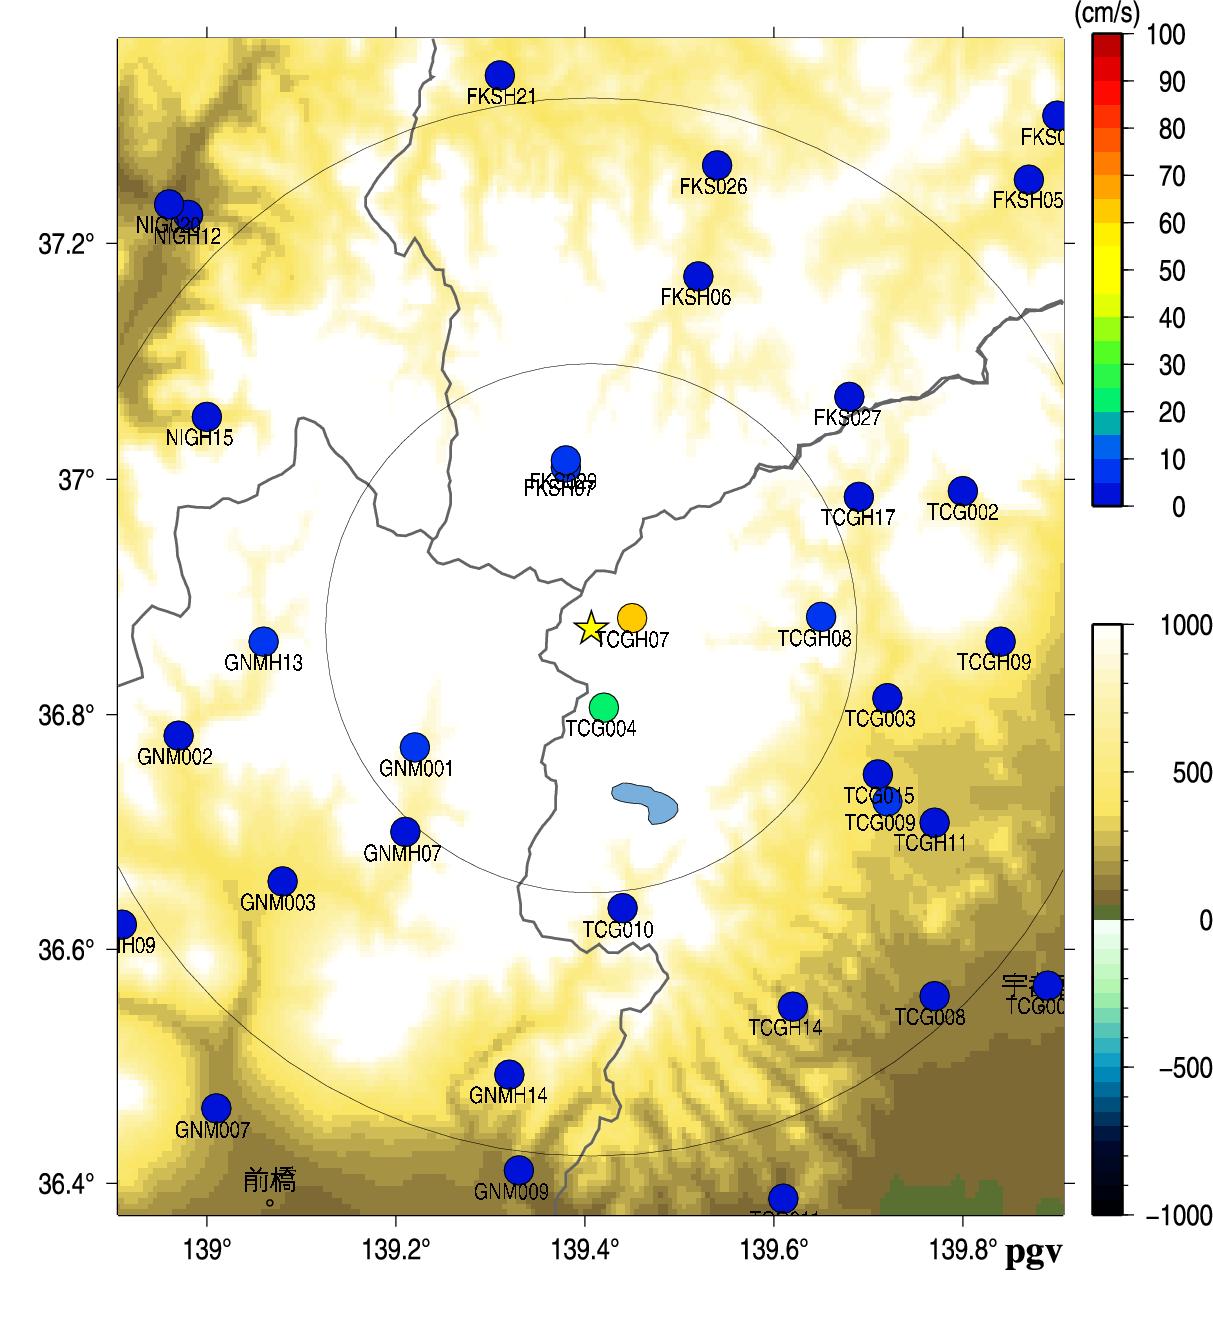
Fig.3. Peak Ground Acceleration (left) and Peak Ground Velocity (right).
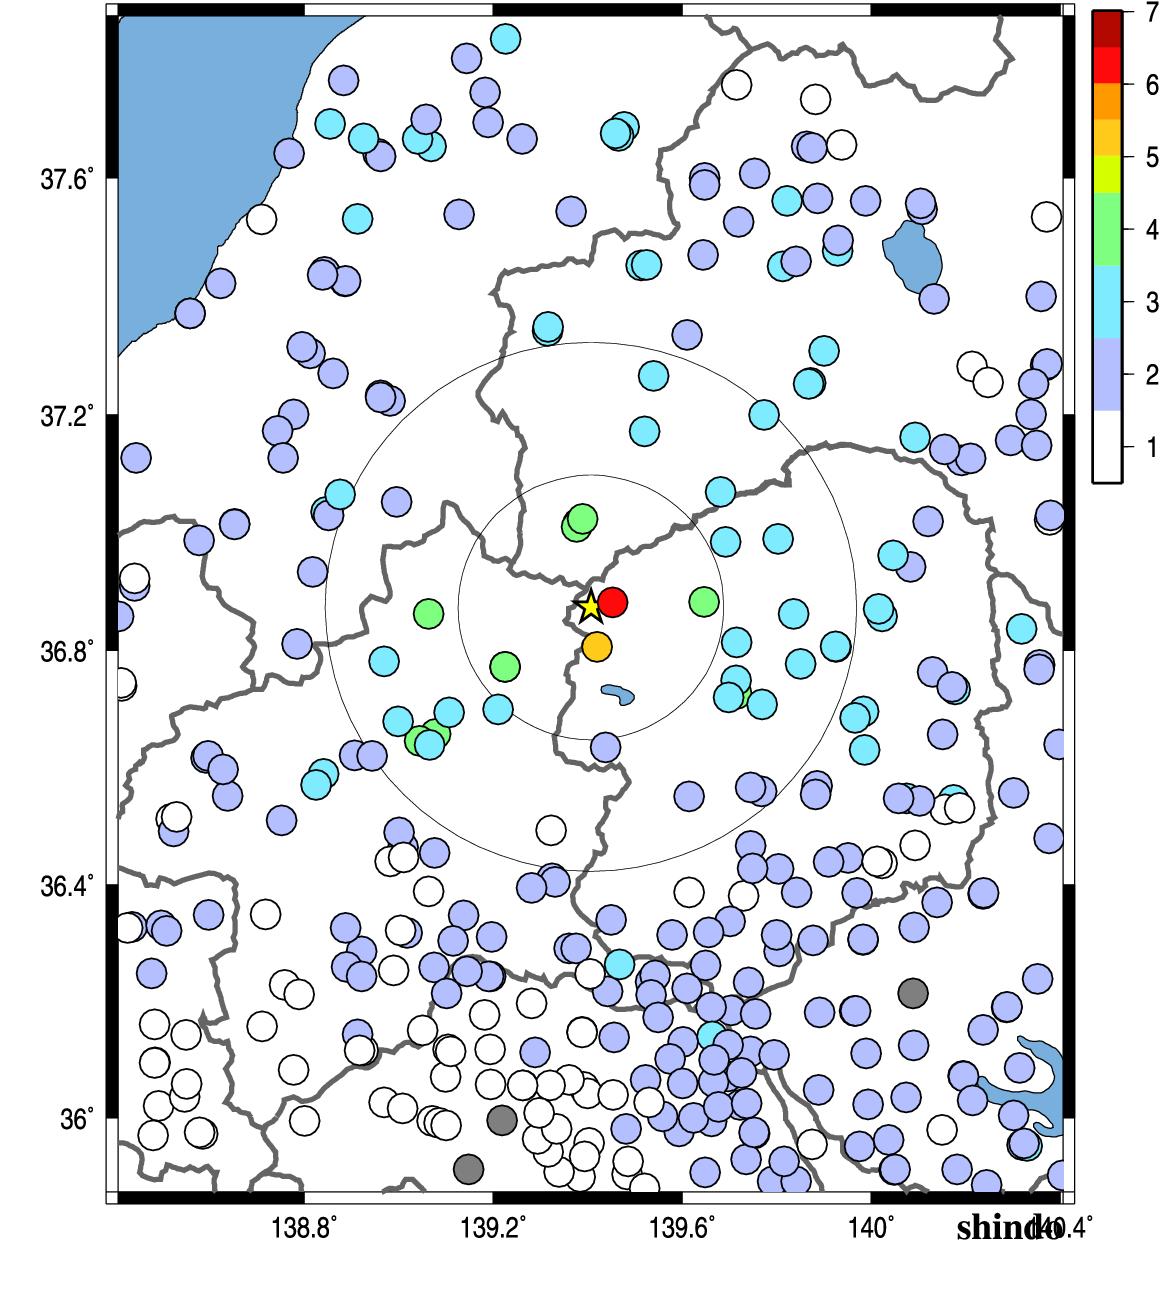
Fig.4. JMA seismic intensity.
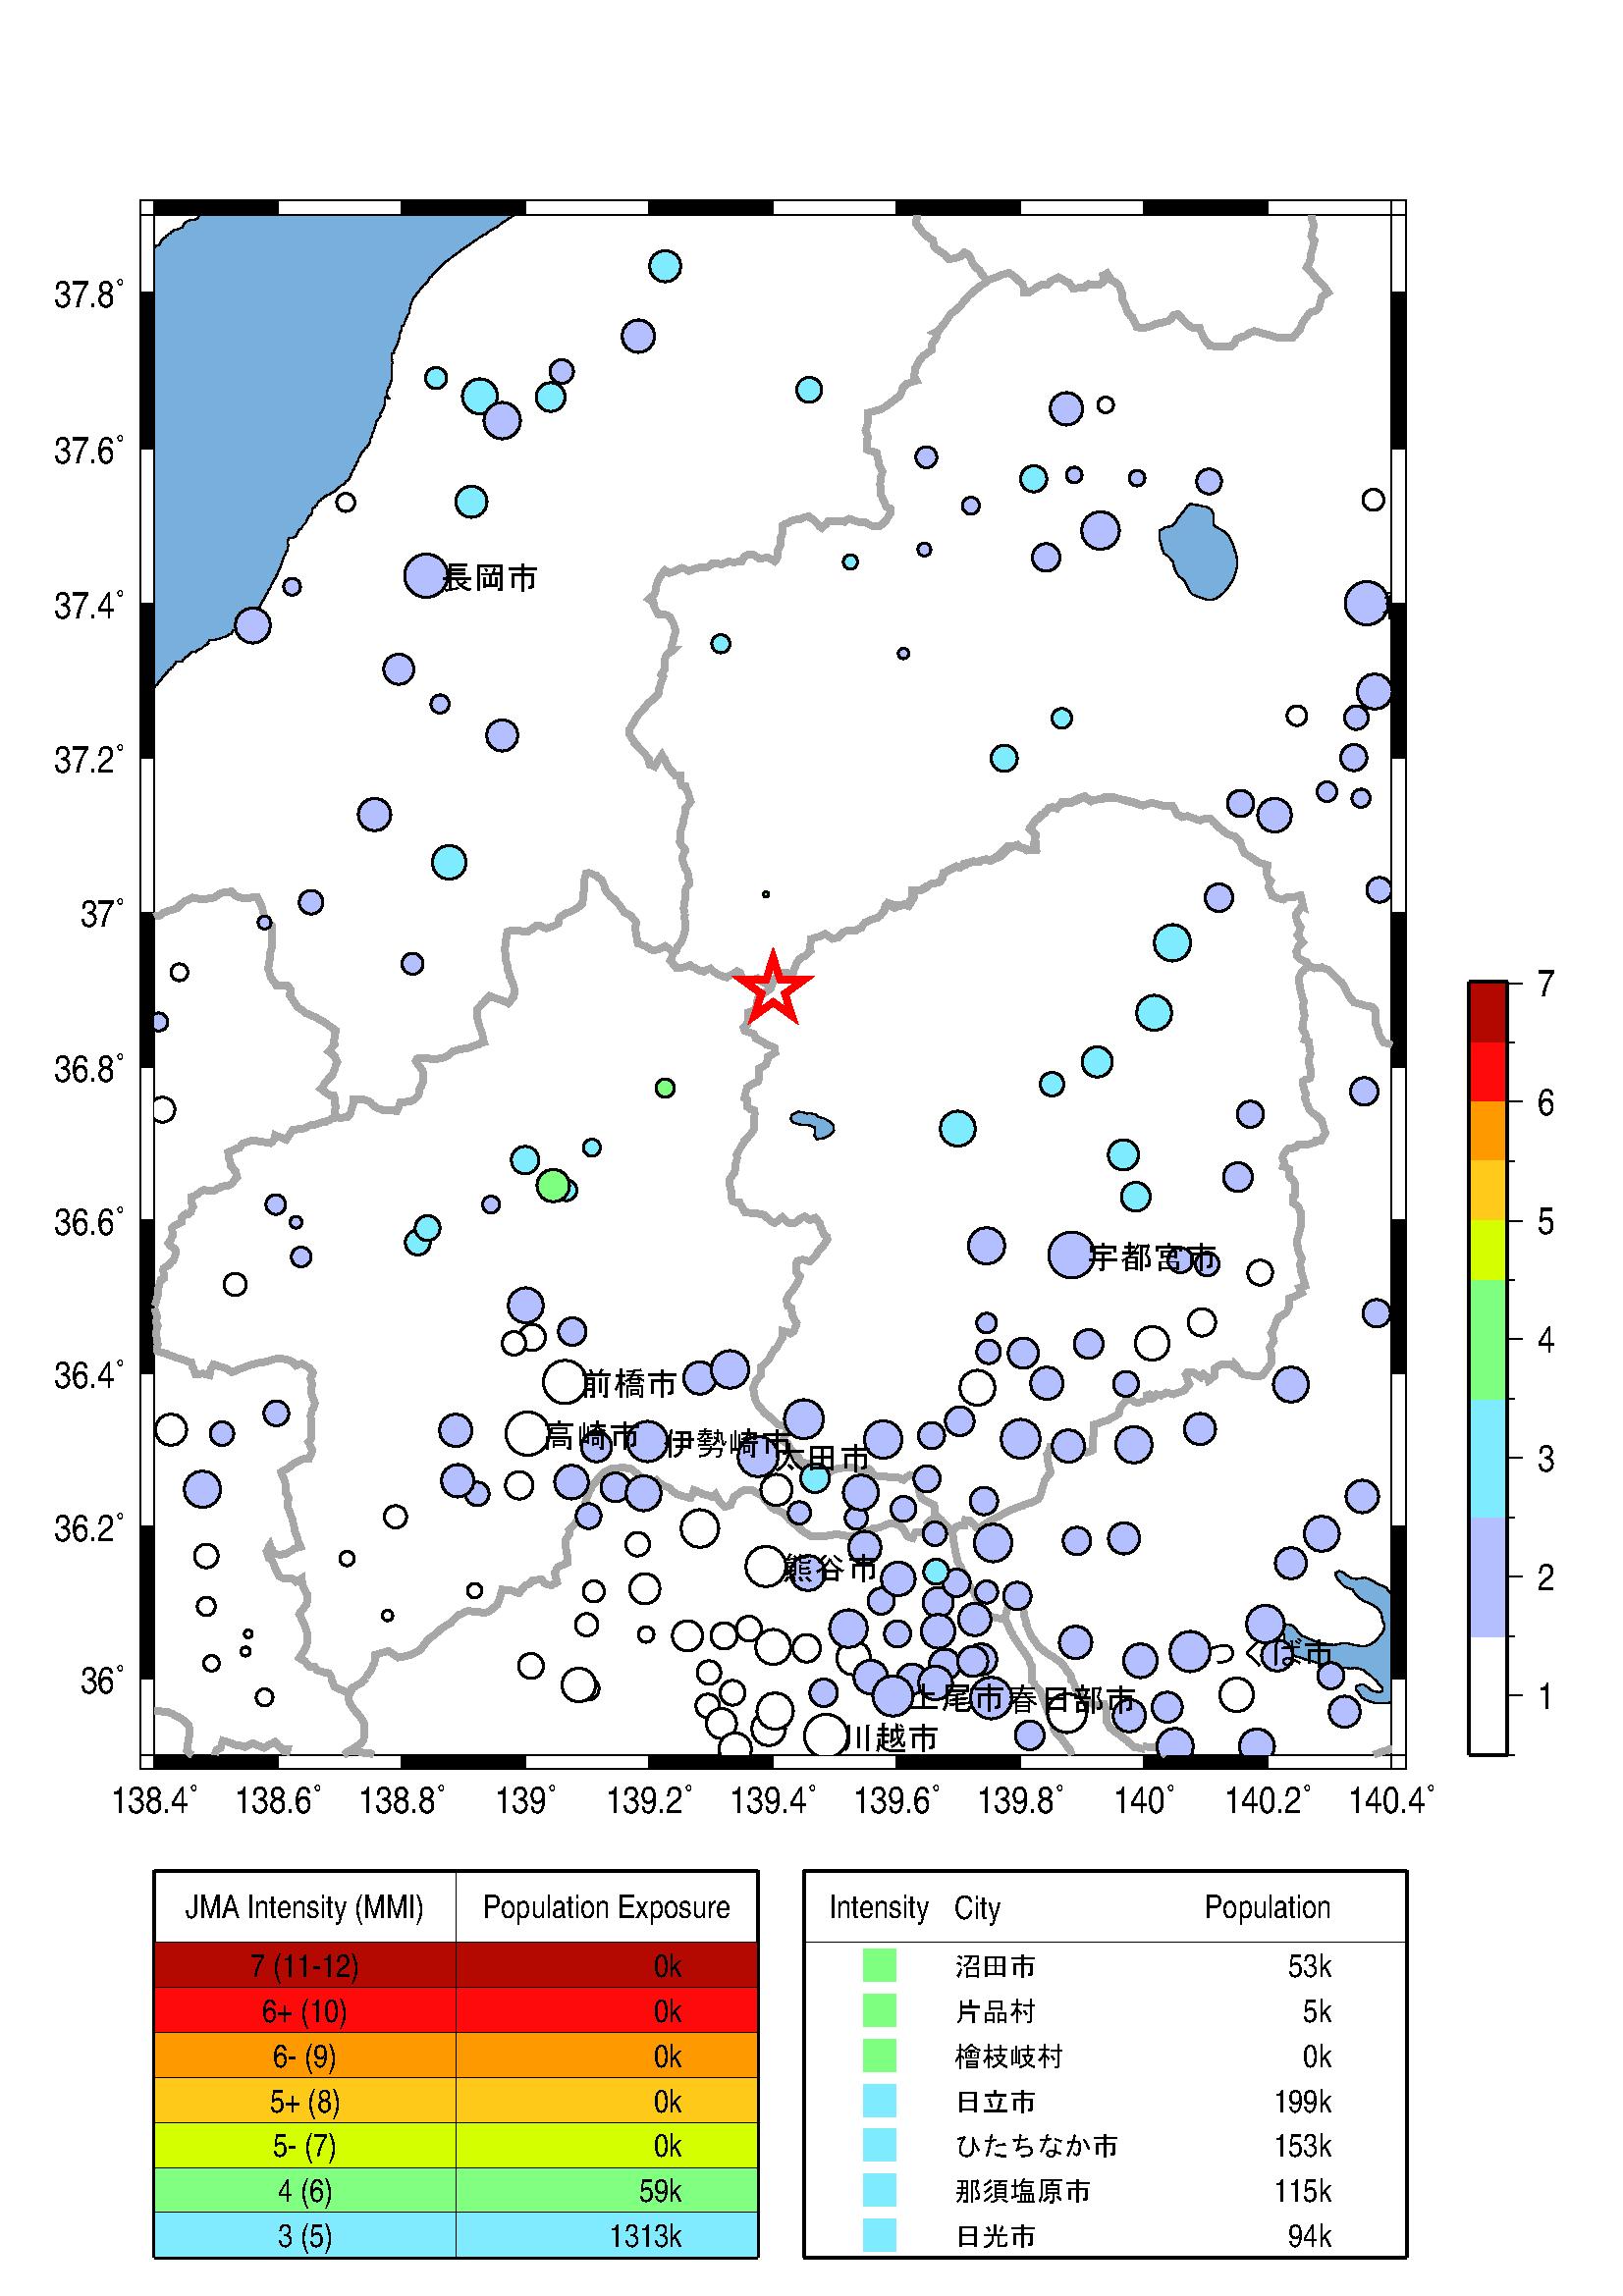
Fig.5. Population exposure. A circle size shows the population at the town, and a circle color shows the seismic intensity at the town.
Wu, Y. M. and H. Kanamori (2005). Experiment on an onsite early warning method for the Taiwan early warning system, Bull. Seism. Soc. Am., 95, 347-353.
気象庁の震度情報、防災科学技術研究所のK-NET,KiK-netの波形を利用しました。
緊急地震速報を発表した地震の解析結果
山田真澄 ホーム