━━━━━━━━━━━━━━━━━━━━━━━━
2012年12月7日 宮城県沖の地震
━━━━━━━━━━━━━━━━━━━━━━━━
1.地震について (Earthquake Information)
----------------------------------------------------
2012/12/07,17:18:20.28 37.816 144.315 46 7.4
----------------------------------------------------
Table1. Earthquake information. Origin time, Epicentral latitude, longitude, depth, and JMA magnitude from the left.(ref. Hi-net and JMA source mechanisms)
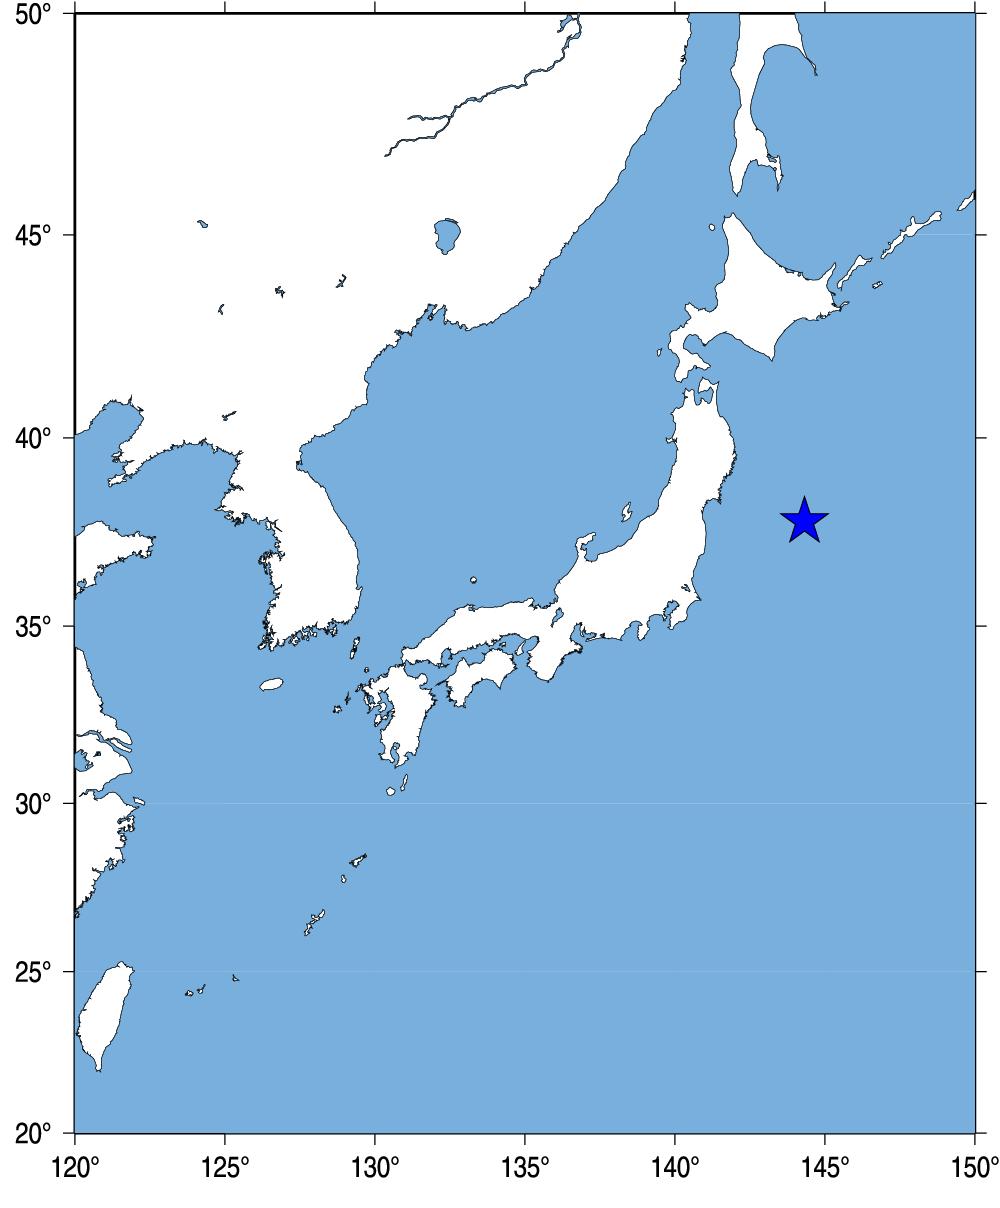
Fig.1. Event location.
2.観測点分布 (Station Distribution)
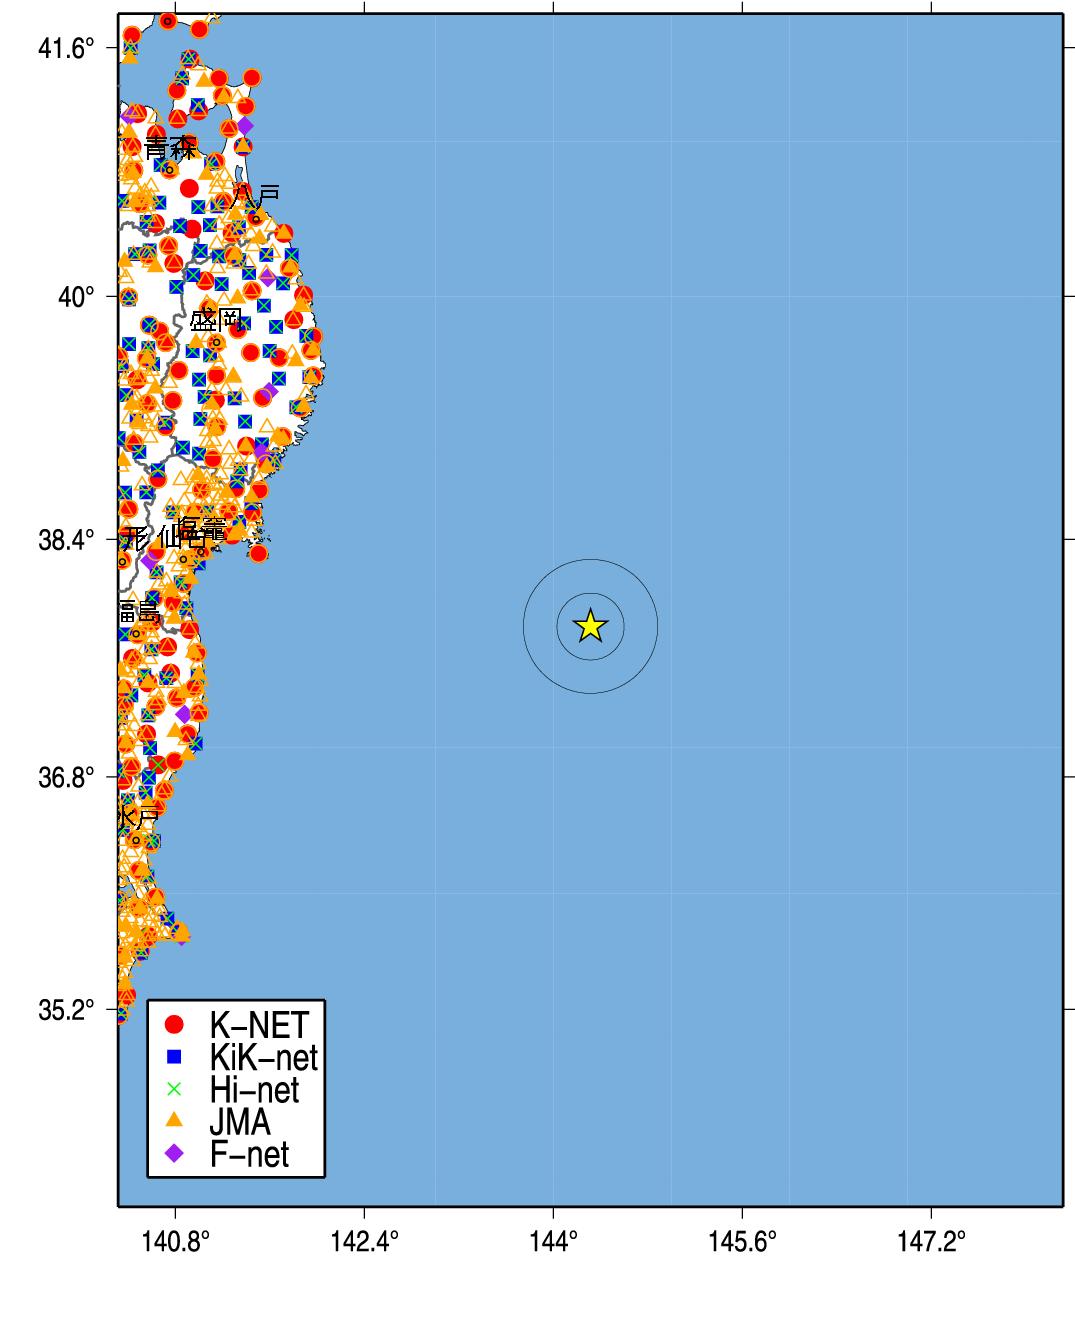
Fig.2. Station Distribution.
3.緊急地震速報発信状況 (Earthquake Early Warning Report)
-------------------------------------------------------------------[01] 12/12/07-17:18:29 04 M6.6 38.0N 143.4E 010km (12/12/07-17:19:01)
[06] 12/12/07-17:18:22 5- M7.8 37.8N 143.9E 010km (12/12/07-17:19:09)
[08] 12/12/07-17:18:15 5- M8.0 37.7N 144.6E 010km (12/12/07-17:19:21)
[09] 12/12/07-17:18:17 5- M7.9 37.8N 144.4E 010km (12/12/07-17:19:28)
[10] 12/12/07-17:18:17 04 M7.3 37.8N 144.4E 010km (12/12/07-17:19:48)
[11] 12/12/07-17:18:17 04 M7.3 37.8N 144.4E 010km (12/12/07-17:19:52)
[12] 12/12/07-17:18:19 04 M7.2 37.8N 144.2E 010km (12/12/07-17:19:54)
[13] 12/12/07-17:18:17 04 M7.2 37.8N 144.3E 010km (12/12/07-17:20:14)
[14] 12/12/07-17:18:17 04 M7.3 37.8N 144.4E 010km (12/12/07-17:20:29)
---------------------------------------------------------------------
(左から順に情報番号,震源時,最大予測震度,マグニチュード, 震央緯度,震央経度,震源深さ,電文発表時刻) from CEORKA
-------------------------------------------------------------------
Table2. Earthquake early warning reports. Information ID, Origin time, Maximum Intensity, JMA magnitude, Epicentral latitude, longitude, depth, and time to issue the report from the left.(ref. The Committee of Earthquake Observation and Research in the Kansai Area)
--> 気象庁による緊急地震速報の内容
4.解析結果 (Analytical Result)
-------------------------------------------------------
MYG0111212071718 141.504 38.305 2.086 35.980 252.555 7.4 6.2
MYGH031212071718 141.638 38.921 1.743 37.640 264.144 7.4 6.0
MYG0021212071718 141.511 38.726 1.091 37.910 265.353 7.4 5.6
IWT0081212071718 141.708 39.082 2.037 38.060 267.403 7.4 6.1
IWT0071212071718 141.856 39.270 2.127 38.140 268.328 7.4 6.2
MYG0011212071718 141.568 38.902 1.017 38.240 268.587 7.4 5.5
IWTH231212071718 141.823 39.274 2.347 38.530 270.877 7.4 6.3
MYGH111212071718 141.342 38.516 1.333 38.700 271.847 7.4 5.7
MYG0101212071718 141.282 38.429 1.089 39.090 274.527 7.4 5.6
IWTH211212071718 141.934 39.473 2.649 39.350 277.168 7.4 6.4
Observed/Estimated Mw(median) tauc 7.4 6.05 1.9
-------------------------------------------------------
Table3. Analytical results using Tau_c method (Wu and Kanamori, 2005). Station ID, Station longitude, latitude, tauc, P-arrival time, epicentral distance(km) , magnitude, and estimated magnitude from the left.
5.観測記録 (Observed Records)
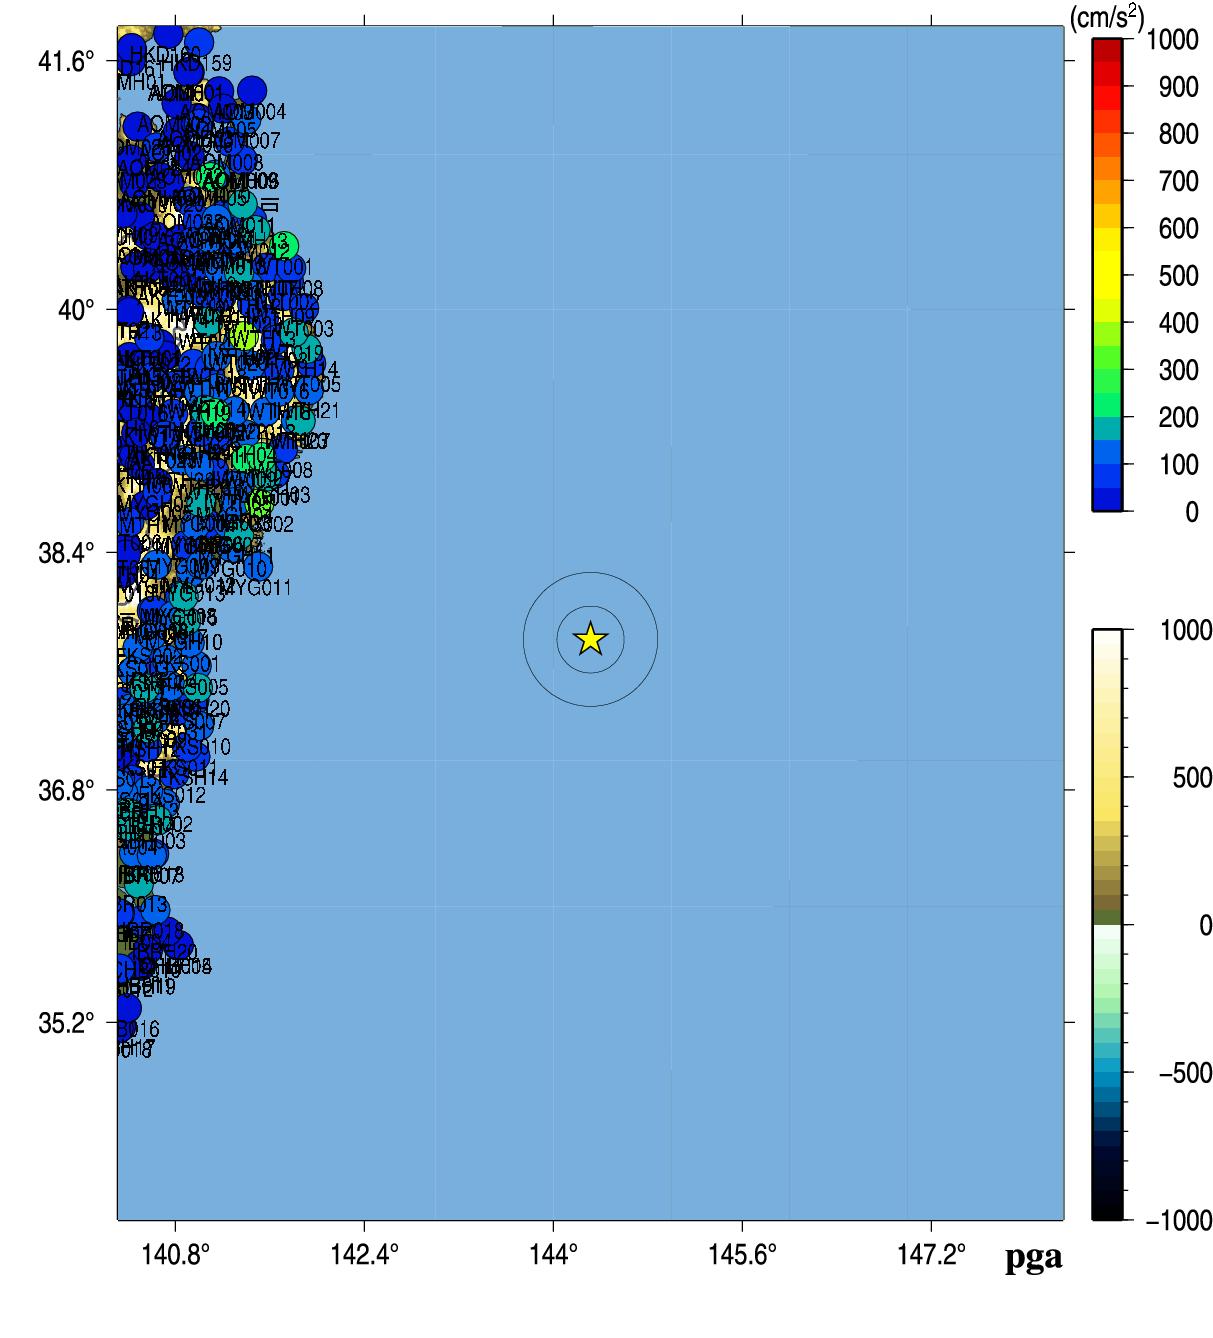
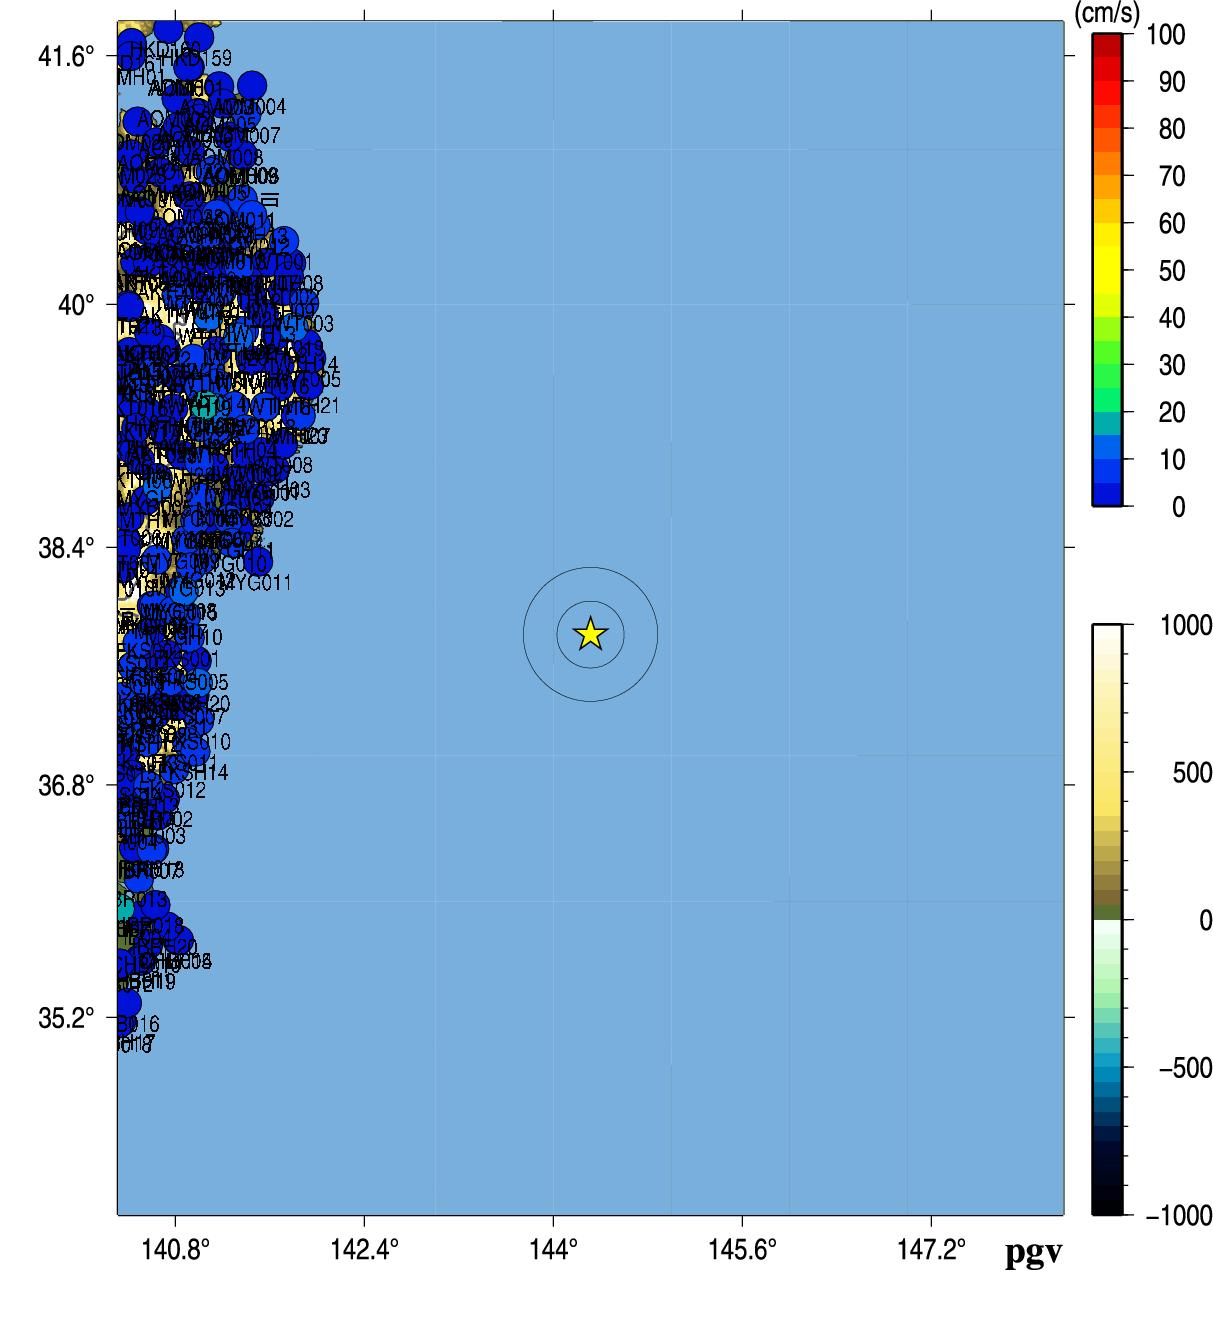
Fig.3. Peak Ground Acceleration (left) and Peak Ground Velocity (right).
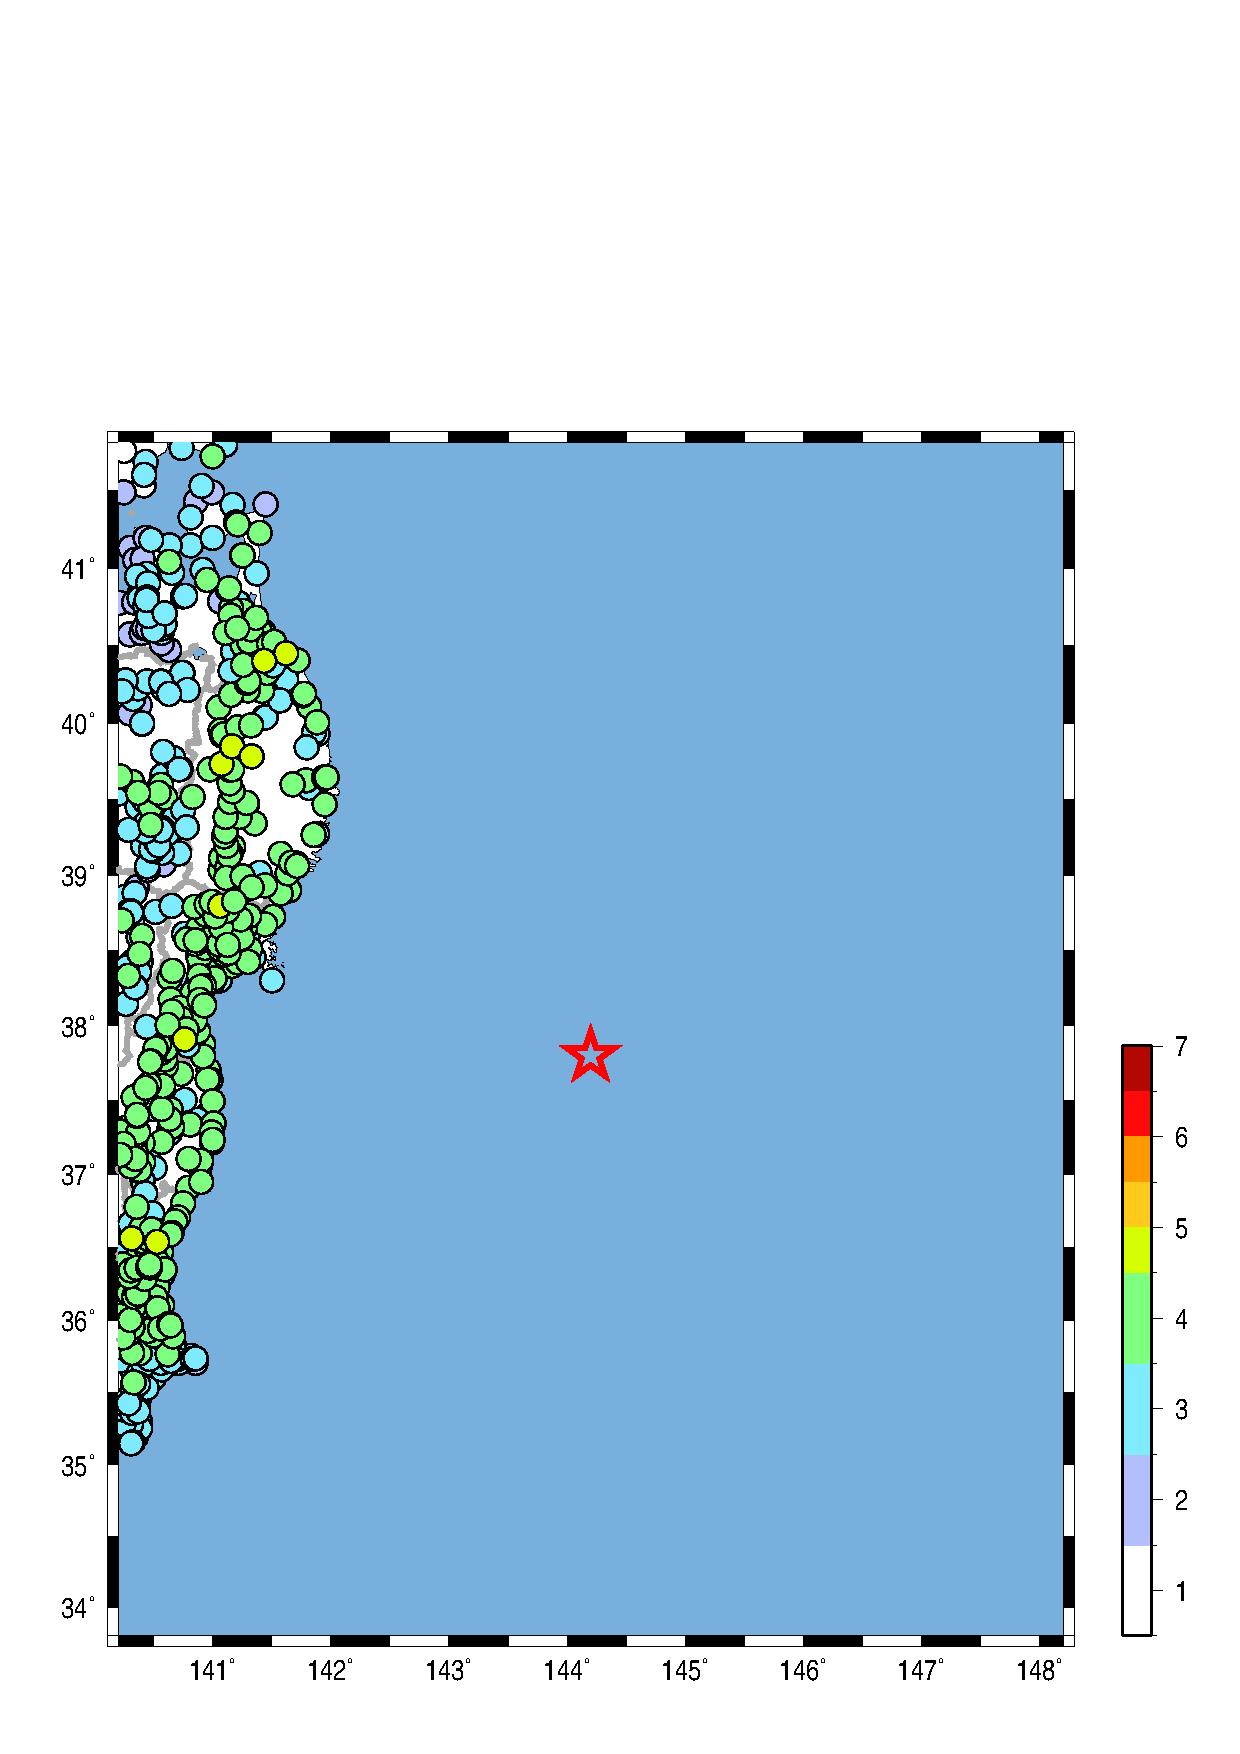
Fig.4. JMA seismic intensity.
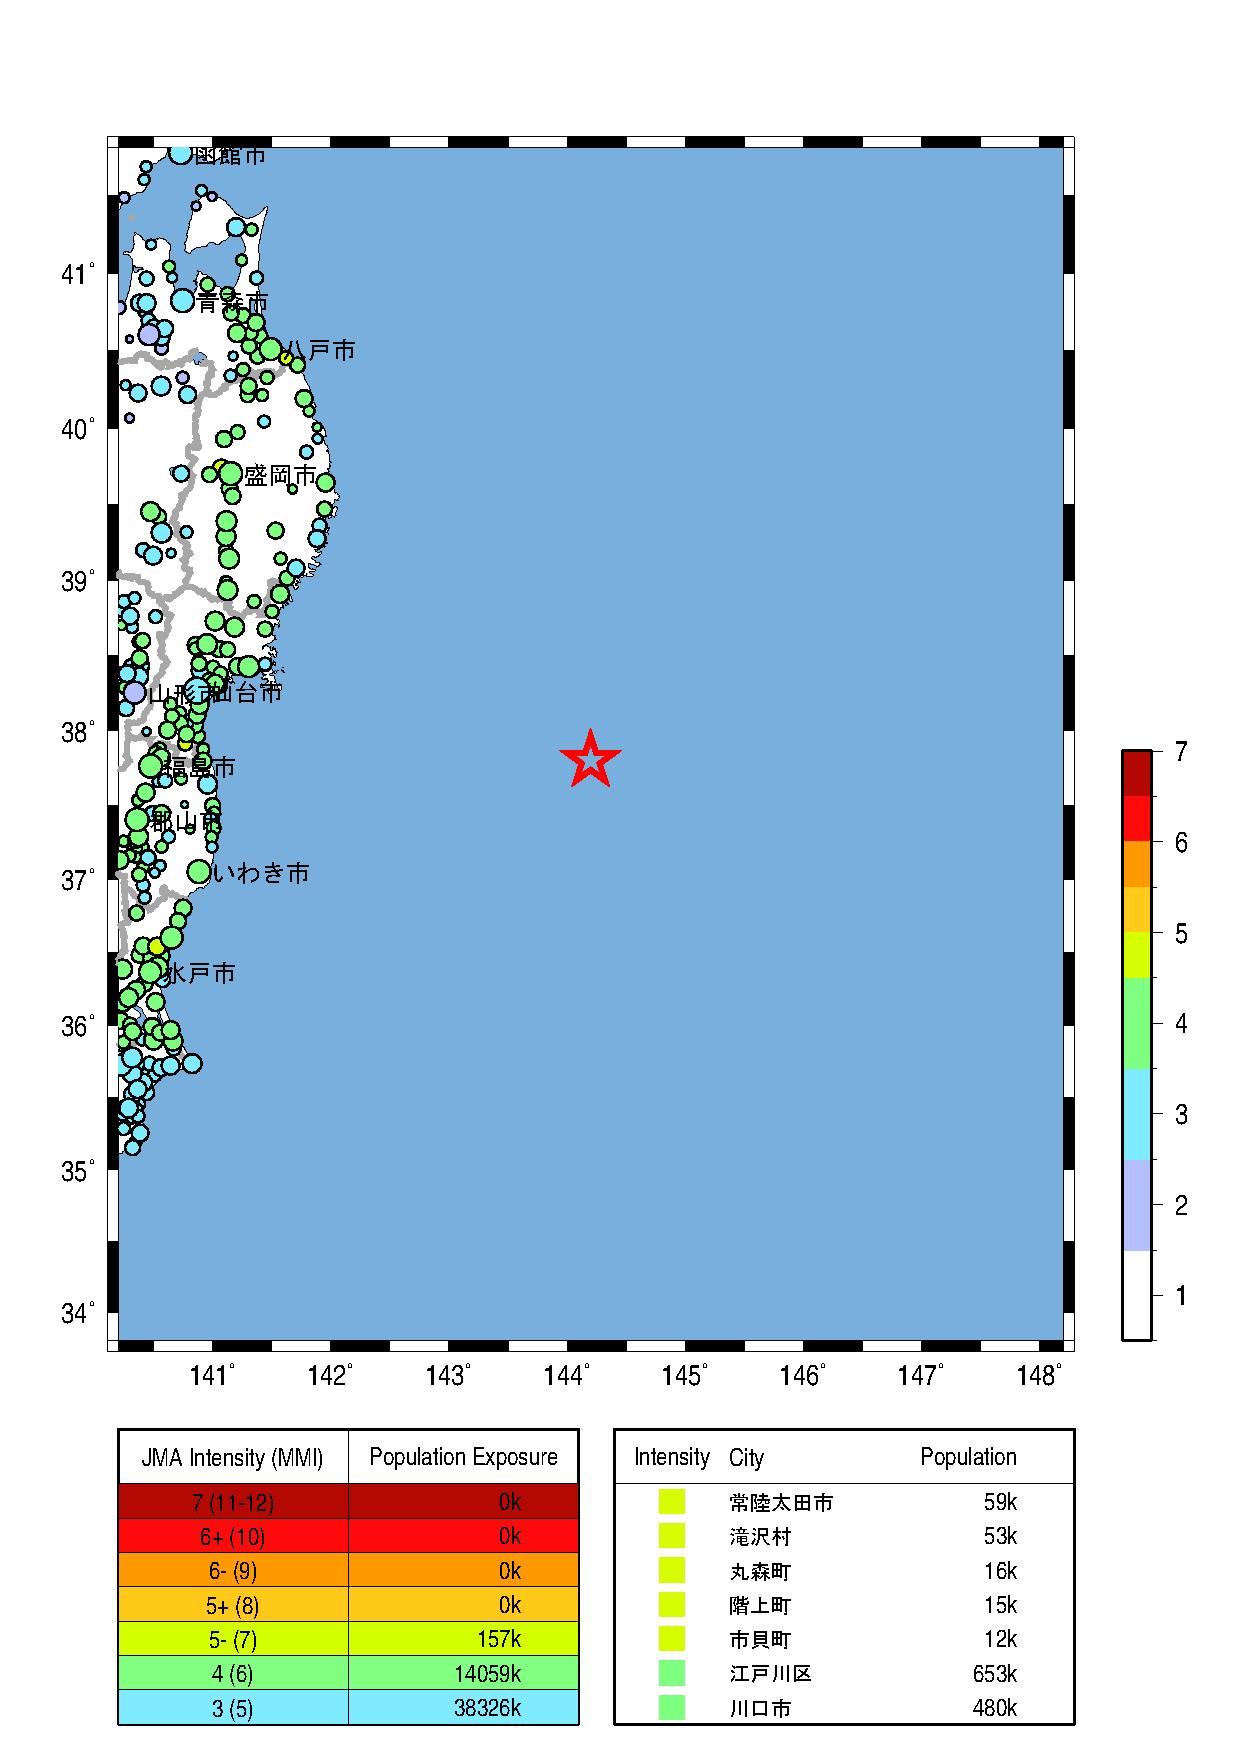
Fig.5. Population exposure. A circle size shows the population at the town, and a circle color shows the seismic intensity at the town.
Wu, Y. M. and H. Kanamori (2005). Experiment on an onsite early warning method for the Taiwan early warning system, Bull. Seism. Soc. Am., 95, 347-353.
気象庁の震度情報、防災科学技術研究所のK-NET,KiK-netの波形を利用しました。
緊急地震速報を発表した地震の解析結果
山田真澄 ホーム