━━━━━━━━━━━━━━━━━━━━━━━━
2011年7月5日 和歌山県北部の地震
━━━━━━━━━━━━━━━━━━━━━━━━
1.地震について (Earthquake Information)
----------------------------------------------------
2011/07/05,19:18:43.401 33.9927 135.2298 8.7 5.7
----------------------------------------------------
Table1. Earthquake information. Origin time, Epicentral latitude, longitude, depth, and JMA magnitude from the left.(ref. Hi-net and JMA source mechanisms)
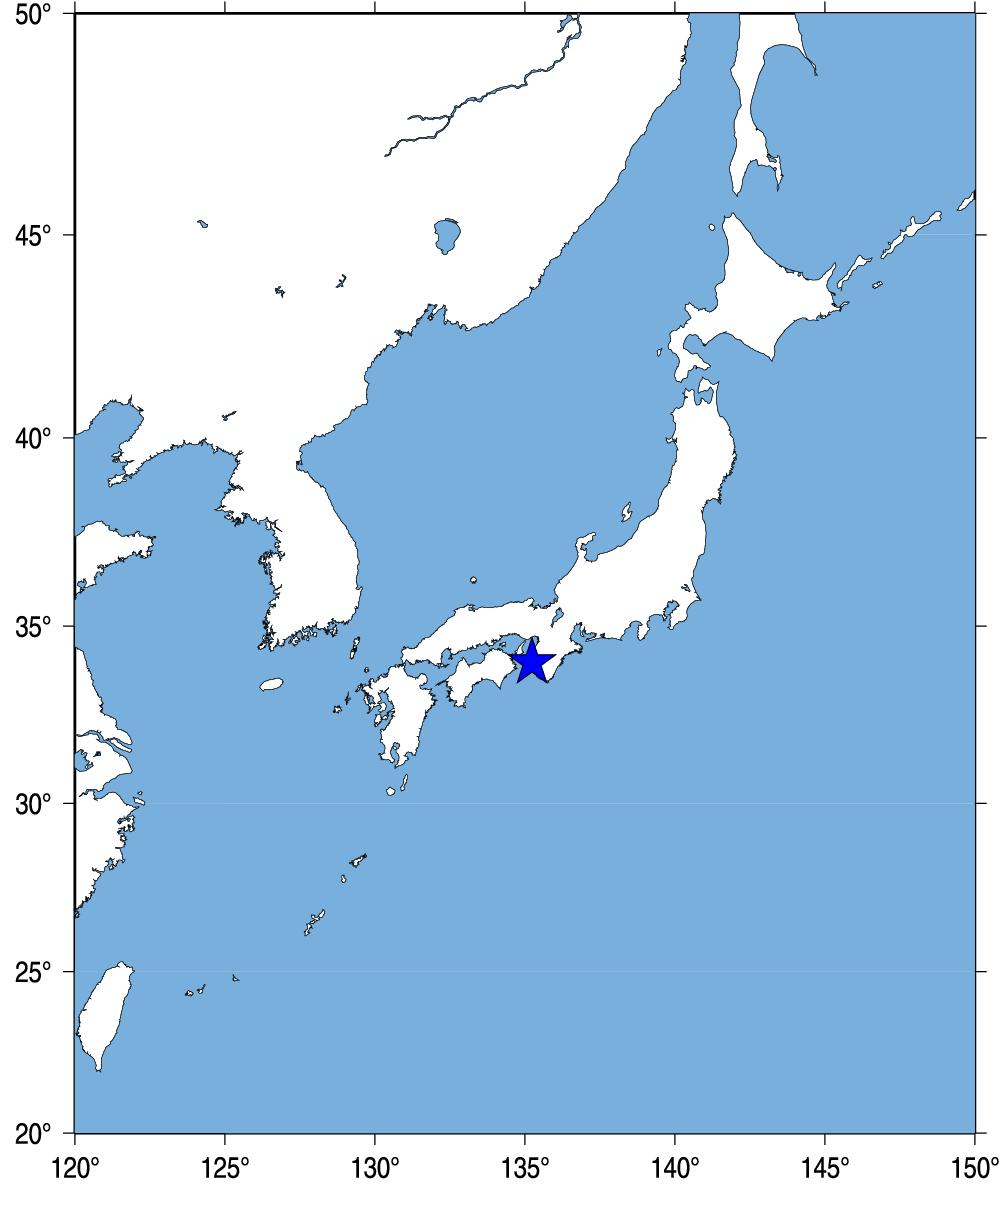
Fig.1. Event location.
2.観測点分布 (Station Distribution)
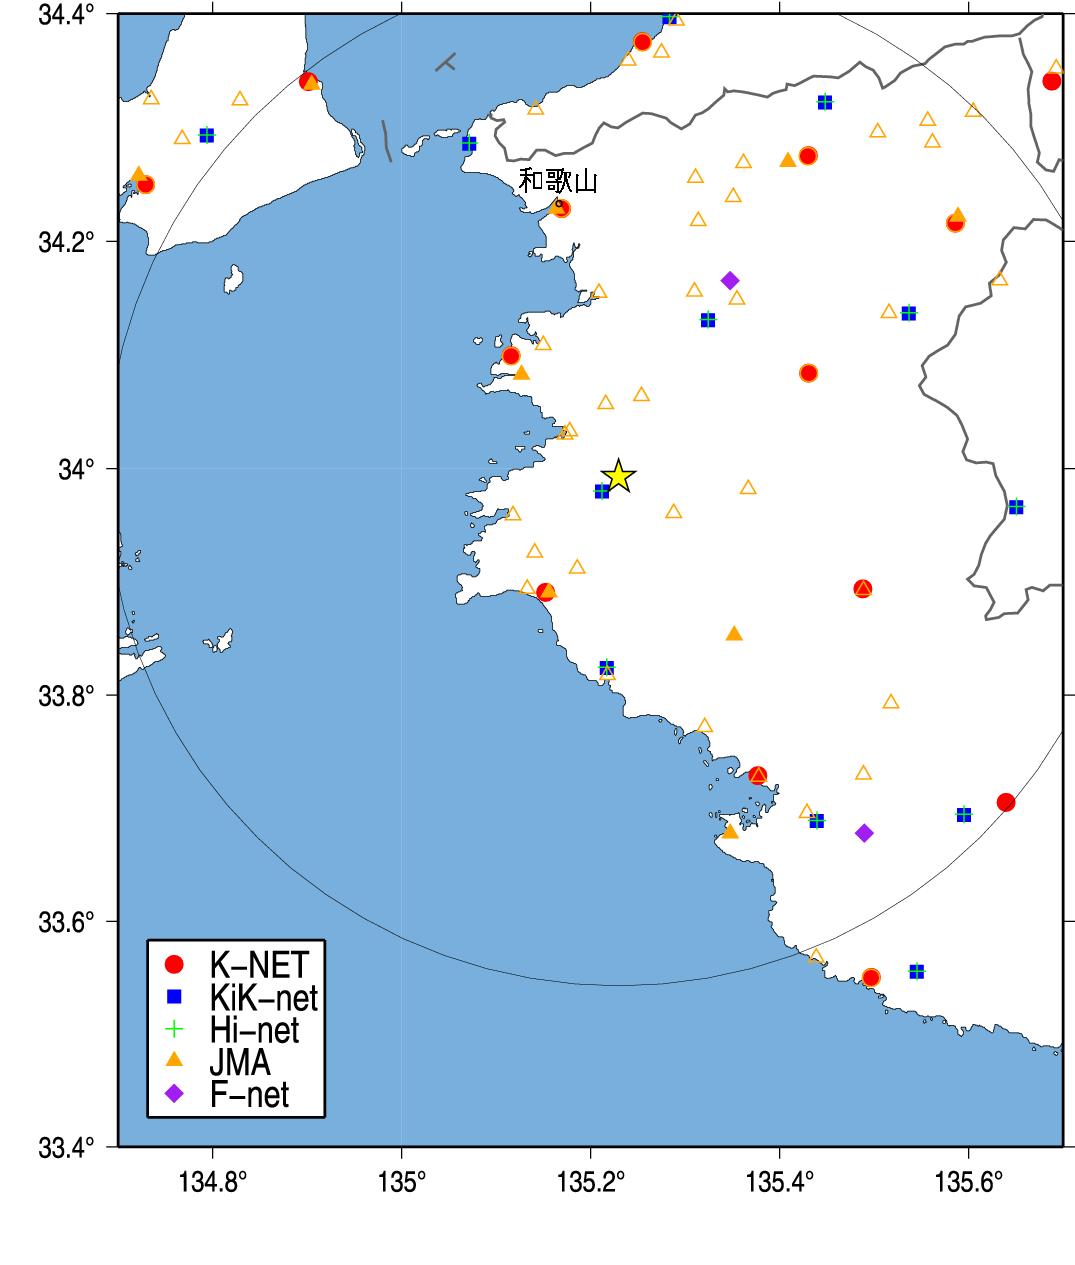
Fig.2. Station Distribution.
3.緊急地震速報発信状況 (Earthquake Early Warning Report)
-------------------------------------------------------------------[01] 11/07/05-19:18:43 04 M5.1 33.9N 135.2E 010km (11/07/05-19:18:51)
[06] 11/07/05-19:18:43 5- M5.2 34.0N 135.2E 010km (11/07/05-19:18:58)
[07] 11/07/05-19:18:43 5- M5.2 34.0N 135.2E 010km (11/07/05-19:19:04)
[08] 11/07/05-19:18:43 5- M5.3 34.0N 135.2E 010km (11/07/05-19:19:17)
[09] 11/07/05-19:18:43 5- M5.3 34.0N 135.2E 010km (11/07/05-19:19:36)
---------------------------------------------------------------------
(左から順に情報番号,震源時,最大予測震度,マグニチュード, 震央緯度,震央経度,震源深さ,電文発表時刻) from CEORKA
-------------------------------------------------------------------
Table2. Earthquake early warning reports. Information ID, Origin time, Maximum Intensity, JMA magnitude, Epicentral latitude, longitude, depth, and time to issue the report from the left.(ref. The Committee of Earthquake Observation and Research in the Kansai Area)
--> 気象庁による緊急地震速報の内容
4.解析結果 (Analytical Result)
-------------------------------------------------------
WKYH011107051918 135.215 33.977 1.571 1.479 2.205 5.7 5.9
WKY0061107051918 135.152 33.891 0.490 2.719 13.377 5.7 4.8
WKY0031107051918 135.116 34.100 1.021 3.249 15.844 5.7 5.5
WKY0041107051918 135.431 34.084 0.721 4.069 21.157 5.7 5.2
WKY0051107051918 135.488 33.894 1.093 4.859 26.295 5.7 5.6
WKY0011107051918 135.169 34.229 0.735 5.079 26.776 5.7 5.2
WKY0081107051918 135.377 33.729 1.058 6.049 32.283 5.7 5.5
WKYH091107051918 135.074 34.284 1.026 6.709 35.306 5.7 5.5
WKY0021107051918 135.430 34.276 0.881 6.549 36.425 5.7 5.4
NARH011107051918 135.652 33.963 0.974 6.999 39.132 5.7 5.5
Observed/Estimated Mw(median) 5.7 5.5
-------------------------------------------------------
Table3. Analytical results using Tau_c method (Wu and Kanamori, 2005). Station ID, Station longitude, latitude, tauc, P-arrival time, epicentral distance(km) , magnitude, and estimated magnitude from the left.
5.観測記録 (Observed Records)

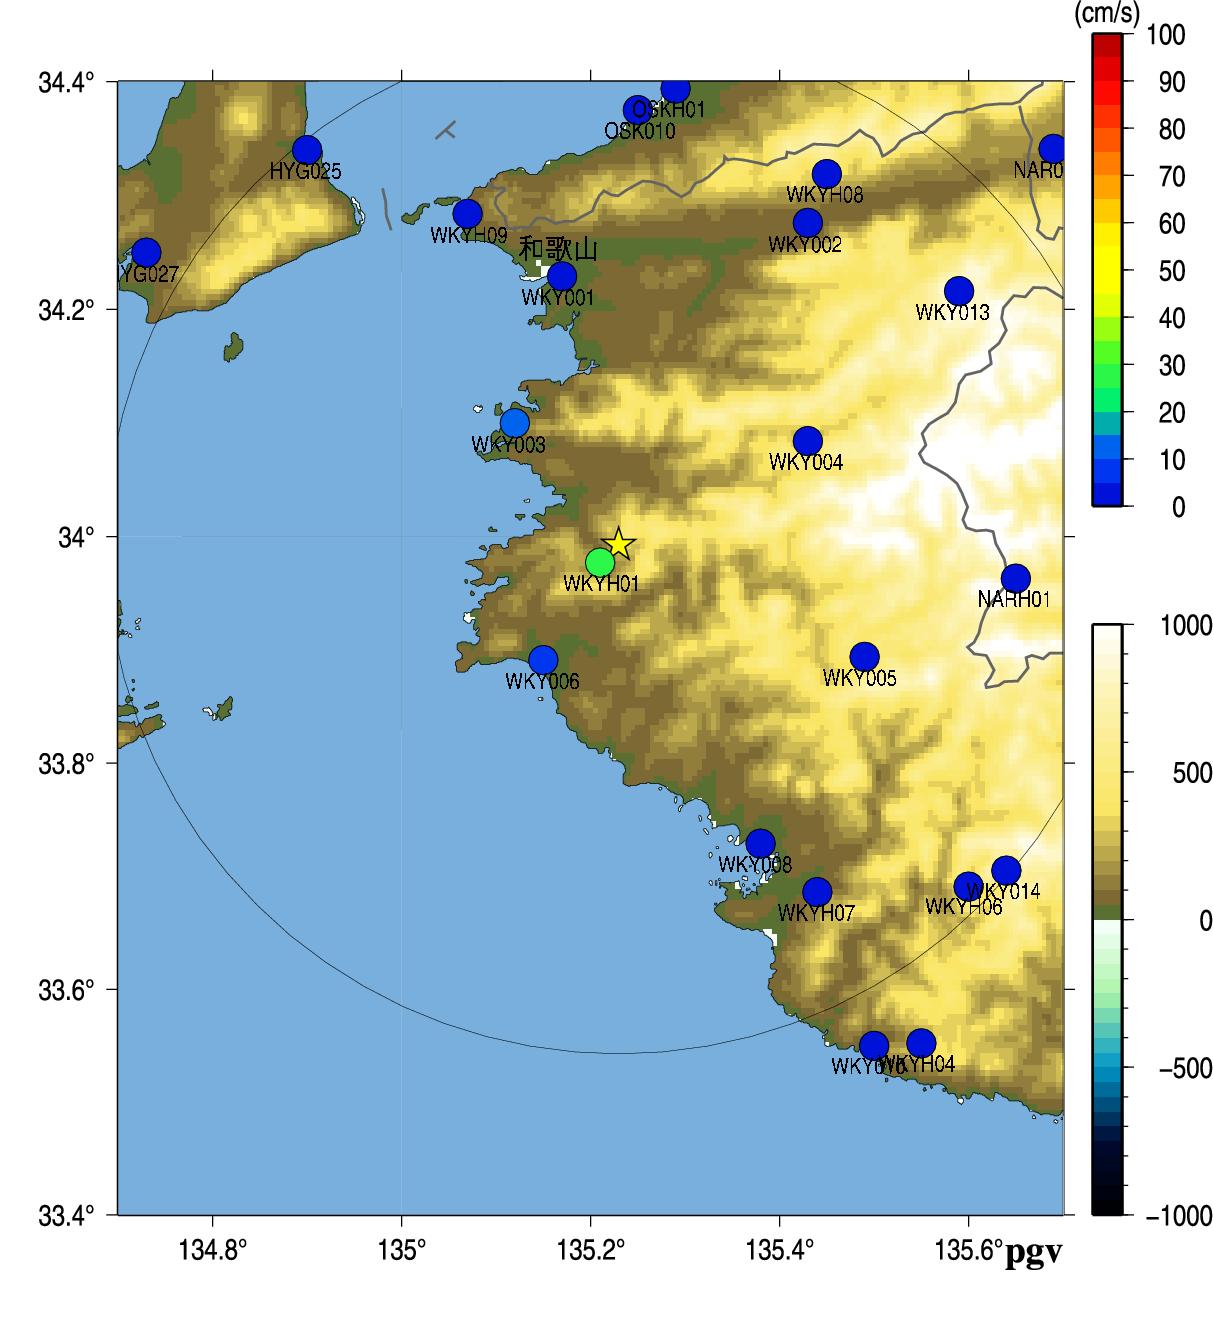
Fig.3. Peak Ground Acceleration (left) and Peak Ground Velocity (right).
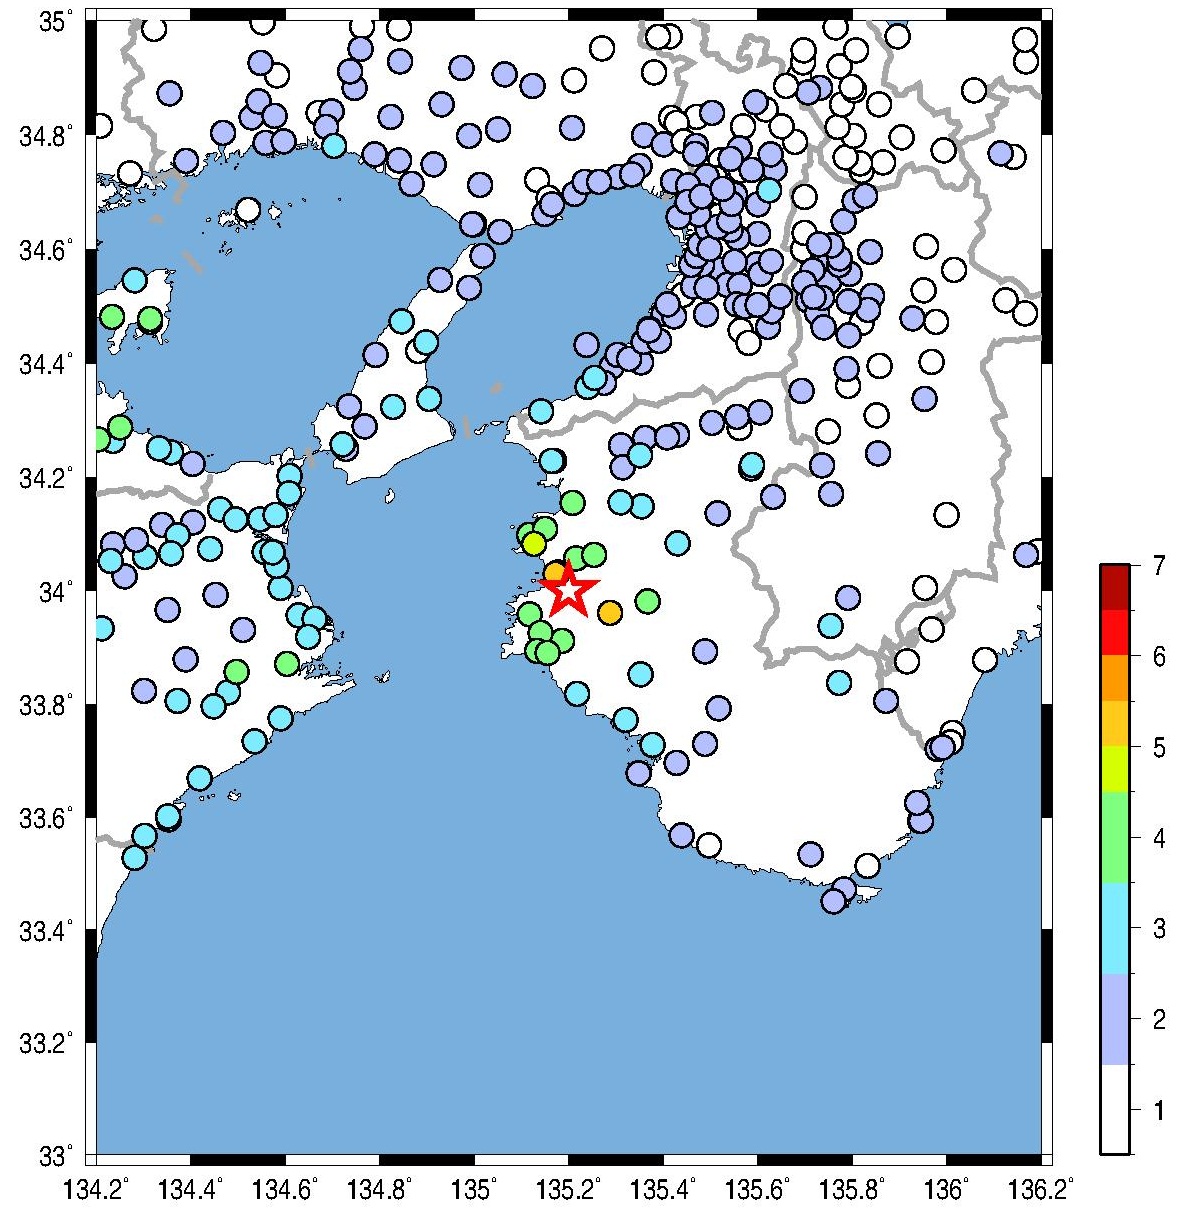
Fig.4. JMA seismic intensity.
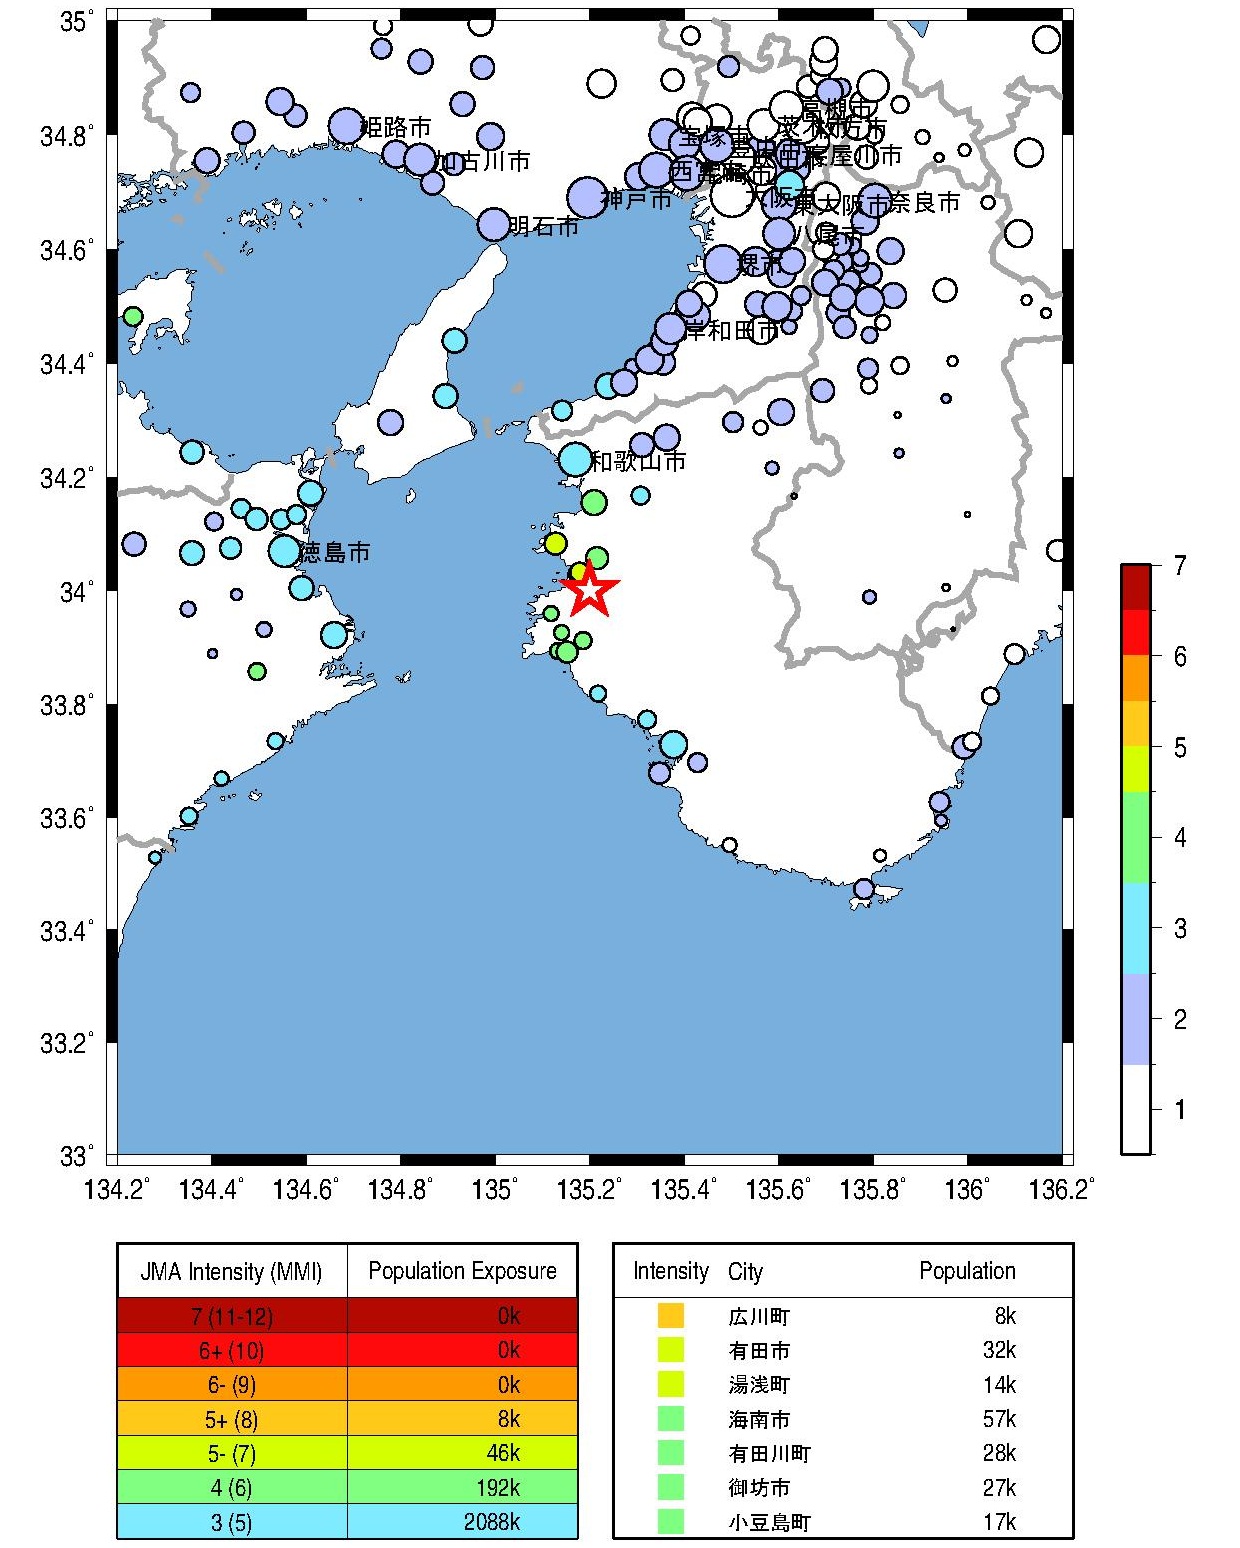
Fig.5. Population exposure. A circle size shows the population at the town, and a circle color shows the seismic intensity at the town.
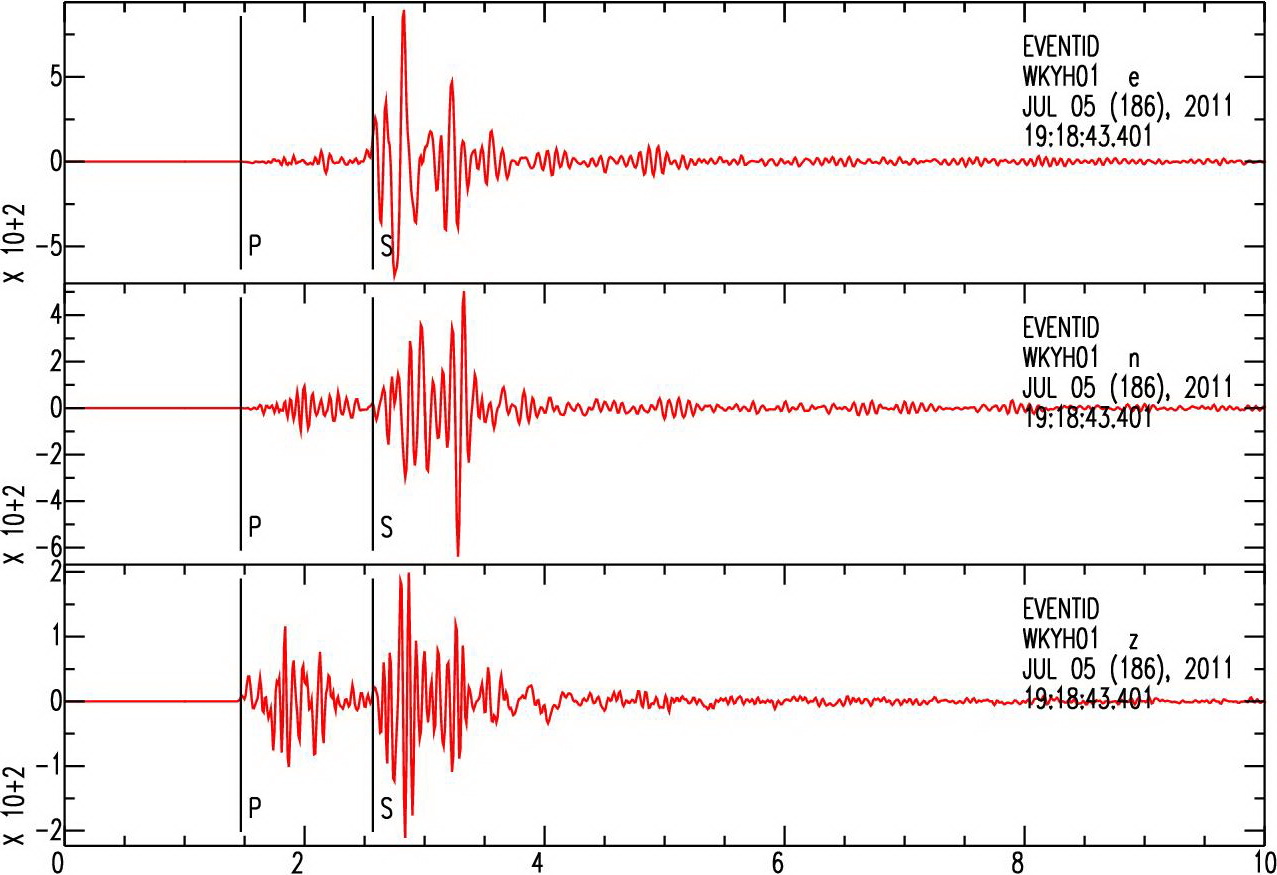
Fig.6. Acceleration waveforms at the closest KiK-net station (WKYH01). The horizontal PGA exceeds 1g. (unit: cm/s/s)
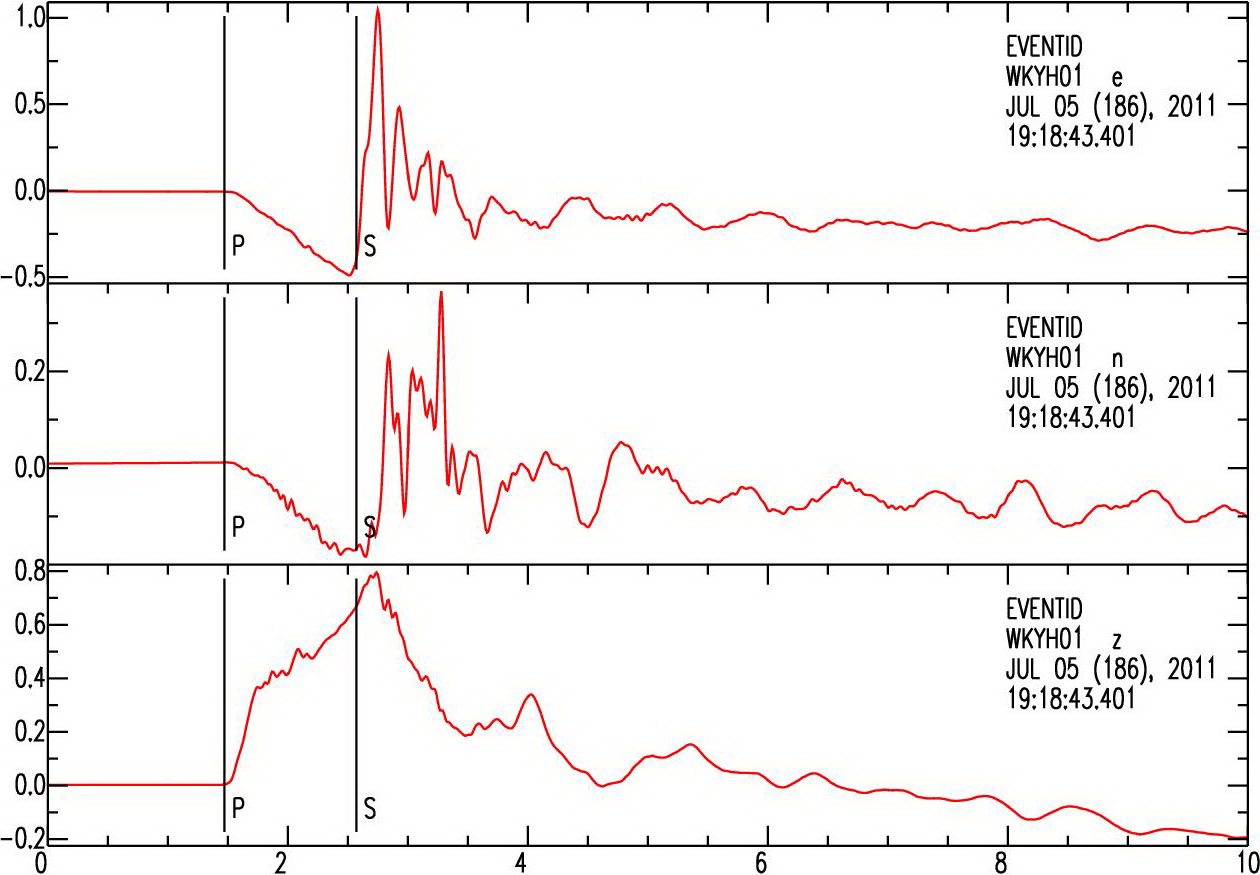
Fig.7. Displacement waveforms at the closest KiK-net station (WKYH01). Clear near-field term (between P- and S-wave arrival) can be observed. (unit: cm)
Wu, Y. M. and H. Kanamori (2005). Experiment on an onsite early warning method for the Taiwan early warning system, Bull. Seism. Soc. Am., 95, 347-353.
気象庁の震度情報、防災科学技術研究所のK-NET,KiK-netの波形を利用しました。
緊急地震速報を発表した地震の解析結果
山田真澄 ホーム