━━━━━━━━━━━━━━━━━━━━━━━━
2011年6月30日 長野県中部の地震
━━━━━━━━━━━━━━━━━━━━━━━━
1.地震について (Earthquake Information)
----------------------------------------------------
2011/06/30,08:16:37.174 36.1845 137.9475 4.6 5.5
----------------------------------------------------
Table1. Earthquake information. Origin time, Epicentral latitude, longitude, depth, and JMA magnitude from the left.(ref. Hi-net and JMA source mechanisms)

Fig.1. Event location.
2.観測点分布 (Station Distribution)
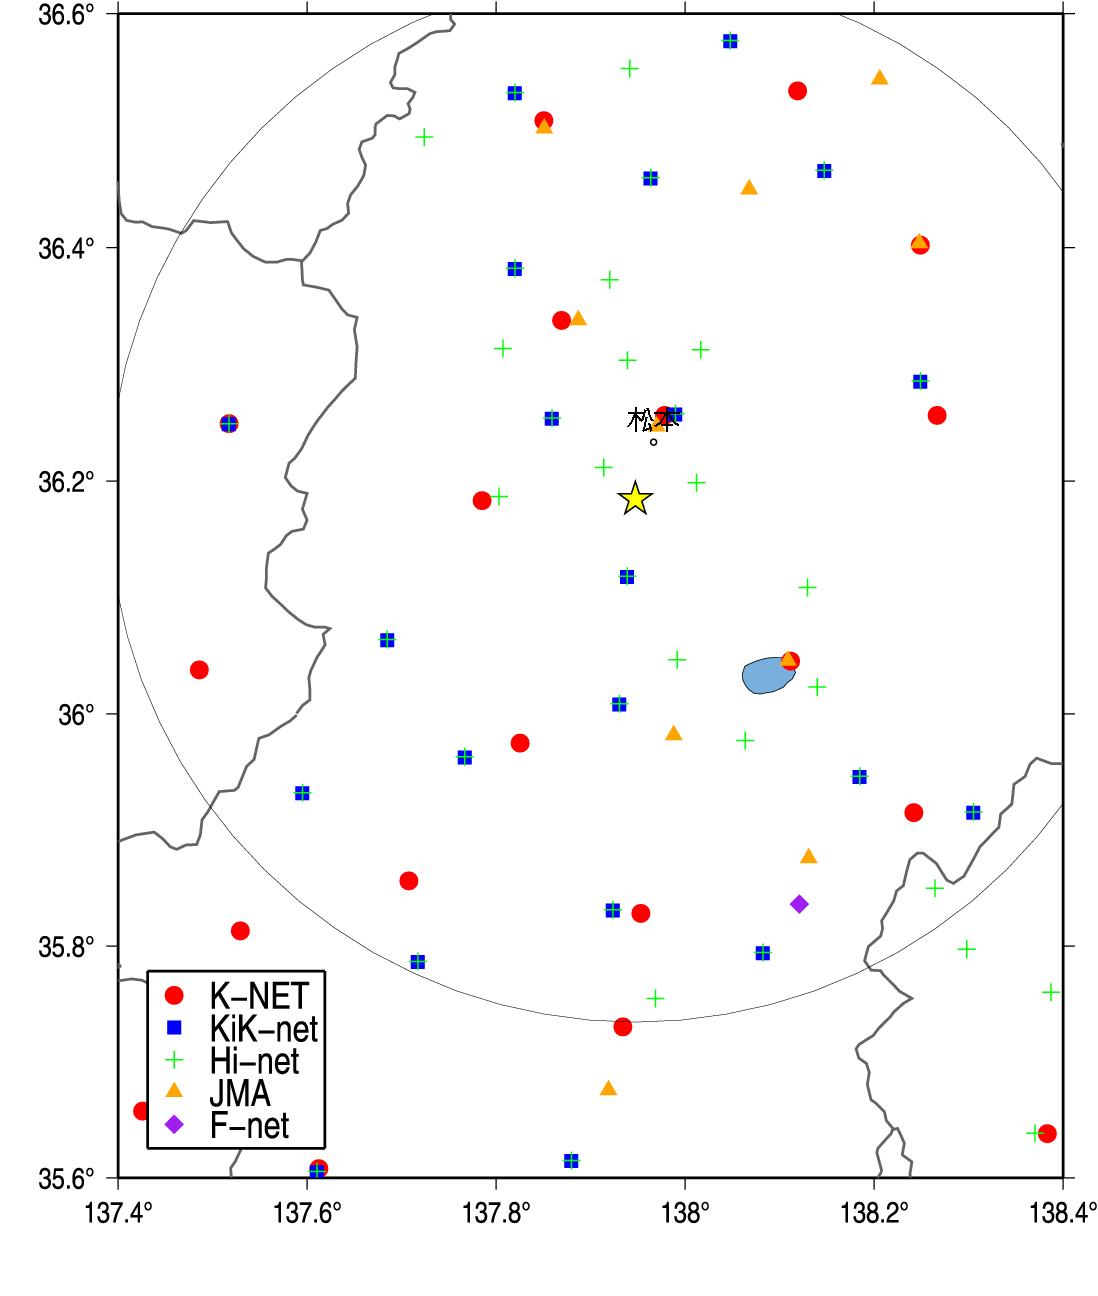
Fig.2. Station Distribution.
3.緊急地震速報発信状況 (Earthquake Early Warning Report)
-------------------------------------------------------------------[01] 11/06/30-08:16:37 04 M4.6 36.2N 138.0E 010km (11/06/30-08:16:45)
[04] 11/06/30-08:16:37 04 M5.0 36.2N 138.0E 010km (11/06/30-08:16:48)
[06] 11/06/30-08:16:36 04 M5.1 36.2N 138.0E 010km (11/06/30-08:16:53)
[07] 11/06/30-08:16:36 04 M5.1 36.2N 138.0E 010km (11/06/30-08:17:06)
[08] 11/06/30-08:16:36 04 M5.3 36.2N 138.0E 010km (11/06/30-08:17:12)
[09] 11/06/30-08:16:36 5- M5.4 36.2N 138.0E 010km (11/06/30-08:17:28)
[10] 11/06/30-08:16:36 5- M5.4 36.2N 138.0E 010km (11/06/30-08:17:37)
---------------------------------------------------------------------
(左から順に情報番号,震源時,最大予測震度,マグニチュード, 震央緯度,震央経度,震源深さ,電文発表時刻) from CEORKA
-------------------------------------------------------------------
Table2. Earthquake early warning reports. Information ID, Origin time, Maximum Intensity, JMA magnitude, Epicentral latitude, longitude, depth, and time to issue the report from the left.(ref. The Committee of Earthquake Observation and Research in the Kansai Area)
--> 気象庁による緊急地震速報の内容
4.解析結果 (Analytical Result)
-------------------------------------------------------
NGNH311106300816 137.942 36.115 1.077 1.646 7.695 5.5 5.5
NGN0121106300816 137.979 36.256 0.657 1.676 8.451 5.5 5.1
NGNH321106300816 137.993 36.255 0.821 1.686 8.785 5.5 5.3
NGNH081106300816 137.862 36.251 1.397 2.116 10.643 5.5 5.8
NGN0131106300816 137.785 36.183 1.450 2.616 14.600 5.5 5.8
NGN0091106300816 137.869 36.338 1.154 3.476 18.401 5.5 5.6
NGN0151106300816 138.112 36.045 0.816 4.136 21.367 5.5 5.3
NGNH351106300816 137.823 36.379 1.254 4.416 24.334 5.5 5.7
NGN0171106300816 137.826 35.975 1.425 4.926 25.733 5.5 5.8
NGNH301106300816 137.688 36.061 1.356 4.976 27.089 5.5 5.8
Observed/Estimated Mw(median) 5.5 5.65
-------------------------------------------------------
Table3. Analytical results using Tau_c method (Wu and Kanamori, 2005). Station ID, Station longitude, latitude, tauc, P-arrival time, epicentral distance(km) , magnitude, and estimated magnitude from the left.
5.観測記録 (Observed Records)
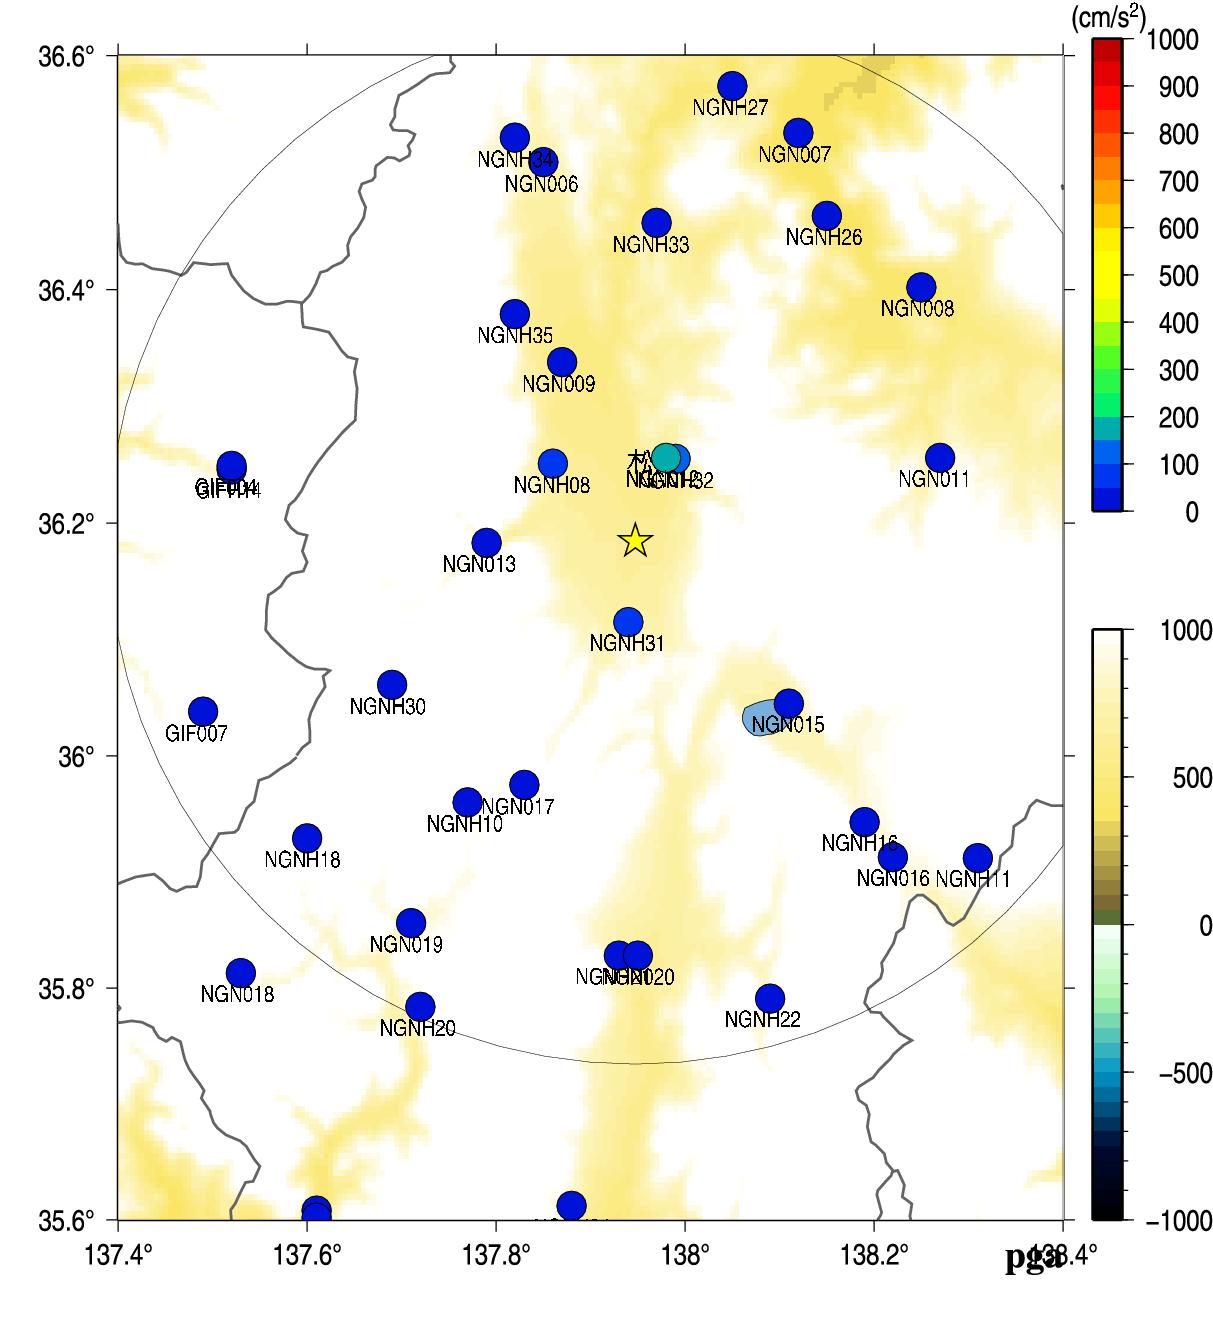
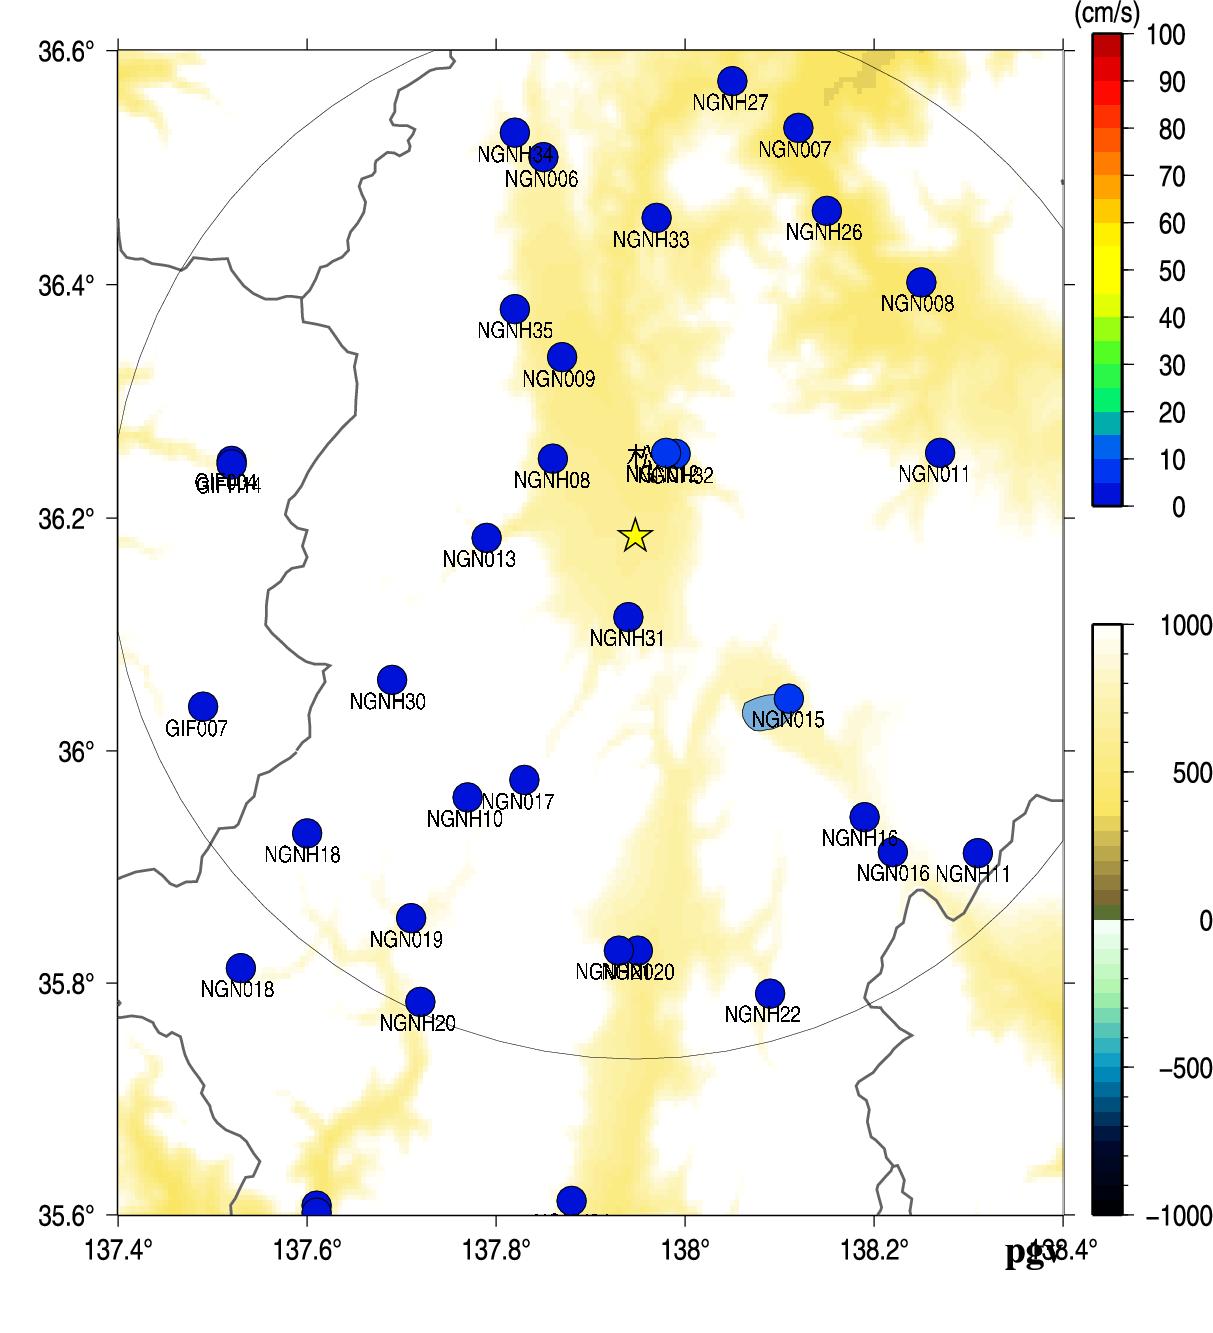
Fig.3. Peak Ground Acceleration (left) and Peak Ground Velocity (right).
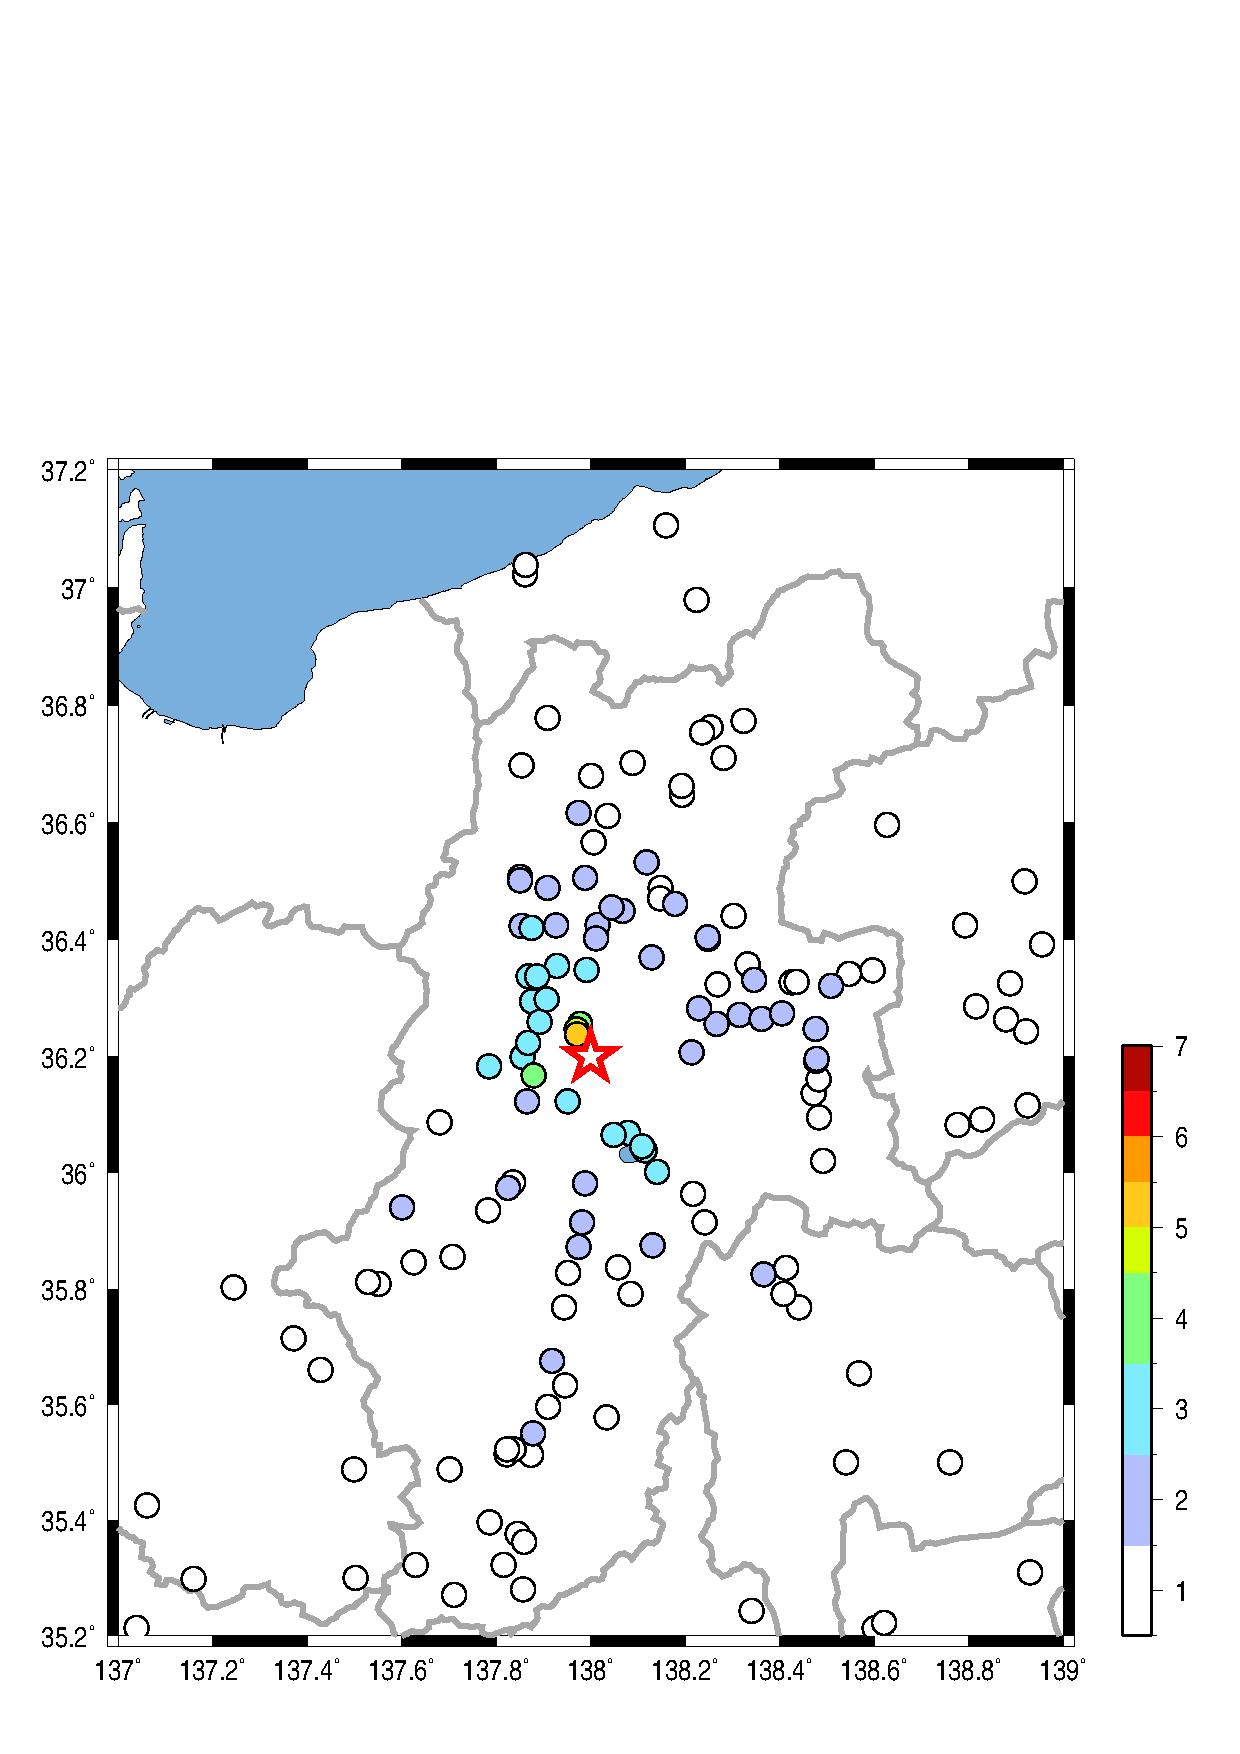
Fig.4. JMA seismic intensity.
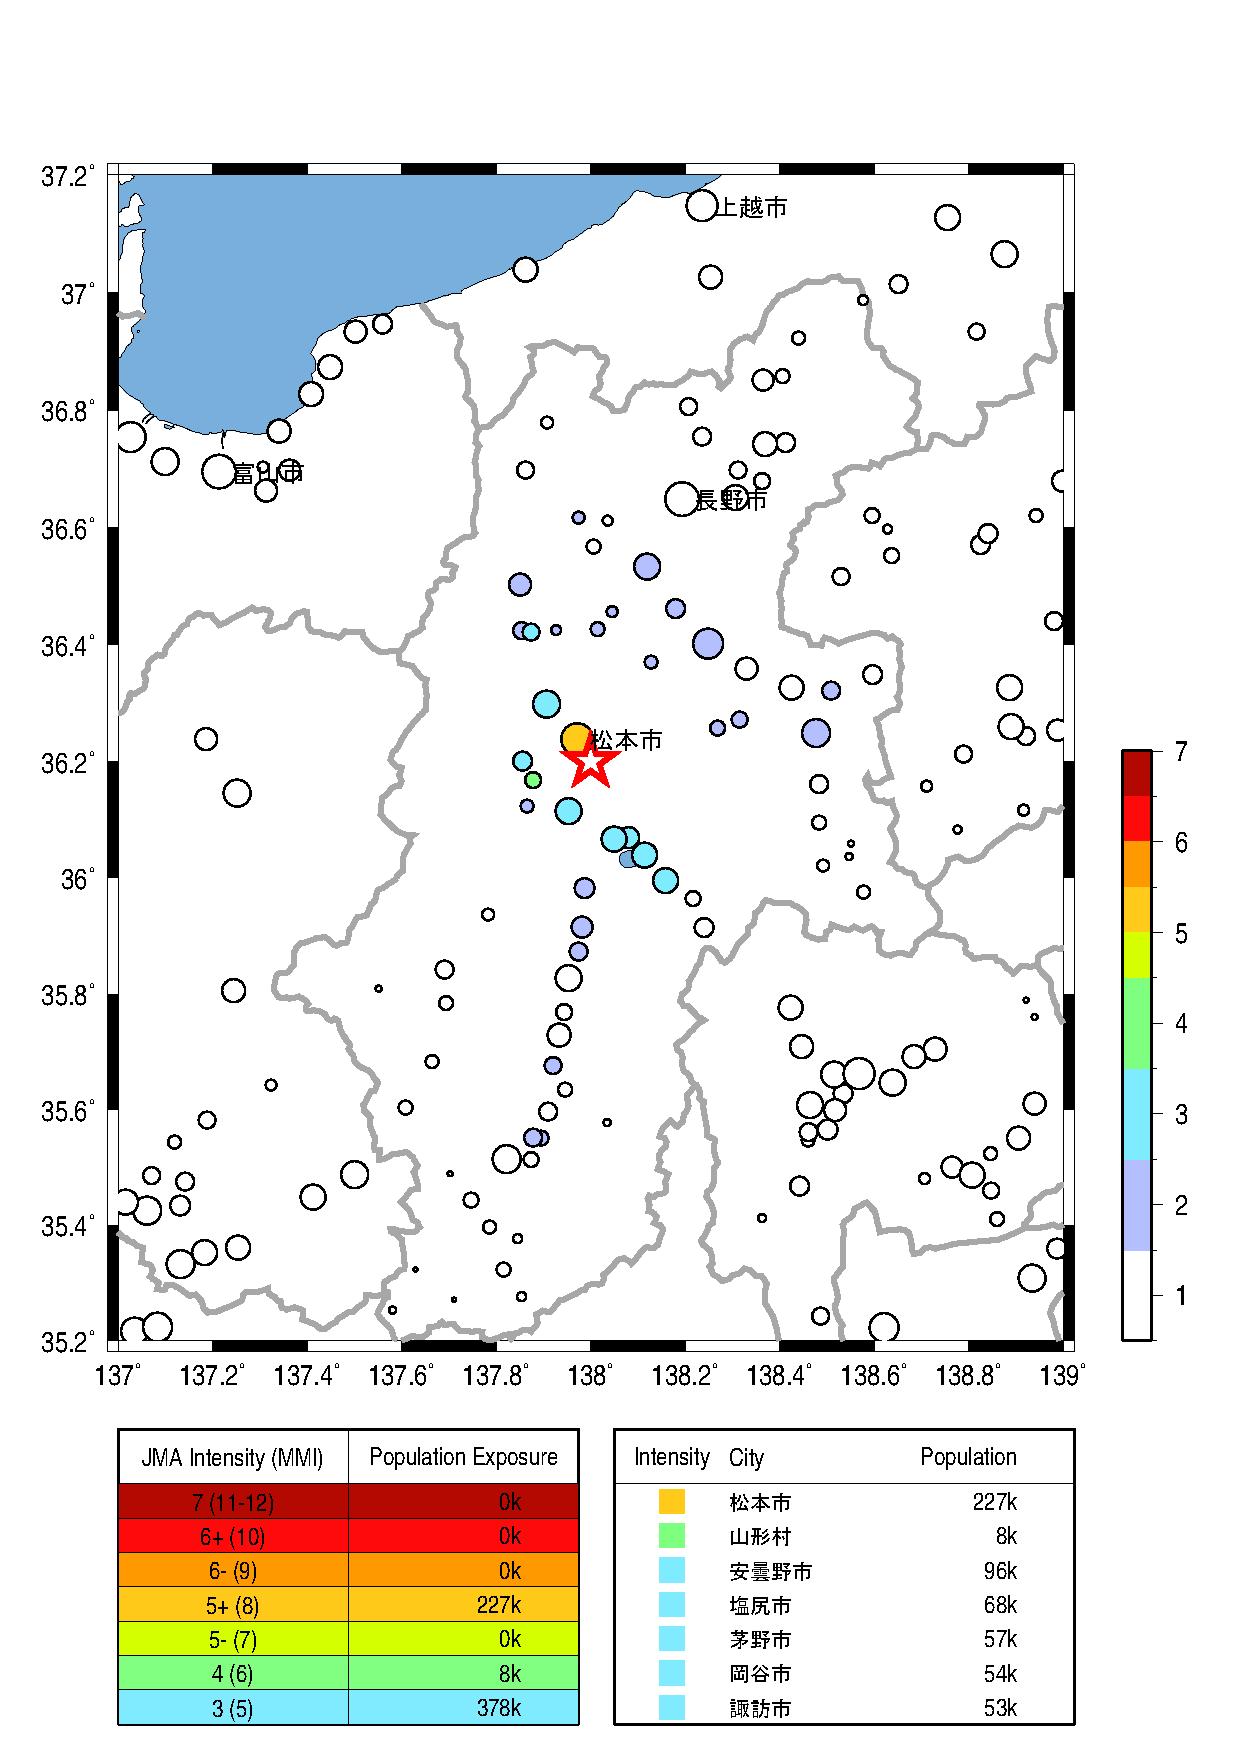
Fig.5. Population exposure. A circle size shows the population at the town, and a circle color shows the seismic intensity at the town.
Wu, Y. M. and H. Kanamori (2005). Experiment on an onsite early warning method for the Taiwan early warning system, Bull. Seism. Soc. Am., 95, 347-353.
気象庁の震度情報、防災科学技術研究所のK-NET,KiK-netの波形を利用しました。
緊急地震速報を発表した地震の解析結果
山田真澄 ホーム