━━━━━━━━━━━━━━━━━━━━━━━━
2011年4月11日 福島県浜通りの地震
━━━━━━━━━━━━━━━━━━━━━━━━
1.地震について (Earthquake Information)
----------------------------------------------------
2011/04/11,17:16:12.088 36.9453 140.6735 7.1 6.8
----------------------------------------------------
Table1. Earthquake information. Origin time, Epicentral latitude, longitude, depth, and JMA magnitude from the left.(ref. JMA source mechanism)
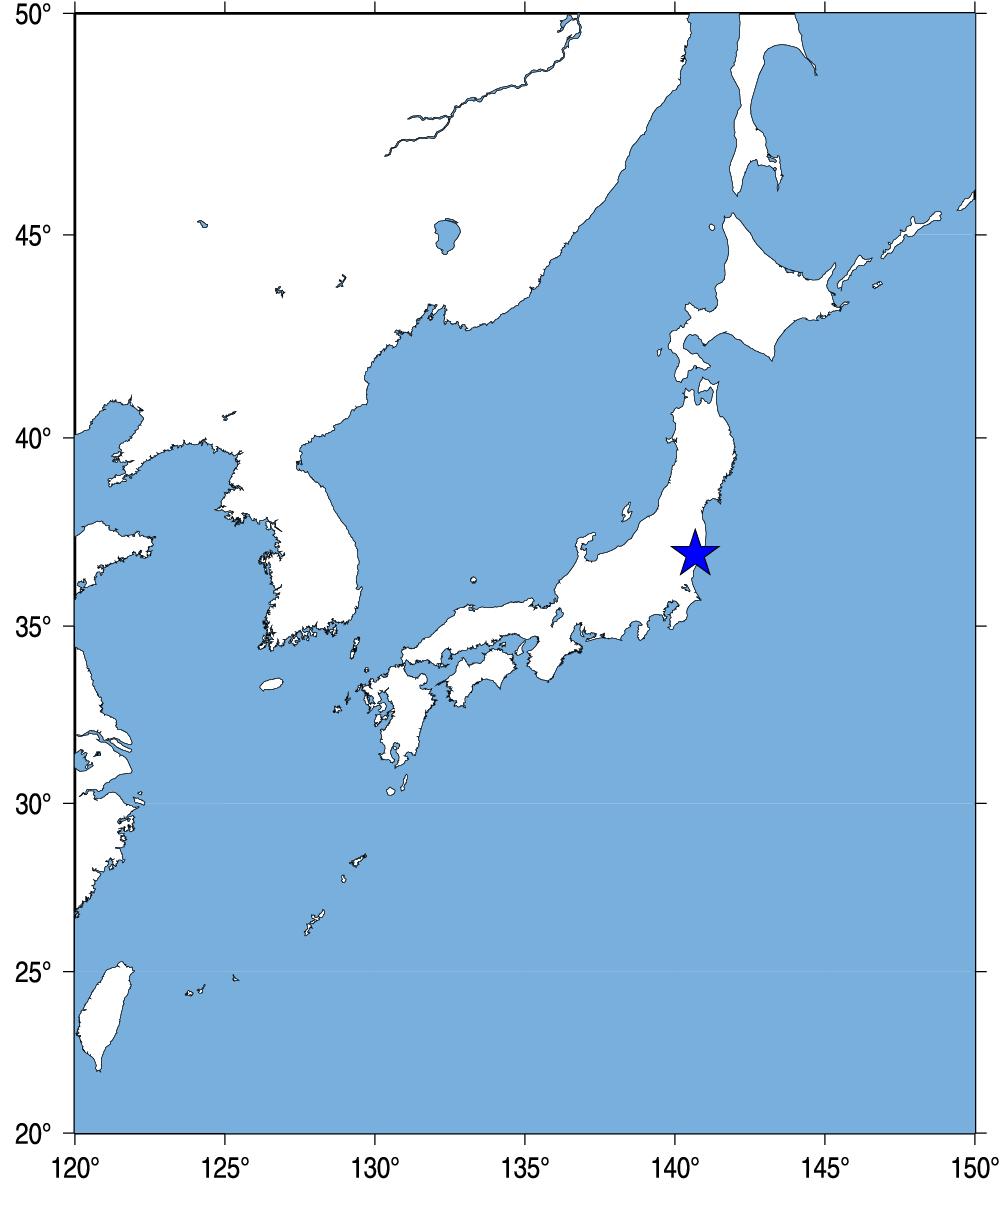
Fig.1. Event location.
2.観測点分布 (Station Distribution)
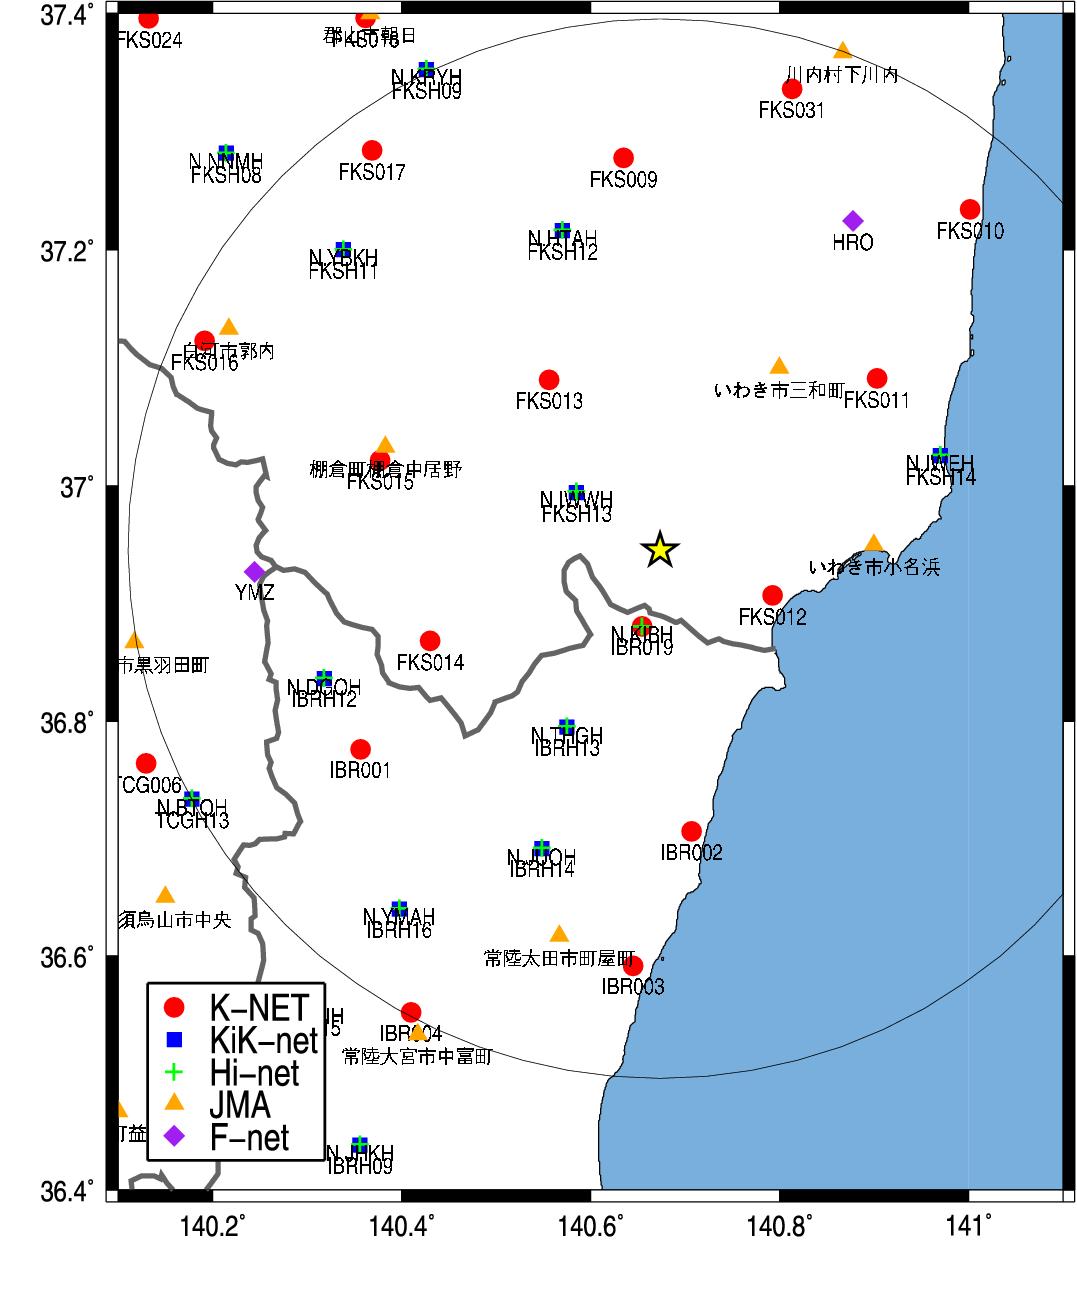
Fig.2. Station Distribution.
3.緊急地震速報発信状況 (Earthquake Early Warning Report)
-------------------------------------------------------------------[01] 11/04/11-17:16:12 5+ M6.4 37.1N 140.6E 010km (11/04/11-17:16:19)
[03] 11/04/11-17:16:13 5+ M6.6 37.1N 140.7E 010km (11/04/11-17:16:22)
[04] 11/04/11-17:16:12 6+ M7.1 36.9N 140.7E 010km (11/04/11-17:16:22)
[07] 11/04/11-17:16:11 6+ M7.1 36.9N 140.7E 010km (11/04/11-17:16:27)
[08] 11/04/11-17:16:11 6+ M7.0 36.9N 140.7E 010km (11/04/11-17:16:39)
[09] 11/04/11-17:16:11 6+ M7.1 36.9N 140.7E 010km (11/04/11-17:16:46)
[10] 11/04/11-17:16:11 6+ M7.1 36.9N 140.7E 010km (11/04/11-17:17:06)
[11] 11/04/11-17:16:11 6+ M7.1 36.9N 140.7E 010km (11/04/11-17:17:22)
---------------------------------------------------------------------
(左から順に情報番号,震源時,最大予測震度,マグニチュード, 震央緯度,震央経度,震源深さ,電文発表時刻) from CEORKA
-------------------------------------------------------------------
Table2. Earthquake early warning reports. Information ID, Origin time, Maximum Intensity, JMA magnitude, Epicentral latitude, longitude, depth, and time to issue the report from the left.(ref. The Committee of Earthquake Observation and Research in the Kansai Area)
--> 気象庁による緊急地震速報の内容
4.解析結果 (Analytical Result)
-------------------------------------------------------
FKS0121104111716 140.793 36.907 2.364 2.482 11.460 7.1 6.3
IBRH131104111716 140.575 36.796 0.679 3.542 18.801 7.1 5.1
FKS0131104111716 140.556 37.090 2.210 3.612 19.148 7.1 6.2
FKS0141104111716 140.430 36.868 1.892 4.342 23.323 7.1 6.1
FKS0111104111716 140.904 37.091 1.863 4.942 26.092 7.1 6.1
IBR0021104111716 140.707 36.706 0.970 4.992 26.711 7.1 5.5
IBRH141104111716 140.548 36.692 0.926 5.462 30.224 7.1 5.4
FKS0151104111716 140.378 37.022 2.515 5.112 27.683 7.1 6.3
FKSH141104111716 140.970 37.026 2.822 5.702 27.907 7.1 6.4
IBR0011104111716 140.357 36.776 1.322 6.122 33.906 7.1 5.7
Observed/Estimated Mw(median) 7.1 6.1
-------------------------------------------------------
Table3. Analytical results using Tau_c method (Wu and Kanamori, 2005). Station ID, Station longitude, latitude, tauc, P-arrival time, epicentral distance(km) , magnitude, and estimated magnitude from the left.
5.観測記録 (Observed Records)
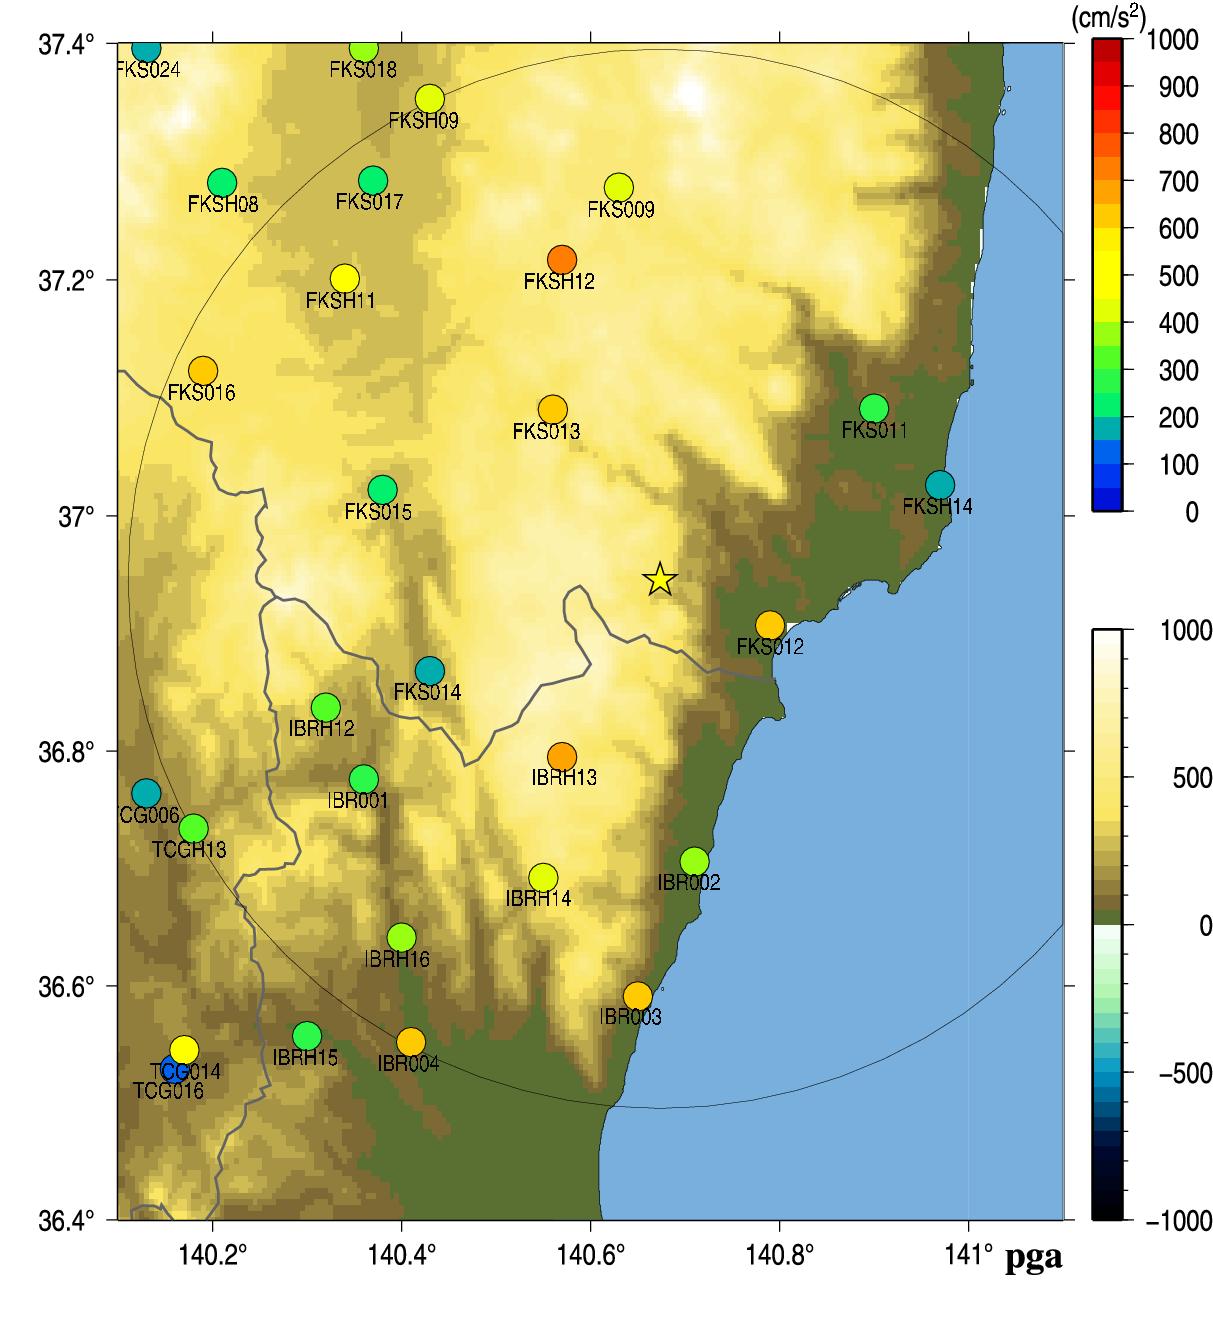
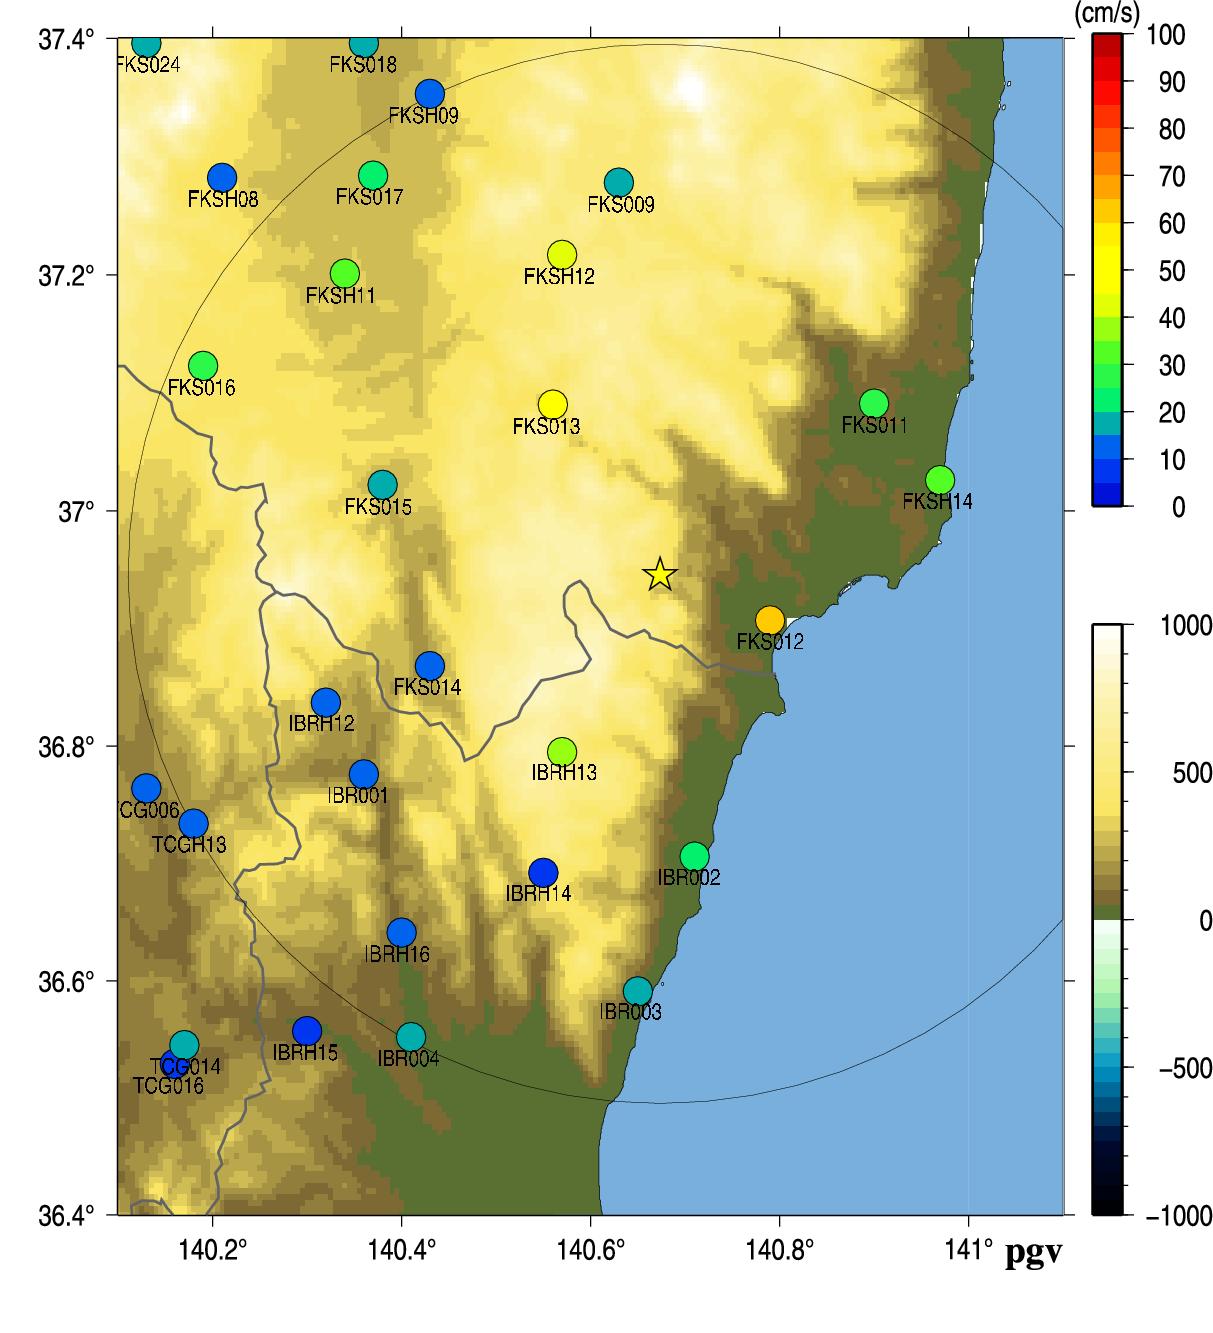
Fig.3. Peak Ground Acceleration (left) and Peak Ground Velocity (right).
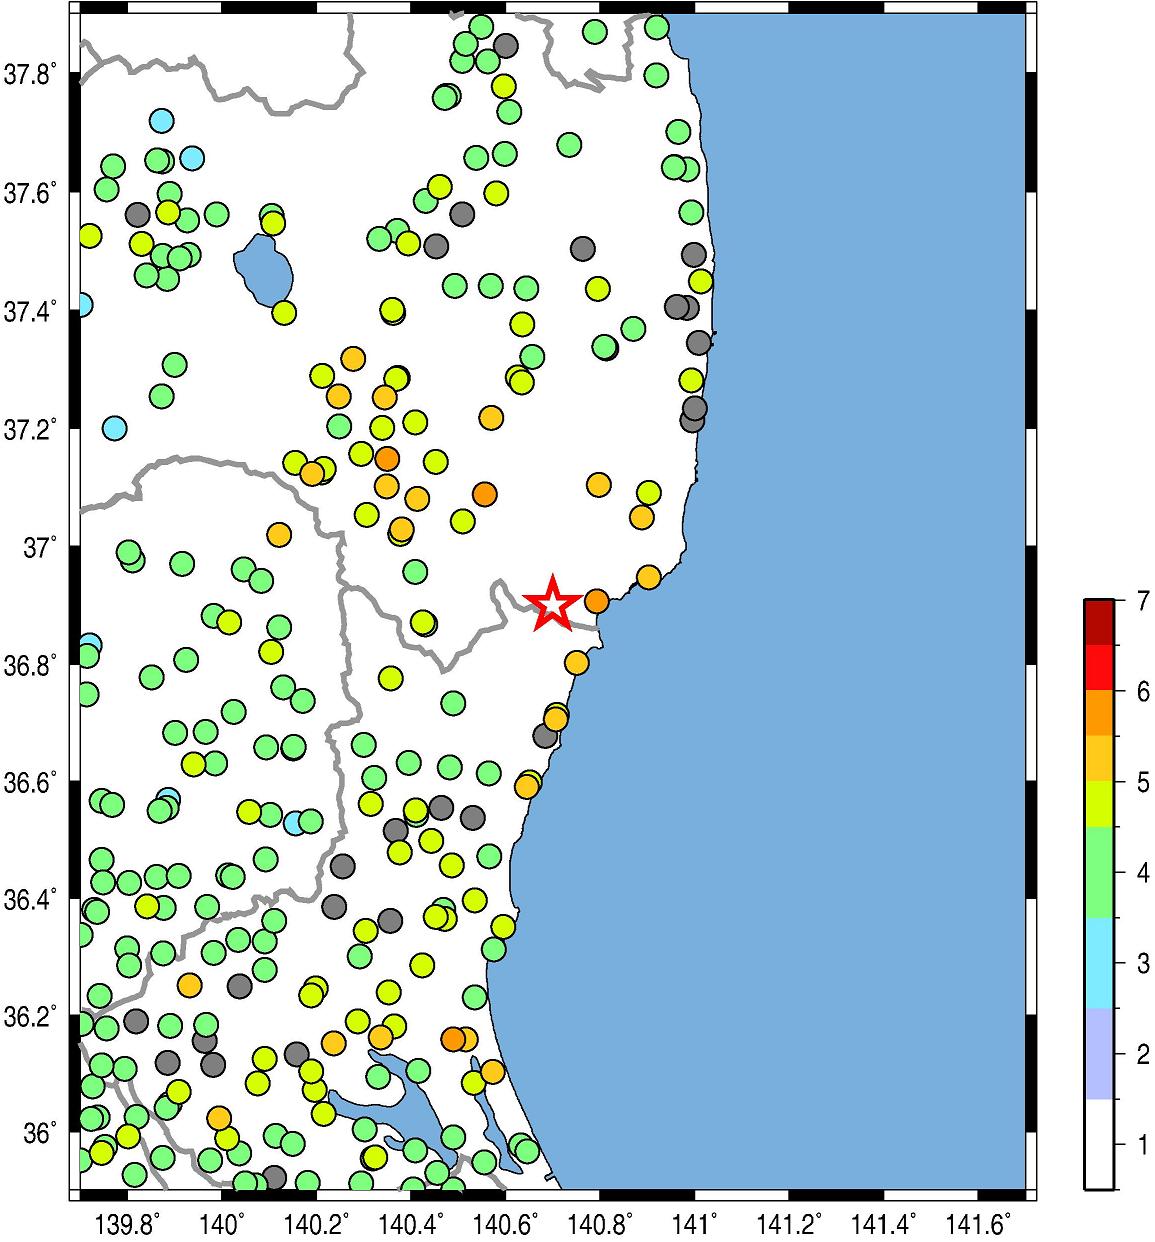
Fig.4. JMA seismic intensity.
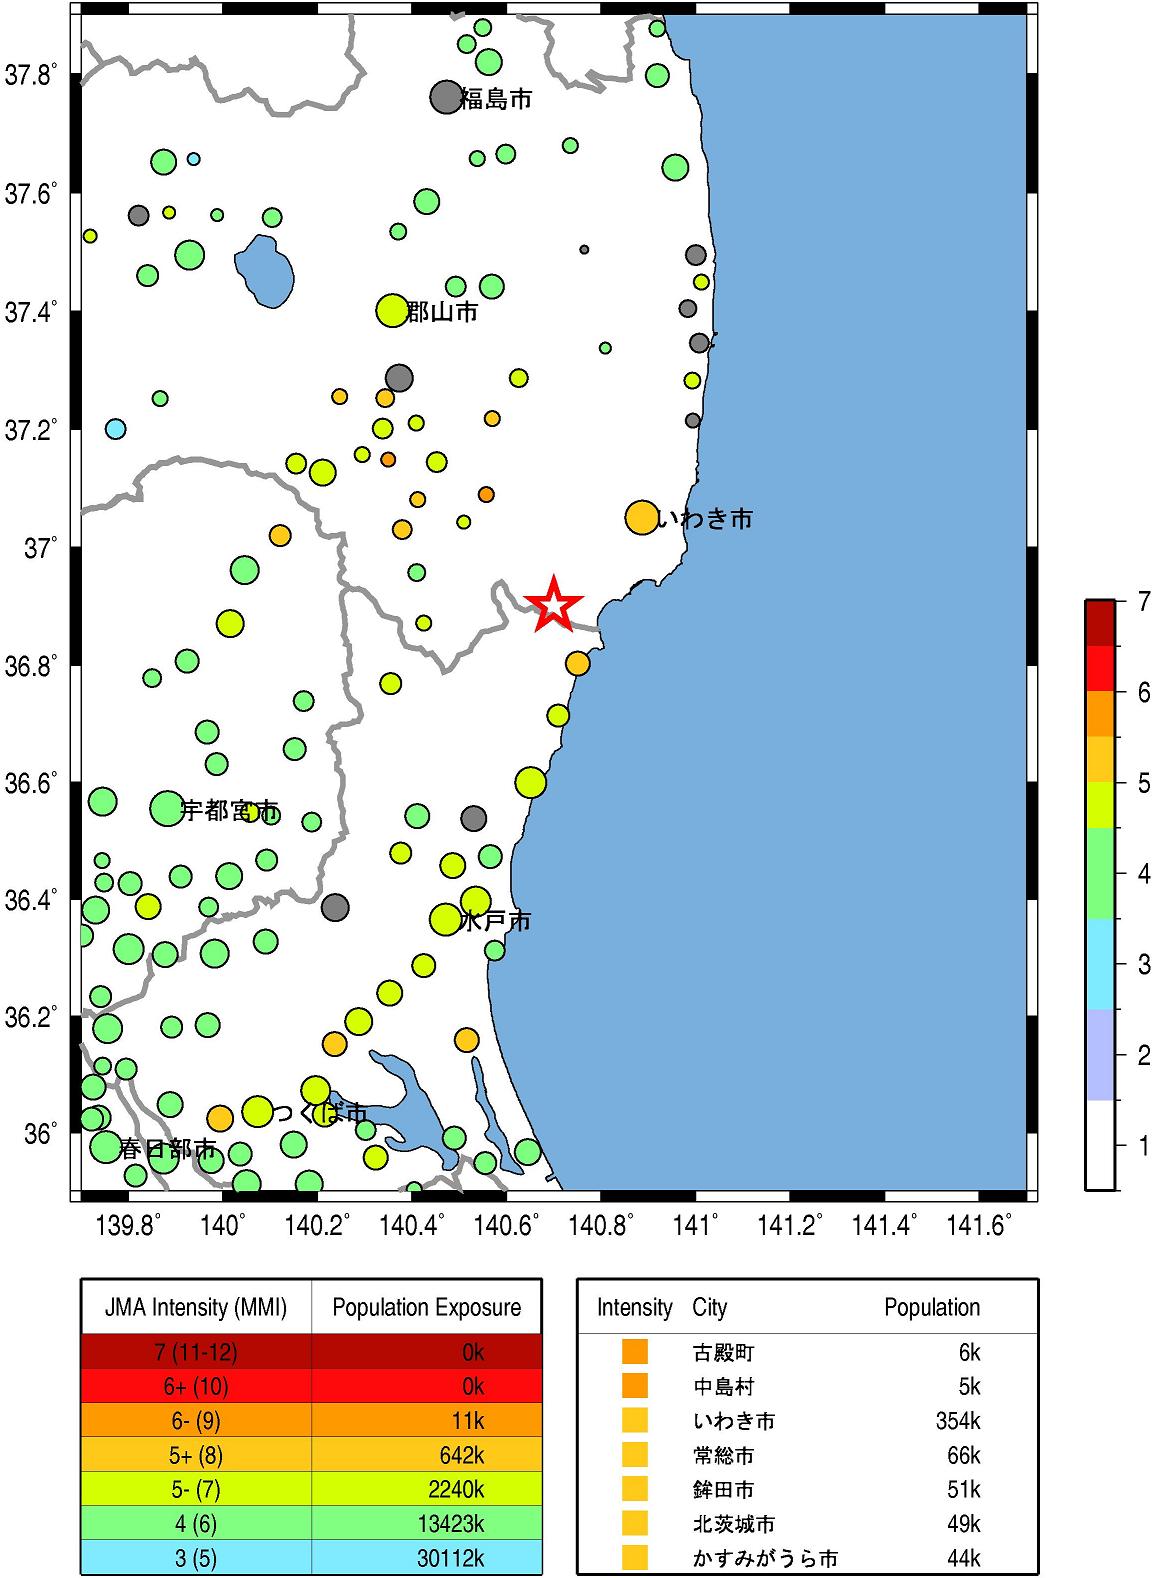
Fig.5. Population exposure. A circle size shows the population at the town, and a circle color shows the seismic intensity at the town.
Wu, Y. M. and H. Kanamori (2005). Experiment on an onsite early warning method for the Taiwan early warning system, Bull. Seism. Soc. Am., 95, 347-353.
気象庁の震度情報、防災科学技術研究所のK-NET,KiK-netの波形を利用しました。
緊急地震速報を発表した地震の解析結果
山田真澄 ホーム