━━━━━━━━━━━━━━━━━━━━━━━━
2011年4月7日 宮城県沖の地震
━━━━━━━━━━━━━━━━━━━━━━━━
1.地震について (Earthquake Information)
----------------------------------------------------
2011/04/07,23:32:44.088 38.2141 141.9185 62.9 7.4
----------------------------------------------------
Table1. Earthquake information. Origin time, Epicentral latitude, longitude, depth, and JMA magnitude from the left.(ref. JMA source mechanism)
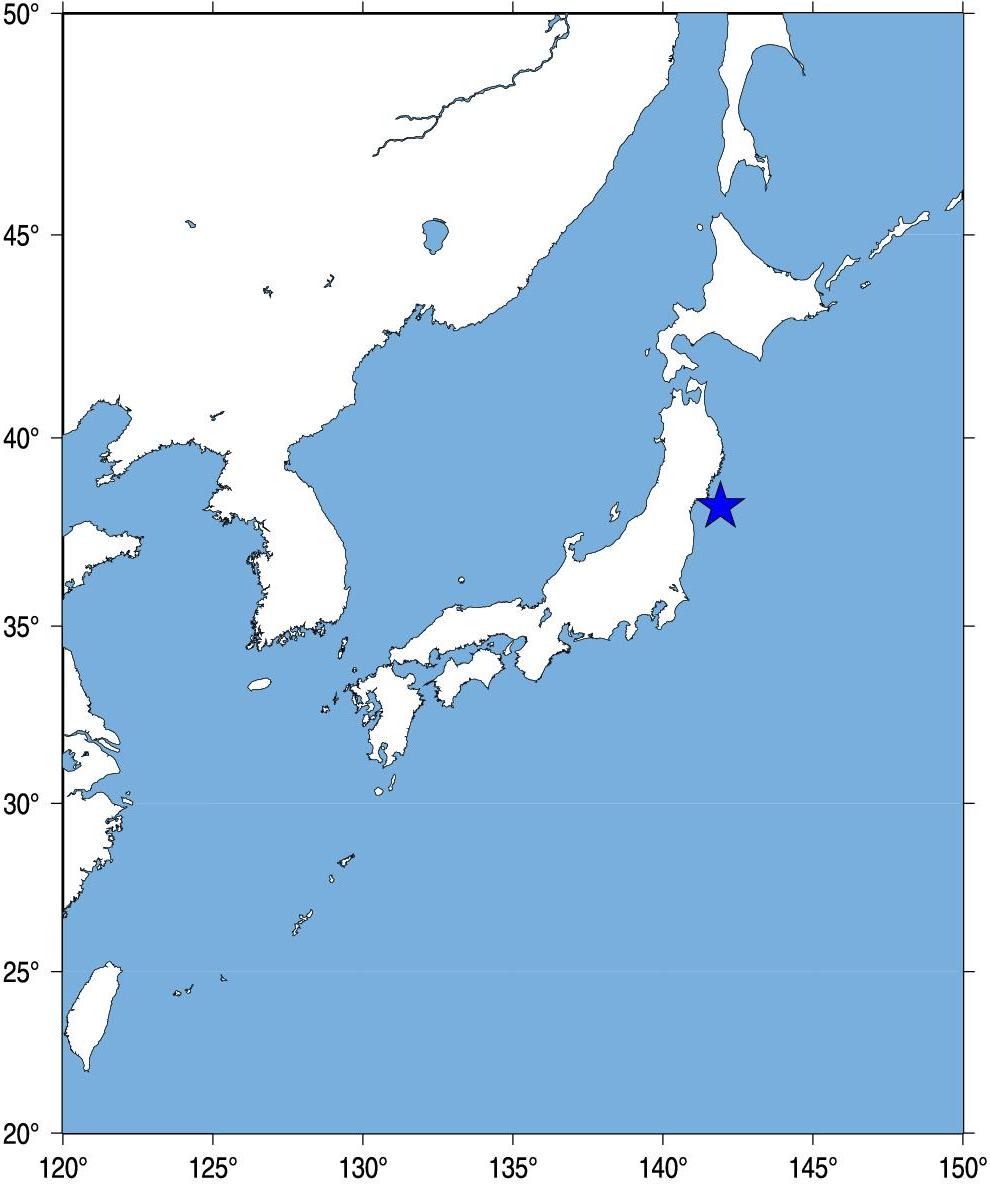
Fig.1. Event location.
2.観測点分布 (Station Distribution)
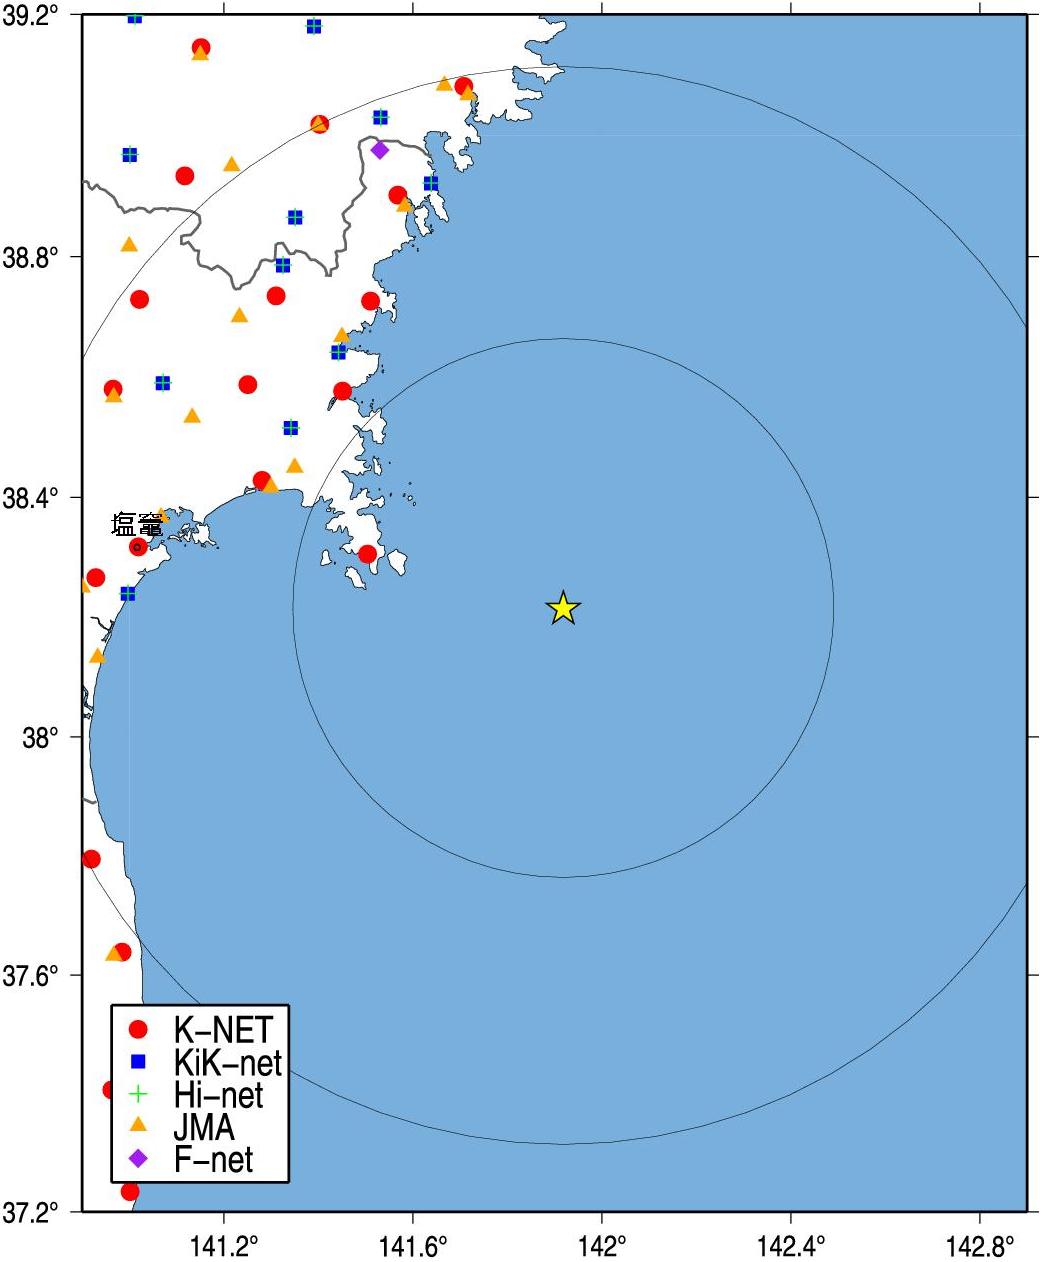
Fig.2. Station Distribution.
3.緊急地震速報発信状況 (Earthquake Early Warning Report)
-------------------------------------------------------------------[01] 11/04/07-23:32:48 5- M6.8 38.2N 141.7E 010km (11/04/07-23:32:59)
[06] 11/04/07-23:32:43 5+ M7.1 38.2N 141.9E 060km (11/04/07-23:33:07)
[07] 11/04/07-23:32:44 6- M7.4 38.2N 141.9E 060km (11/04/07-23:33:16)
[08] 11/04/07-23:32:44 6- M7.4 38.2N 141.9E 060km (11/04/07-23:33:26)
[09] 11/04/07-23:32:43 6- M7.4 38.2N 142.0E 040km (11/04/07-23:33:46)
[10] 11/04/07-23:32:43 5+ M7.4 38.2N 142.1E 050km (11/04/07-23:34:06)
[11] 11/04/07-23:32:42 5+ M7.4 38.2N 142.1E 050km (11/04/07-23:34:10)
---------------------------------------------------------------------
(左から順に情報番号,震源時,最大予測震度,マグニチュード, 震央緯度,震央経度,震源深さ,電文発表時刻) from CEORKA
-------------------------------------------------------------------
Table2. Earthquake early warning reports. Information ID, Origin time, Maximum Intensity, JMA magnitude, Epicentral latitude, longitude, depth, and time to issue the report from the left.(ref. The Committee of Earthquake Observation and Research in the Kansai Area)
--> 気象庁による緊急地震速報の内容
4.解析結果 (Analytical Result)
-------------------------------------------------------
file stlo stla tau_c triggr dist Mj Mest MYG0031104072332 141.311 38.735 0.786 14.242 78.454 7.4 5.3
MYG0121104072332 141.019 38.318 0.796 14.272 79.526 7.4 5.3
MYGH041104072332 141.329 38.783 0.983 14.642 81.455 7.4 5.5
MYGH061104072332 141.074 38.588 0.569 15.232 84.602 7.4 5.0
MYG0131104072332 140.929 38.266 1.032 15.232 86.793 7.4 5.5
IWTH051104072332 141.355 38.862 0.579 15.302 87.160 7.4 5.0
MYG0061104072332 140.965 38.580 1.796 16.062 92.644 7.4 6.0
MYG0151104072332 140.870 38.105 1.406 15.822 92.697 7.4 5.8
MYG0091104072332 140.887 38.447 1.613 15.942 93.777 7.4 5.9
MYGH081104072332 140.848 38.110 1.355 16.042 94.565 7.4 5.8
Observed/Estimated Mw(median) 7.4 5.5
-------------------------------------------------------
Table3. Analytical results using Tau_c method (Wu and Kanamori, 2005). Station ID, Station longitude, latitude, tauc, P-arrival time, epicentral distance(km) , magnitude, and estimated magnitude from the left.
5.観測記録 (Observed Records)
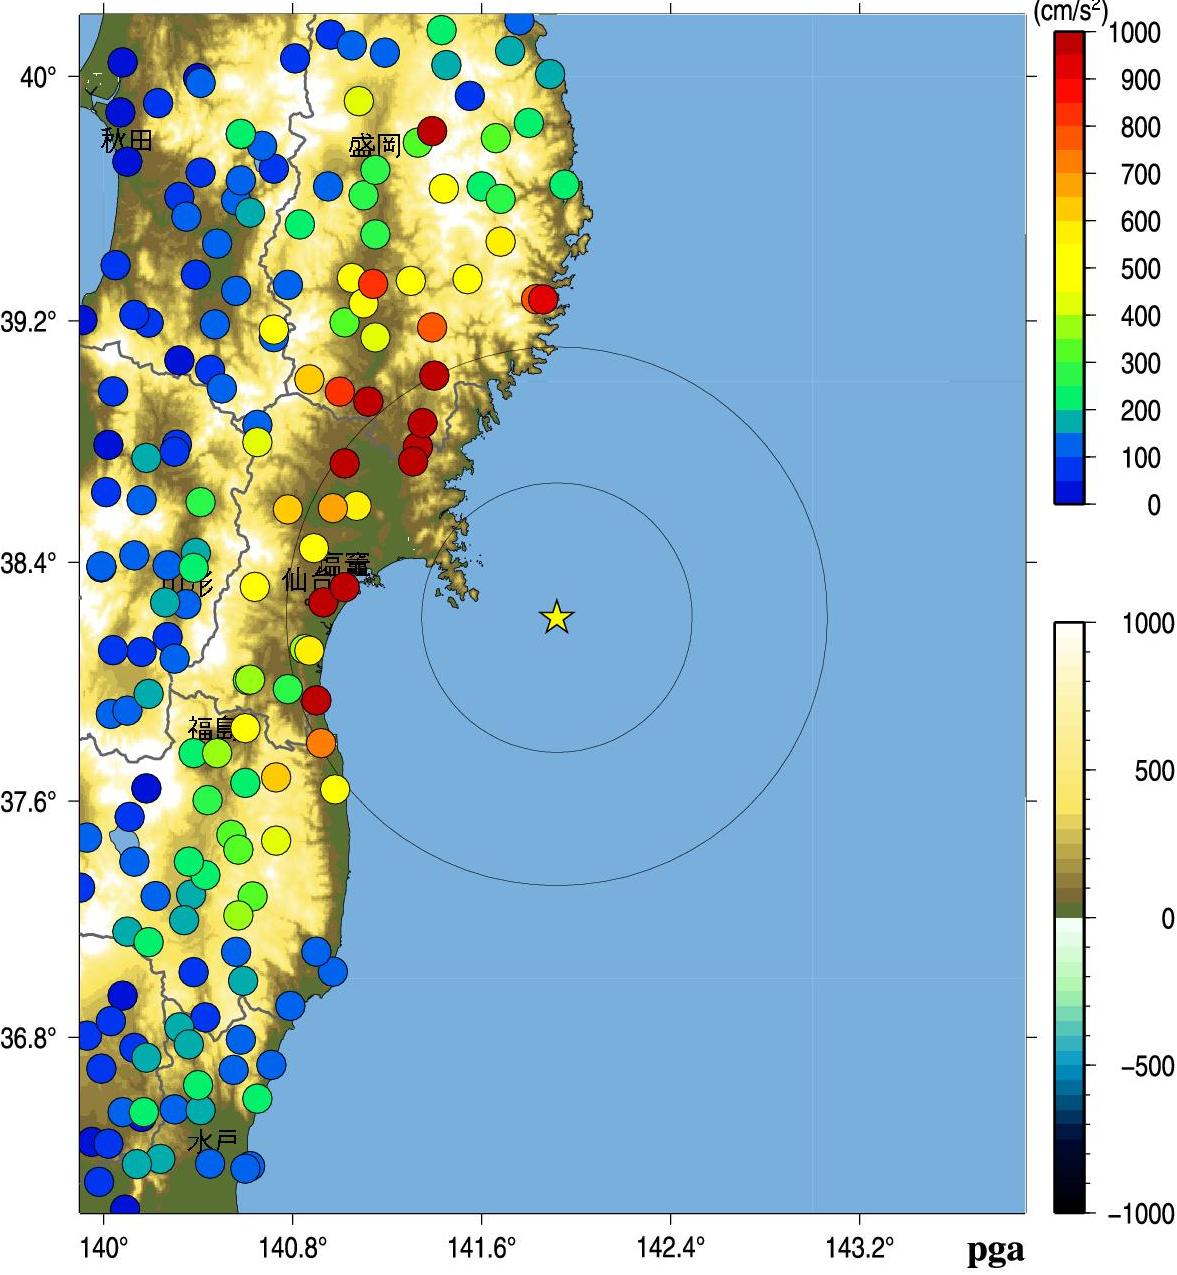
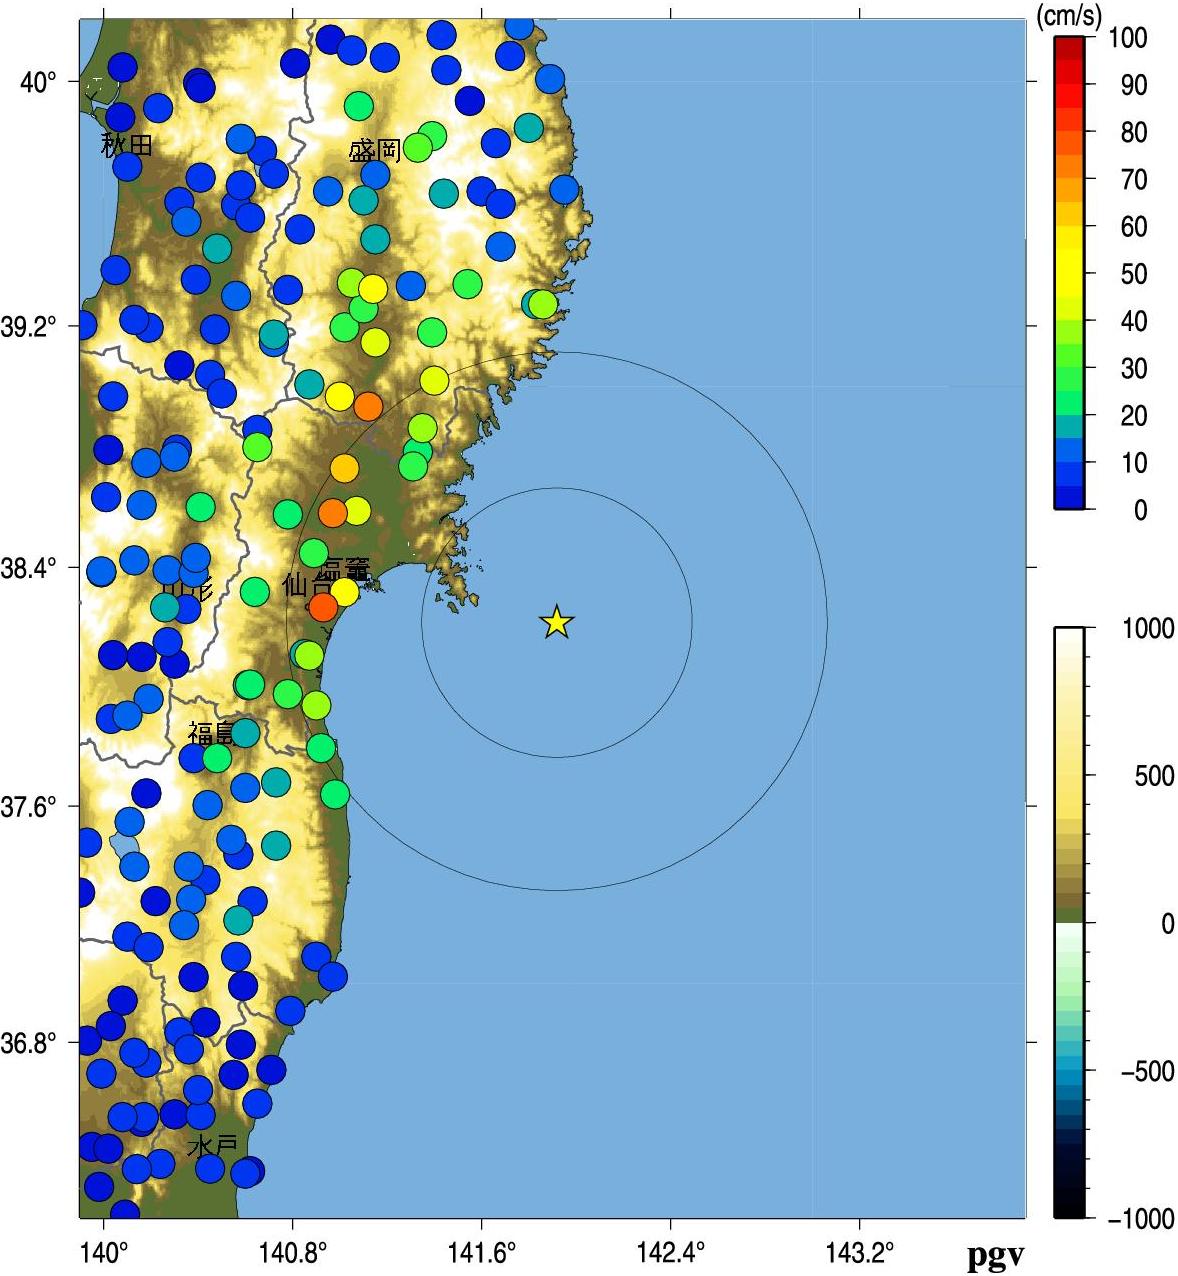
Fig.3. Peak Ground Acceleration (left) and Peak Ground Velocity (right).
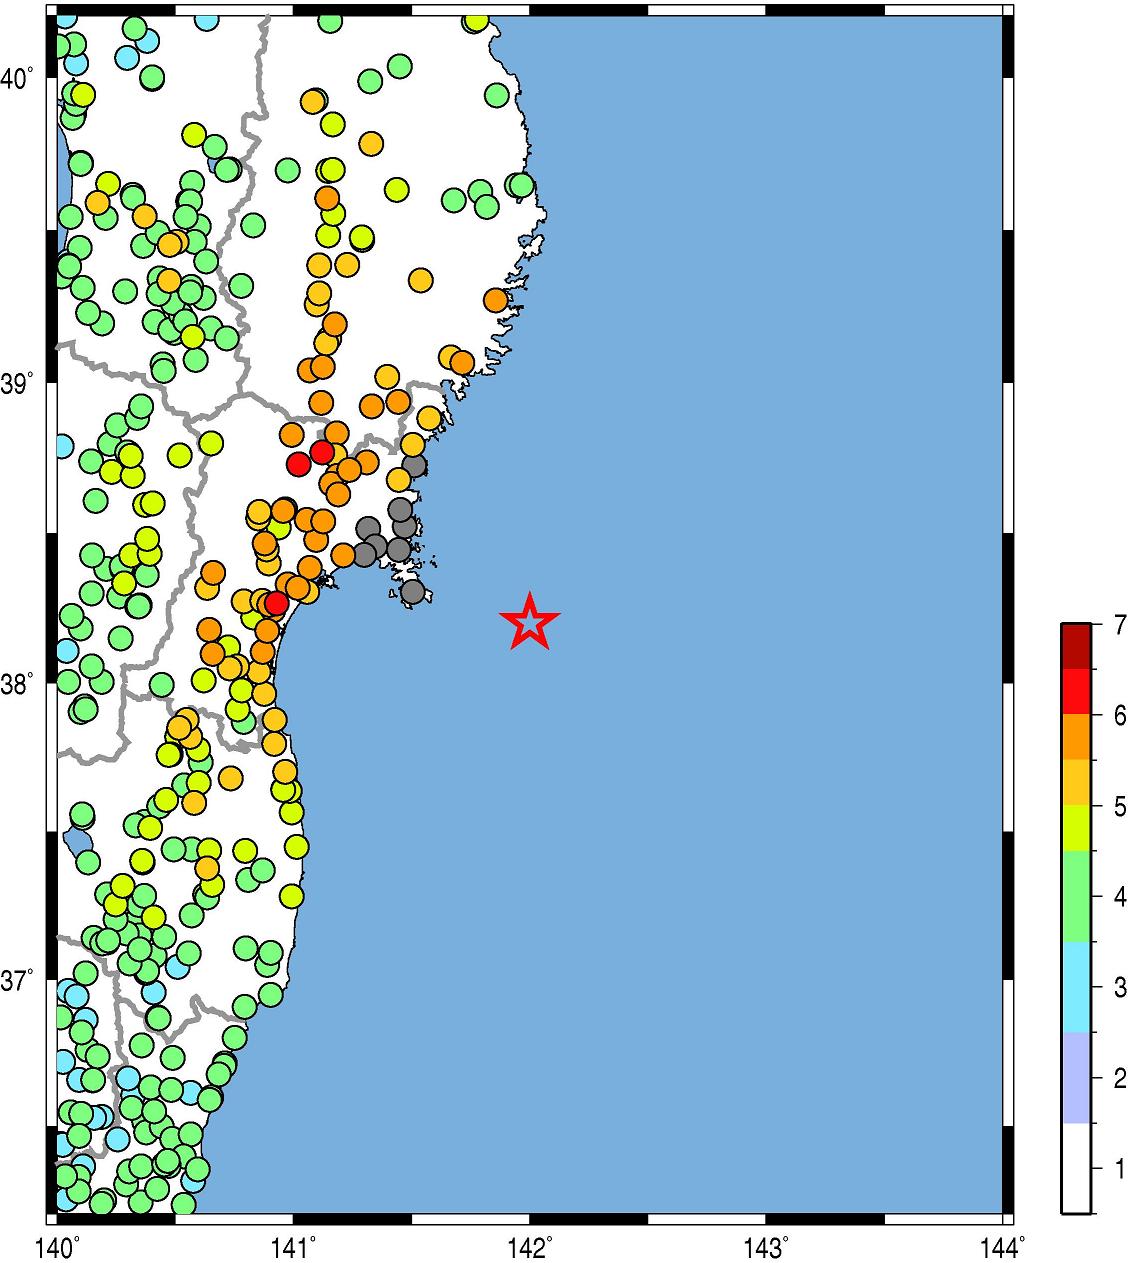
Fig.4. JMA seismic intensity.
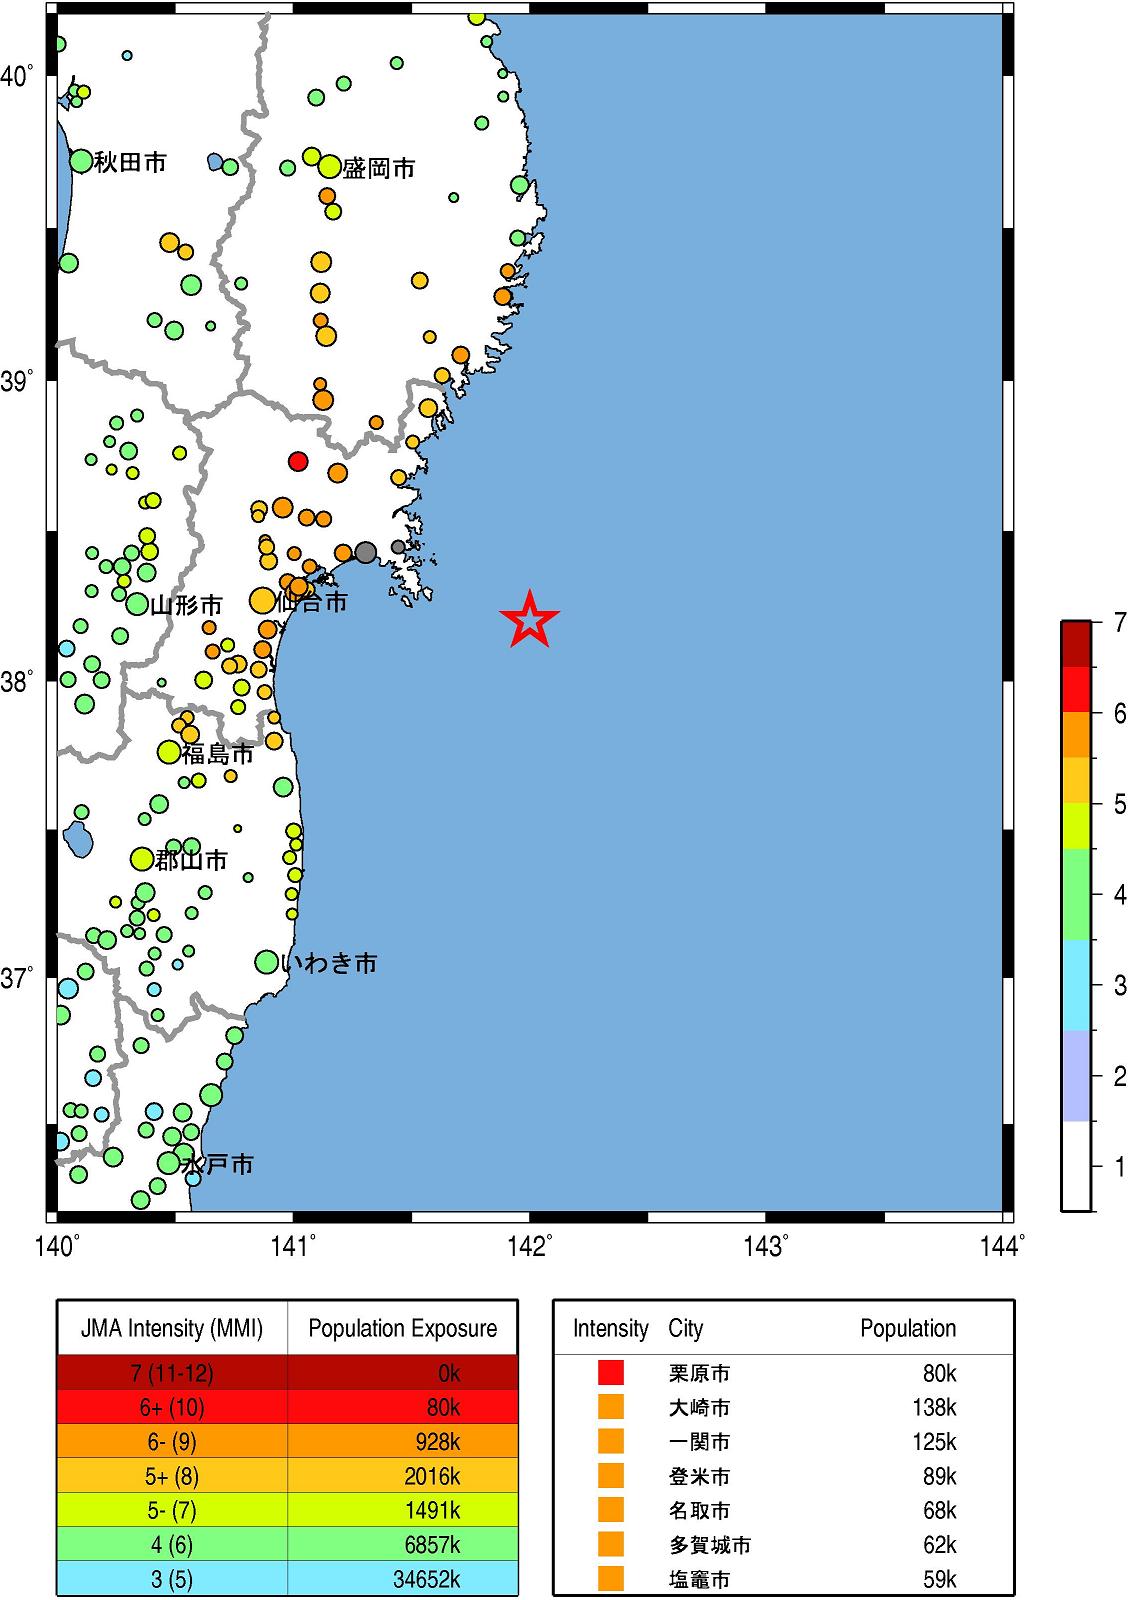
Fig.5. Population exposure. A circle size shows the population at the town, and a circle color shows the seismic intensity at the town.
Wu, Y. M. and H. Kanamori (2005). Experiment on an onsite early warning method for the Taiwan early warning system, Bull. Seism. Soc. Am., 95, 347-353.
気象庁の震度情報、防災科学技術研究所のK-NET,KiK-netの波形を利用しました。
緊急地震速報を発表した地震の解析結果
山田真澄 ホーム