━━━━━━━━━━━━━━━━━━━━━━━━
2011年2月27日5時 飛騨地方の地震
━━━━━━━━━━━━━━━━━━━━━━━━
1.地震について (Earthquake Information)
----------------------------------------------------
2011/02/27,05:38:02.716 36.1471 137.4490 5.1 5.2
----------------------------------------------------
Table1. Earthquake information. Origin time, Epicentral latitude, longitude, depth, and JMA magnitude from the left.(ref. JMA source mechanism)
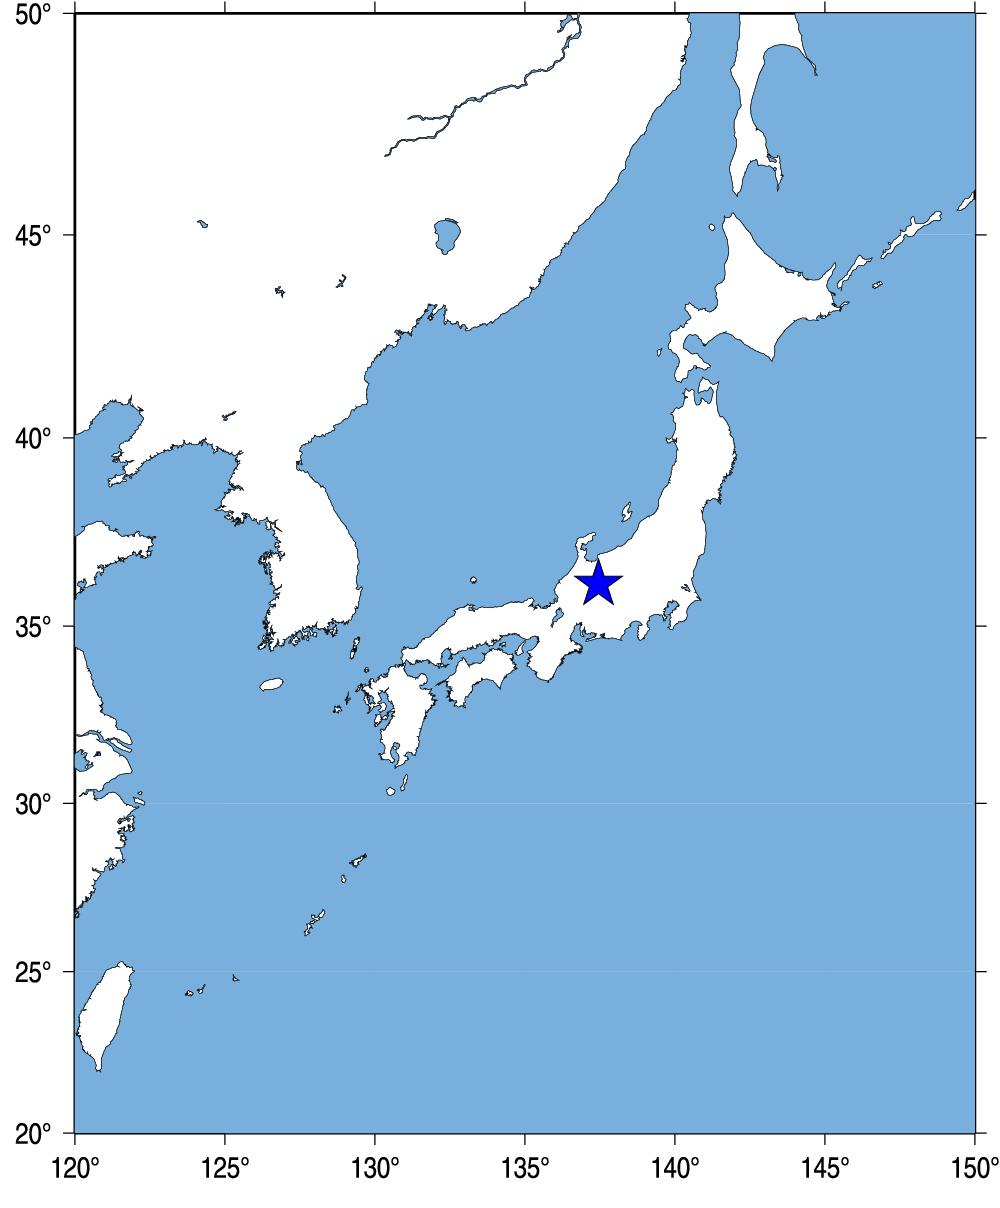
Fig.1. Event location.
2.観測点分布 (Station Distribution)
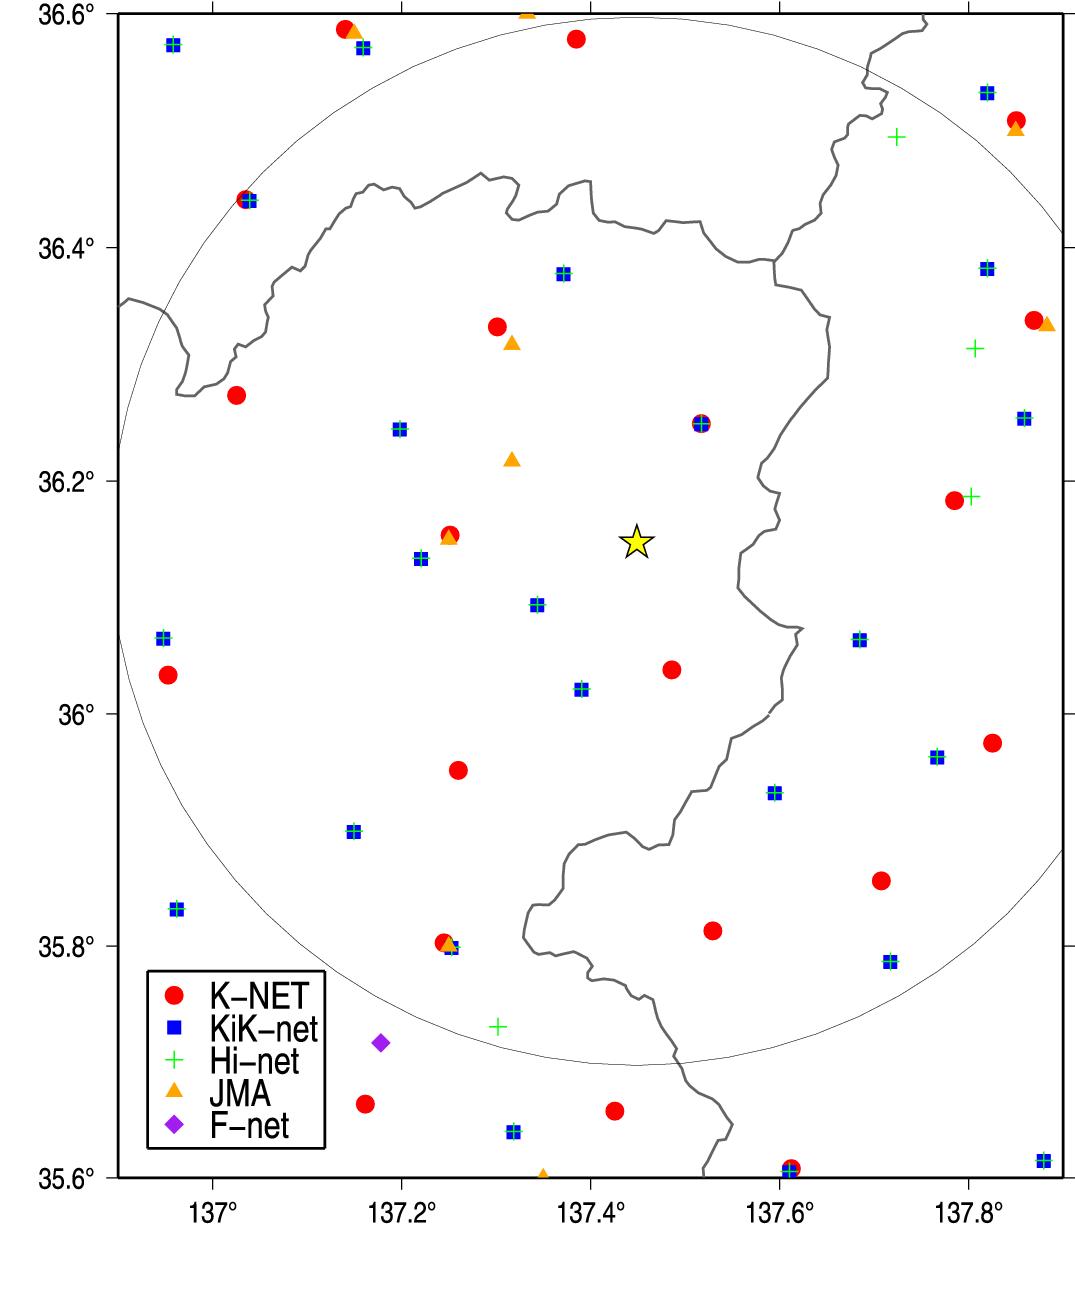
Fig.2. Station Distribution.
3.緊急地震速報発信状況 (Earthquake Early Warning Report)
-------------------------------------------------------------------[01] 11/02/27-05:38:03 04 M5.6 36.2N 137.5E 010km (11/02/27-05:38:11)
[02] 11/02/27-05:38:03 04 M5.5 36.2N 137.5E 010km (11/02/27-05:38:15)
[03] 11/02/27-05:38:03 03 M5.6 36.2N 137.5E 010km (11/02/27-05:38:16)
[04] 11/02/27-05:38:03 03 M5.7 36.1N 137.5E 010km (11/02/27-05:38:24)
[05] 11/02/27-05:38:03 03 M5.7 36.1N 137.5E 010km (11/02/27-05:38:35)
[06] 11/02/27-05:38:03 03 M5.6 36.1N 137.4E 010km (11/02/27-05:38:55)
[07] 11/02/27-05:38:03 03 M5.6 36.1N 137.4E 010km (11/02/27-05:38:57)
---------------------------------------------------------------------
(左から順に情報番号,震源時,最大予測震度,マグニチュード, 震央緯度,震央経度,震源深さ,電文発表時刻) from CEORKA
-------------------------------------------------------------------
Table2. Earthquake early warning reports. Information ID, Origin time, Maximum Intensity, JMA magnitude, Epicentral latitude, longitude, depth, and time to issue the report from the left.(ref. The Committee of Earthquake Observation and Research in the Kansai Area)
--> 気象庁による緊急地震速報の内容
4.解析結果 (Analytical Result)
-------------------------------------------------------
file stlo stla tau_c triggr dist Mj Mest GIF0072011022705 137.486 36.038 0.121 2.494 12.580 5.2 3.5
GIF0042011022705 137.517 36.249 0.099 2.294 12.891 5.2 3.4
GIF0052011022705 137.251 36.154 0.122 3.554 17.797 5.2 3.6
GIF0032011022705 137.301 36.332 0.063 4.334 24.452 5.2 2.9
GIF0082011022705 137.260 35.951 0.079 5.174 27.588 5.2 3.1
NGN0132011022705 137.785 36.183 0.205 5.444 30.515 5.2 4.0
NGN0182011022705 137.529 35.813 0.086 6.664 37.753 5.2 3.2
NGN0172011022705 137.826 35.975 0.086 6.914 38.937 5.2 3.2
NGN0192011022705 137.708 35.856 0.089 7.014 39.828 5.2 3.3
GIF0022011022705 137.025 36.273 0.117 7.004 40.597 5.2 3.5
Observed/Estimated Mw(median) 5.2 3.35
-------------------------------------------------------
Table3. Analytical results using Tau_c method (Wu and Kanamori, 2005). Station ID, Station longitude, latitude, tauc, P-arrival time, epicentral distance(km) , magnitude, and estimated magnitude from the left.
5.観測記録 (Observed Records)
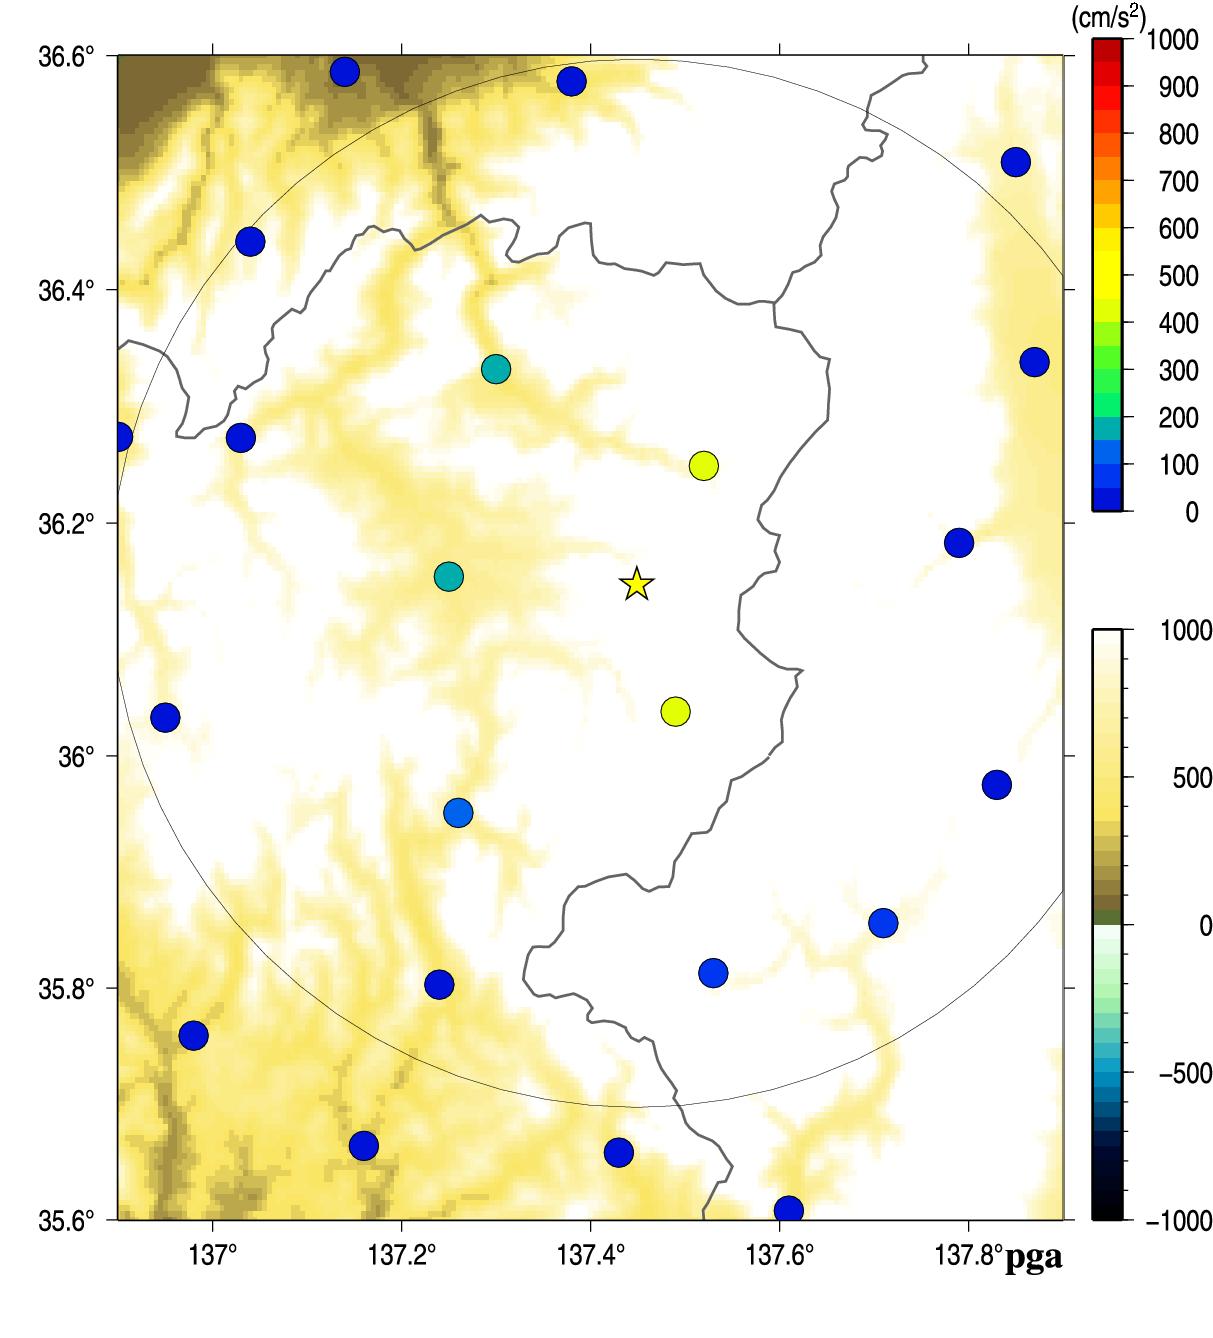
Fig.3. Peak Ground Acceleration.
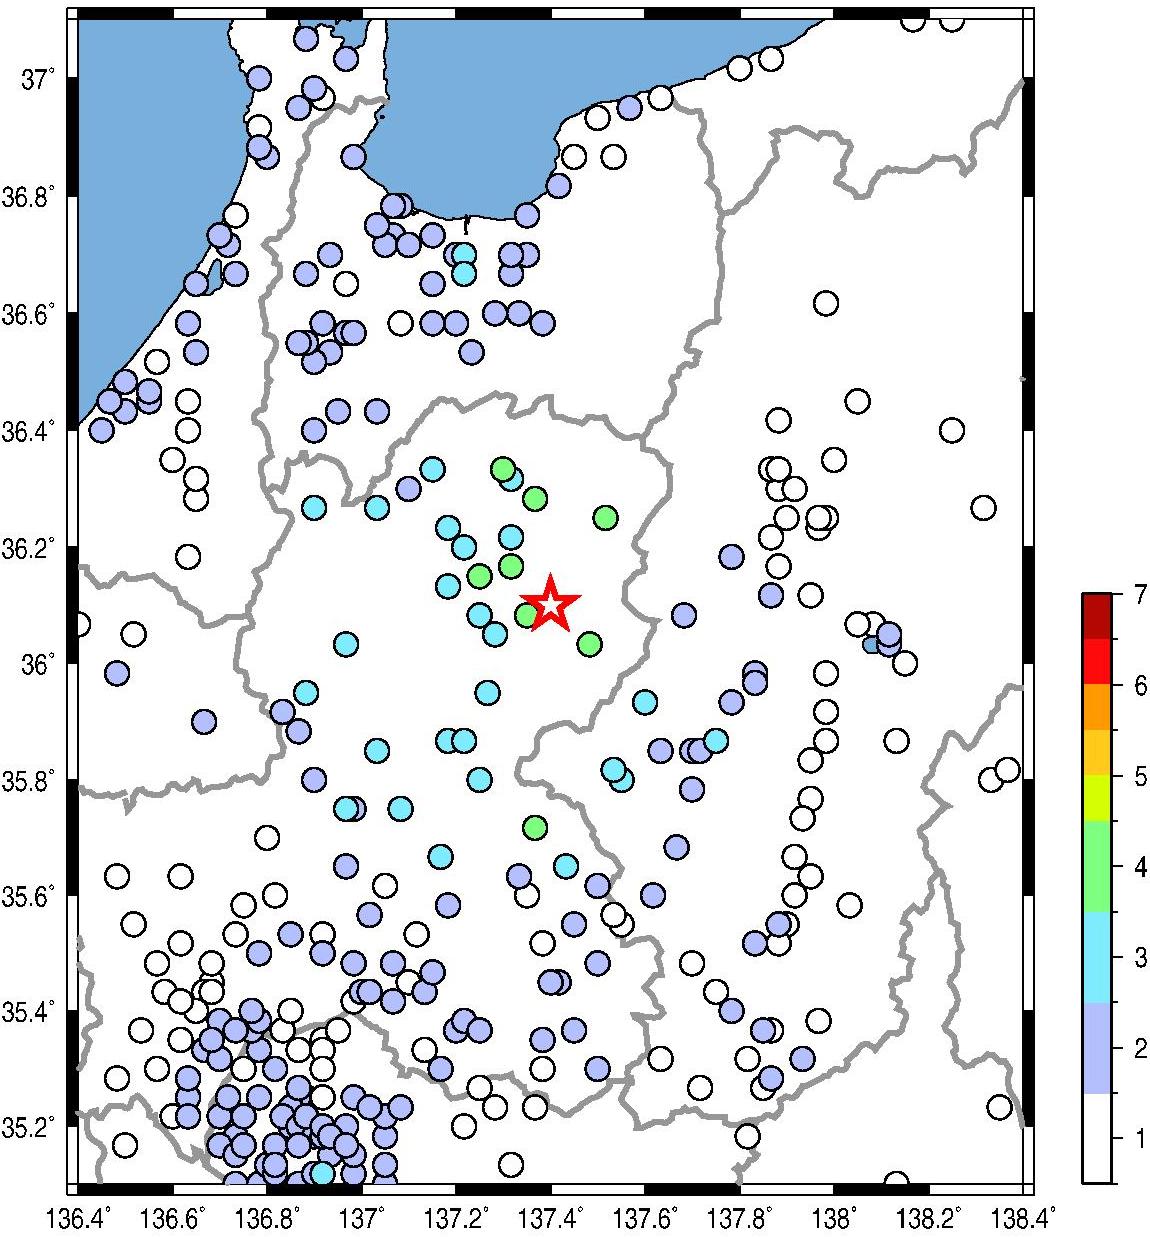
Fig.4. JMA seismic intensity.
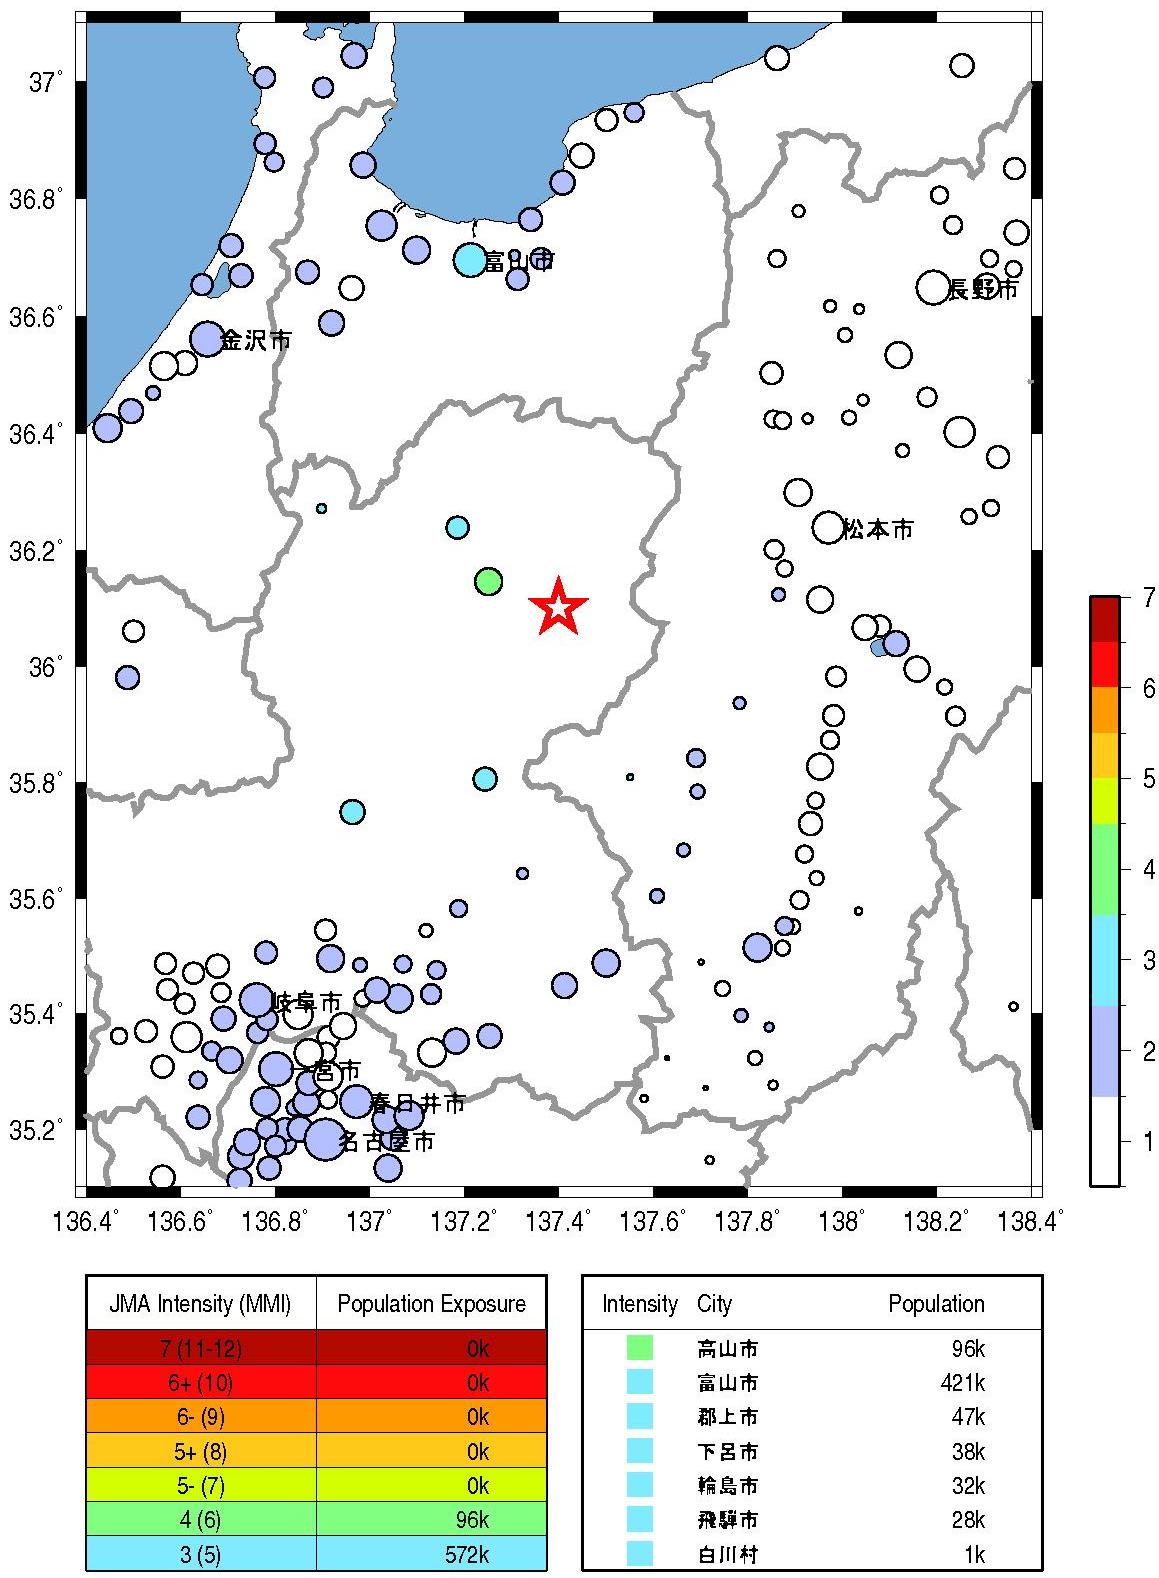
Fig.5. Population exposure. A circle size shows the population at the town, and a circle color shows the seismic intensity at the town.
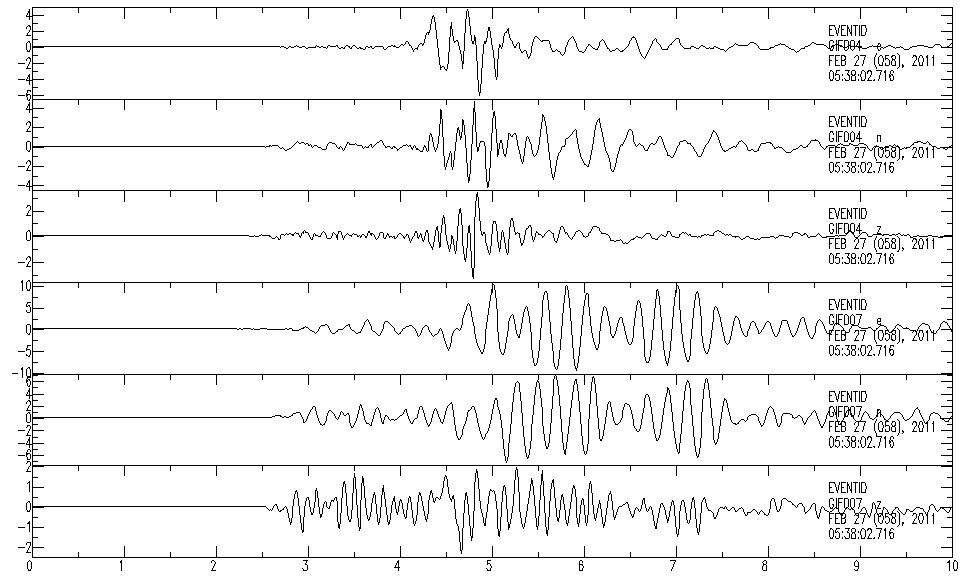
Fig.6. Acceleration waveforms.
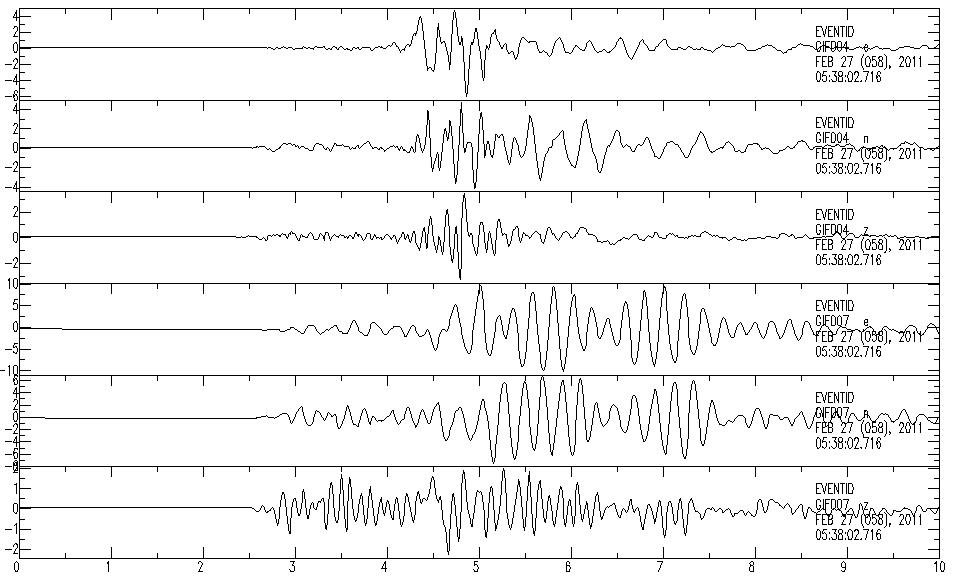
Fig.7. Velocity waveforms.
Wu, Y. M. and H. Kanamori (2005). Experiment on an onsite early warning method for the Taiwan early warning system, Bull. Seism. Soc. Am., 95, 347-353.
気象庁の震度情報、防災科学技術研究所のK-NET,KiK-netの波形を利用しました。
緊急地震速報を発表した地震の解析結果
山田真澄 ホーム