━━━━━━━━━━━━━━━━━━━━━━━━
2010年12月2日 北海道の地震
━━━━━━━━━━━━━━━━━━━━━━━━
1.地震について (Earthquake Information)
----------------------------------------------------
2010/12/02,06:44:02.688 42.9736 141.4333 4.6 4.5
----------------------------------------------------
Table1. Earthquake information. Origin time, Epicentral latitude, longitude, depth, and JMA magnitude from the left.(ref. JMA source mechanism)
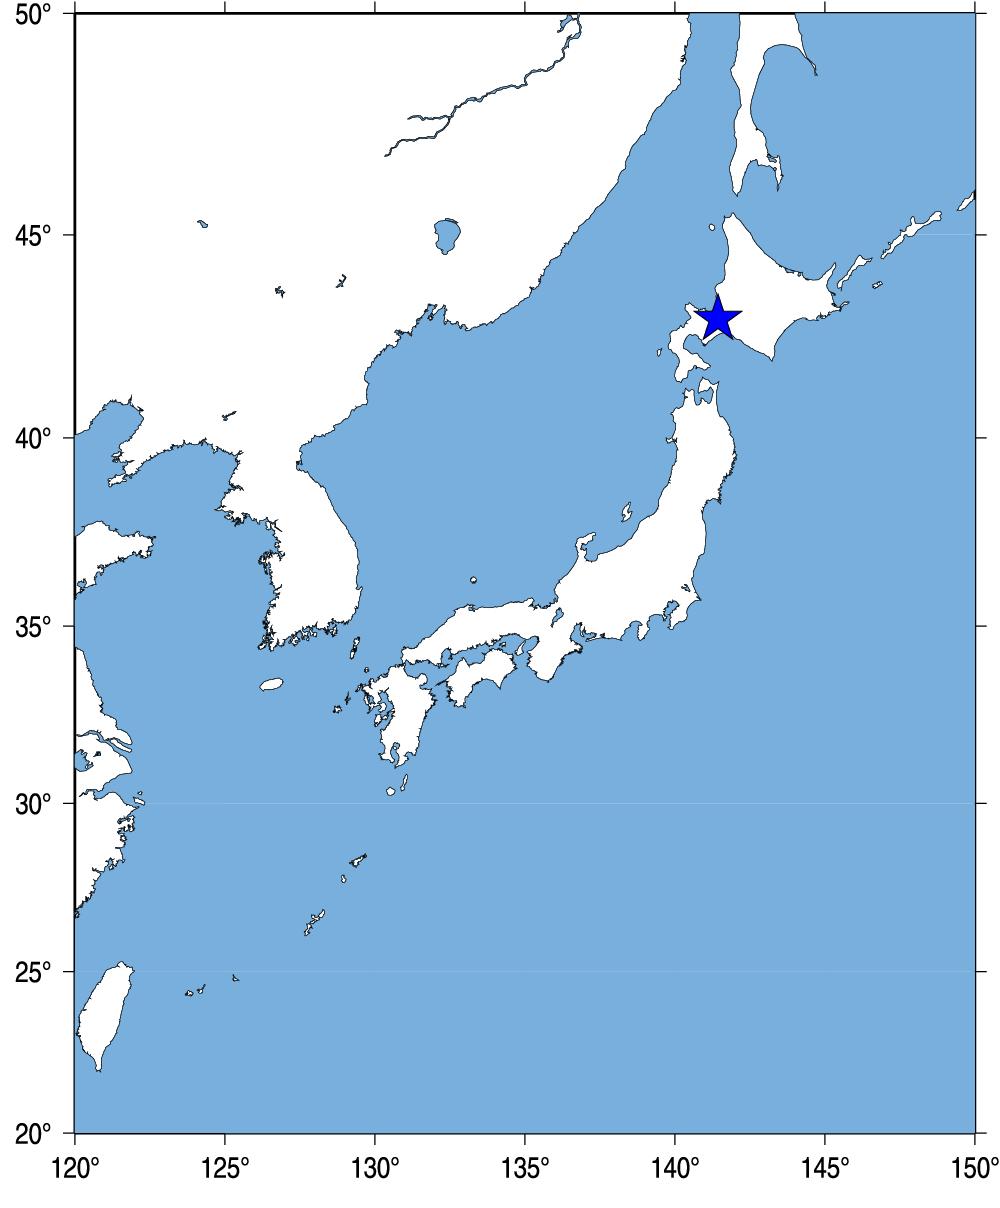
Fig.1. Event location.
2.観測点分布 (Station Distribution)
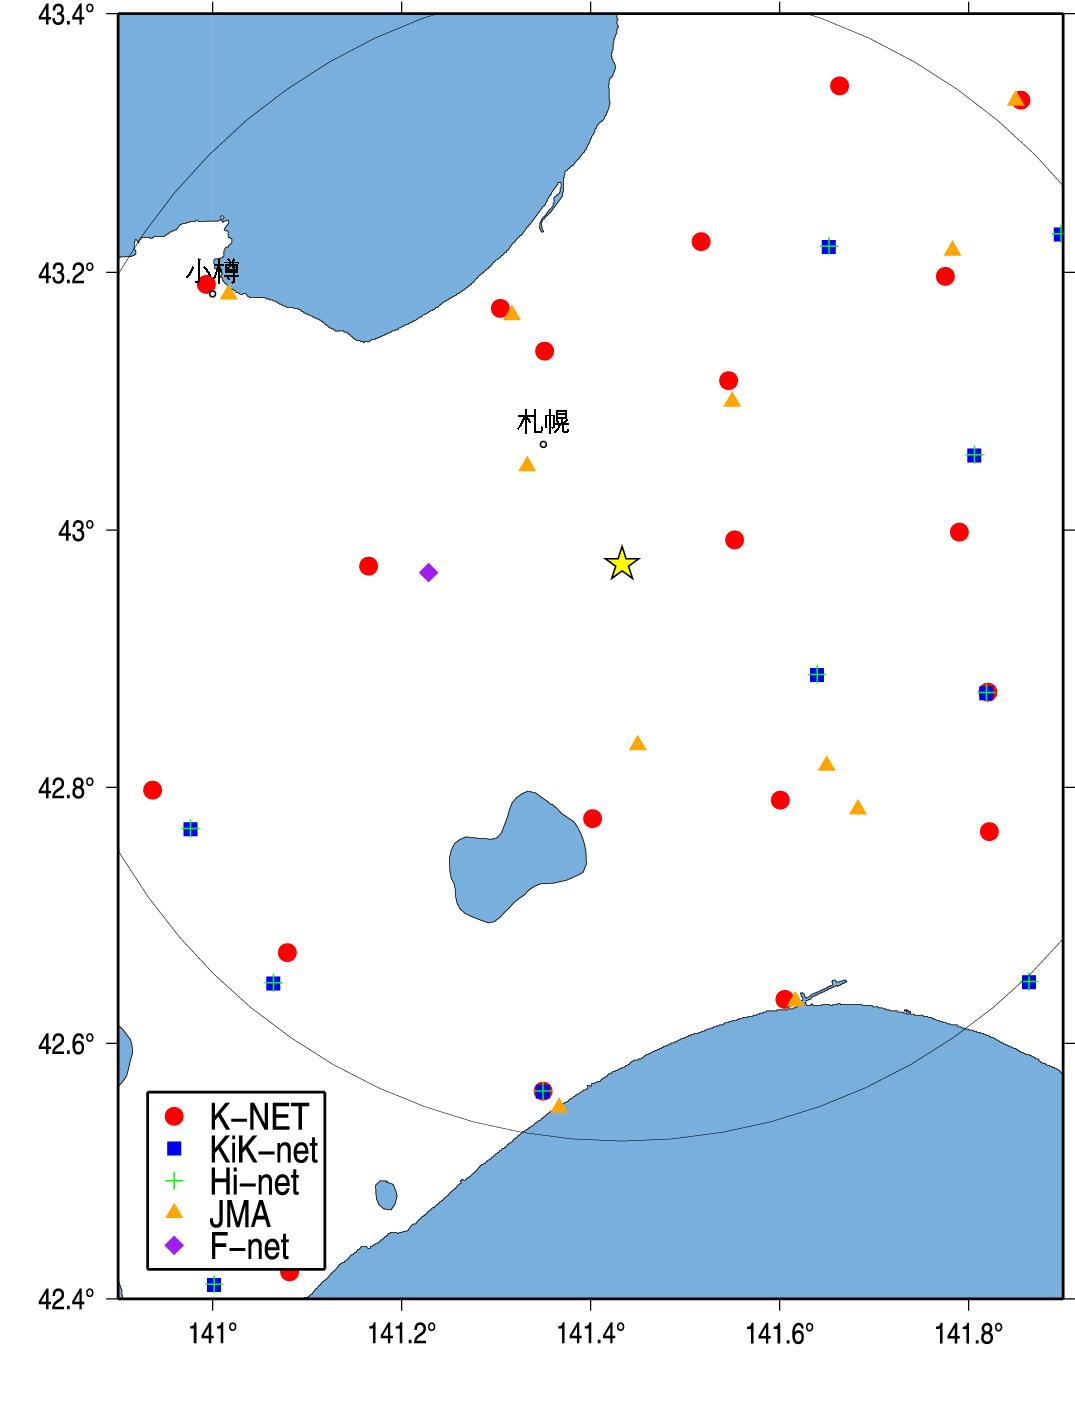
Fig.2. Station Distribution.
3.緊急地震速報発信状況 (Earthquake Early Warning Report)
-------------------------------------------------------------------[01] 10/12/02-06:44:02 03 M4.2 42.7N 141.6E 010km (10/12/02-06:44:08)
[04] 10/12/02-06:44:02 5- M5.4 43.0N 141.4E 010km (10/12/02-06:44:17)
[05] 10/12/02-06:44:02 5- M5.4 43.0N 141.4E 010km (10/12/02-06:44:36)
[06] 10/12/02-06:44:02 5- M5.4 43.0N 141.4E 010km (10/12/02-06:44:56)
[07] 10/12/02-06:44:02 5- M5.4 43.0N 141.4E 010km (10/12/02-06:45:00)
---------------------------------------------------------------------
(左から順に情報番号,震源時,最大予測震度,マグニチュード, 震央緯度,震央経度,震源深さ,電文発表時刻) from CEORKA
-------------------------------------------------------------------
Table2. Earthquake early warning reports. Information ID, Origin time, Maximum Intensity, JMA magnitude, Epicentral latitude, longitude, depth, and time to issue the report from the left.(ref. The Committee of Earthquake Observation and Research in the Kansai Area)
--> 気象庁による緊急地震速報の内容
4.解析結果 (Analytical Result)
-------------------------------------------------------
HKD1821012020644 141.552 42.993 1.814 1.502 9.938 4.5 6.0
HKD1811012020644 141.546 43.116 0.448 3.792 18.310 4.5 4.7
HKD1801012020644 141.351 43.139 0.551 4.262 19.552 4.5 4.9
IKRH031012020644 141.644 42.886 1.030 3.832 19.756 4.5 5.5
HKD1831012020644 141.165 42.972 0.696 4.122 21.880 4.5 5.1
HKD1851012020644 141.402 42.776 0.446 4.002 22.154 4.5 4.7
HKD1781012020644 141.305 43.172 0.837 5.102 24.417 4.5 5.3
HKD1841012020644 141.601 42.790 0.373 5.172 24.570 4.5 4.6
HKD1791012020644 141.517 43.224 1.211 5.662 28.611 4.5 5.7
HKD1241012020644 141.790 42.999 2.208 5.052 29.257 4.5 6.2
SRCH091012020644 141.810 43.056 2.645 5.702 32.054 4.5 6.4
IKRH021012020644 141.656 43.218 1.387 6.102 32.644 4.5 5.8
HKD1271012020644 141.820 42.874 1.563 5.942 33.481 4.5 5.9
IBUH011012020644 141.823 42.871 1.388 5.922 33.766 4.5 5.8
HKD1281012020644 141.822 42.765 1.082 7.402 39.291 4.5 5.6
HKD1291012020644 141.606 42.634 1.144 8.162 40.234 4.5 5.6
HKD1401012020644 140.993 43.191 1.014 7.532 43.178 4.5 5.5
SBSH081012020644 140.980 42.766 0.463 7.512 43.636 4.5 4.8
HKD1341012020644 141.079 42.671 0.758 7.452 44.365 4.5 5.2
HKD1451012020644 140.936 42.798 1.070 7.712 45.051 4.5 5.5
Observed/Estimated Mw(median) 4.5 5.5
-------------------------------------------------------
Table3. Analytical results using Tau_c method (Wu and Kanamori, 2005). Station ID, Station longitude, latitude, tauc, P-arrival time, epicentral distance(km) , magnitude, and estimated magnitude from the left.
5.観測記録 (Observed Records)
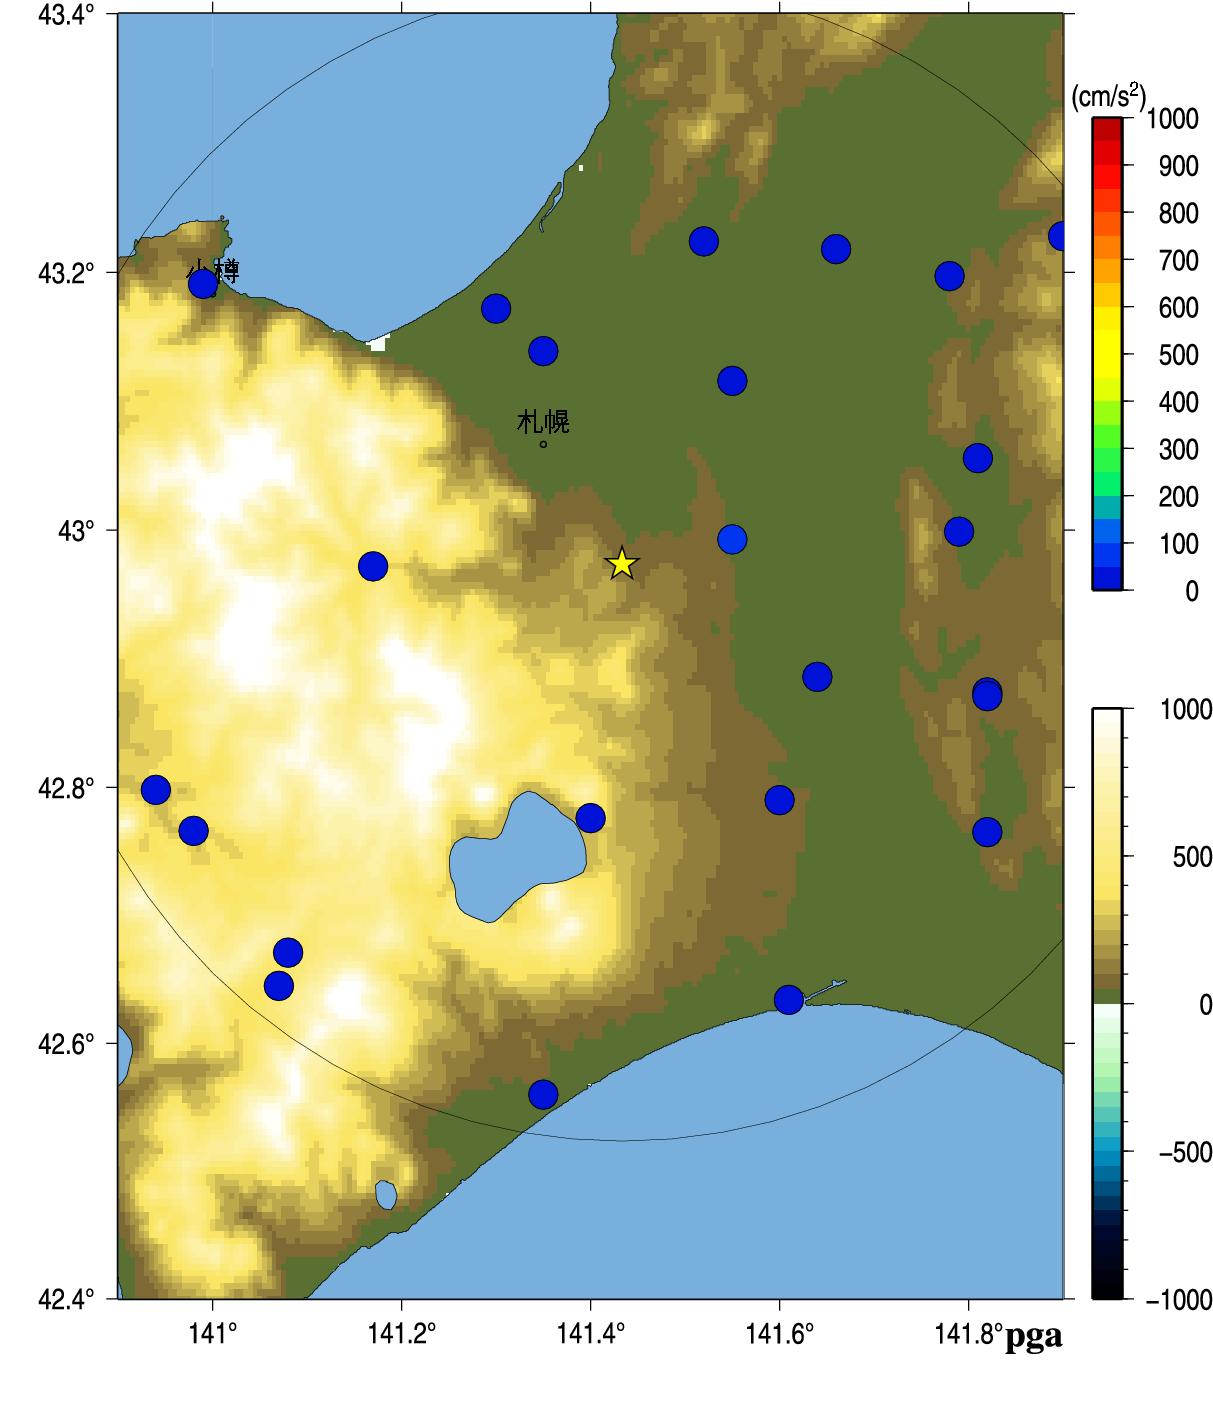
Fig.3. Peak Ground Acceleration.
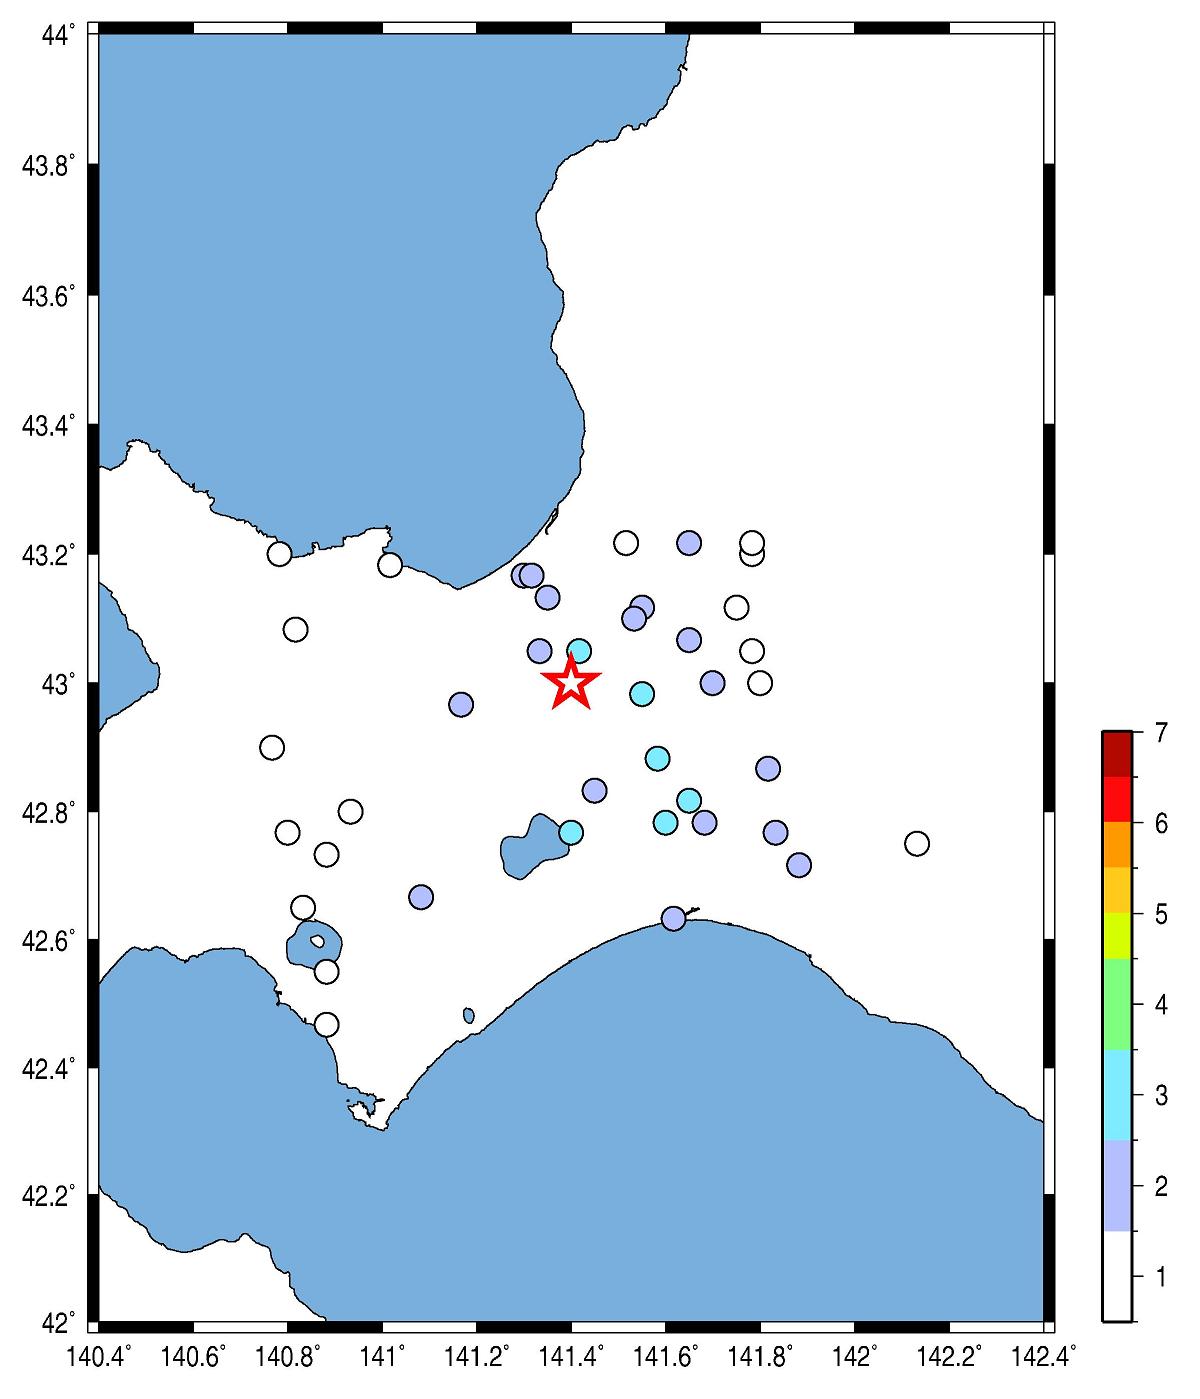
Fig.4. JMA seismic intensity.
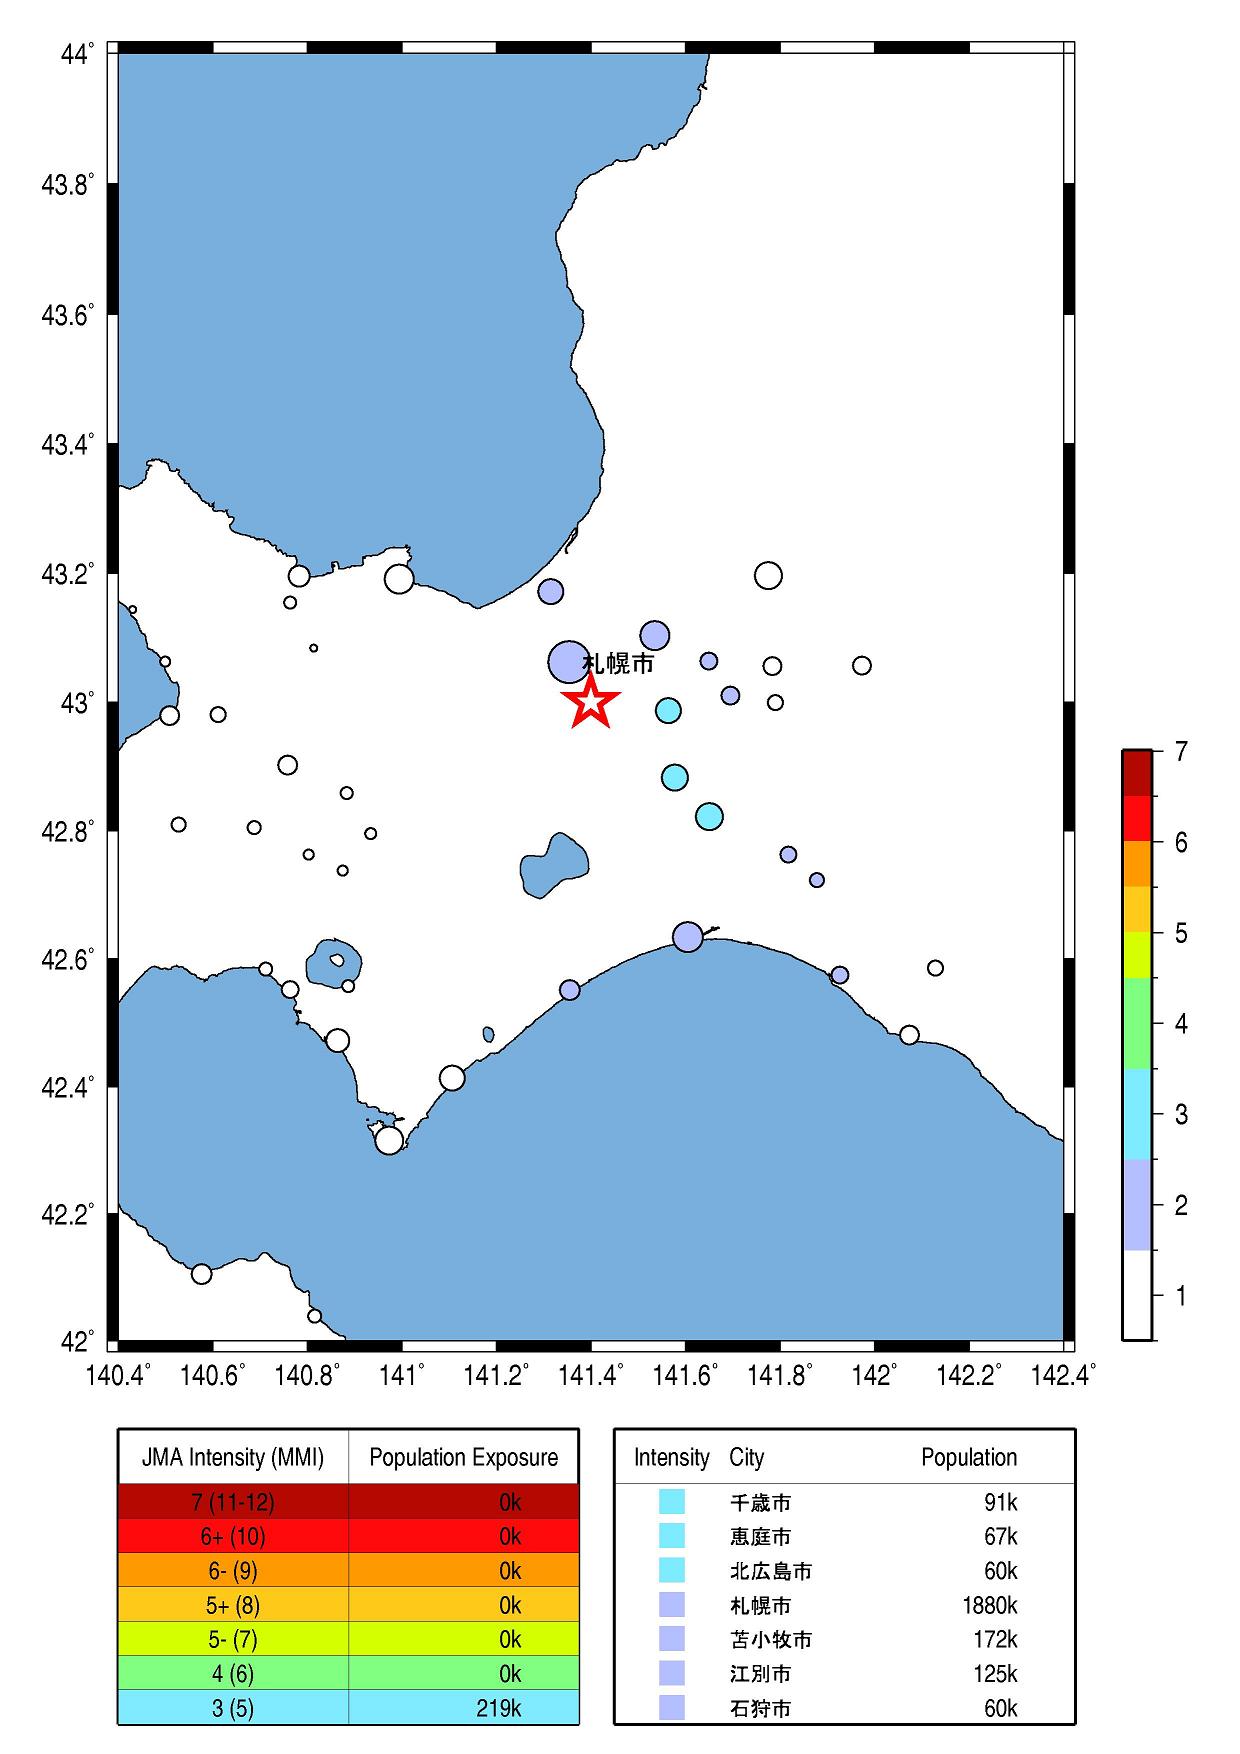
Fig.5. Population exposure. A circle size shows the population at the town, and a circle color shows the seismic intensity at the town.
Wu, Y. M. and H. Kanamori (2005). Experiment on an onsite early warning method for the Taiwan early warning system, Bull. Seism. Soc. Am., 95, 347-353.
気象庁の震度情報、防災科学技術研究所のK-NET,KiK-netの波形を利用しました。
緊急地震速報を発表した地震の解析結果
山田真澄 ホーム