━━━━━━━━━━━━━━━━━━━━━━━━
2010年10月3日 新潟県の地震
━━━━━━━━━━━━━━━━━━━━━━━━
1.地震について (Earthquake Information)
----------------------------------------------------
2010/10/03,09:26:56.804 36.8760 138.4588 18.3 4.8
----------------------------------------------------
Table1. Earthquake information. Origin time, Epicentral latitude, longitude, depth, and JMA magnitude from the left.(ref. JMA source mechanism)
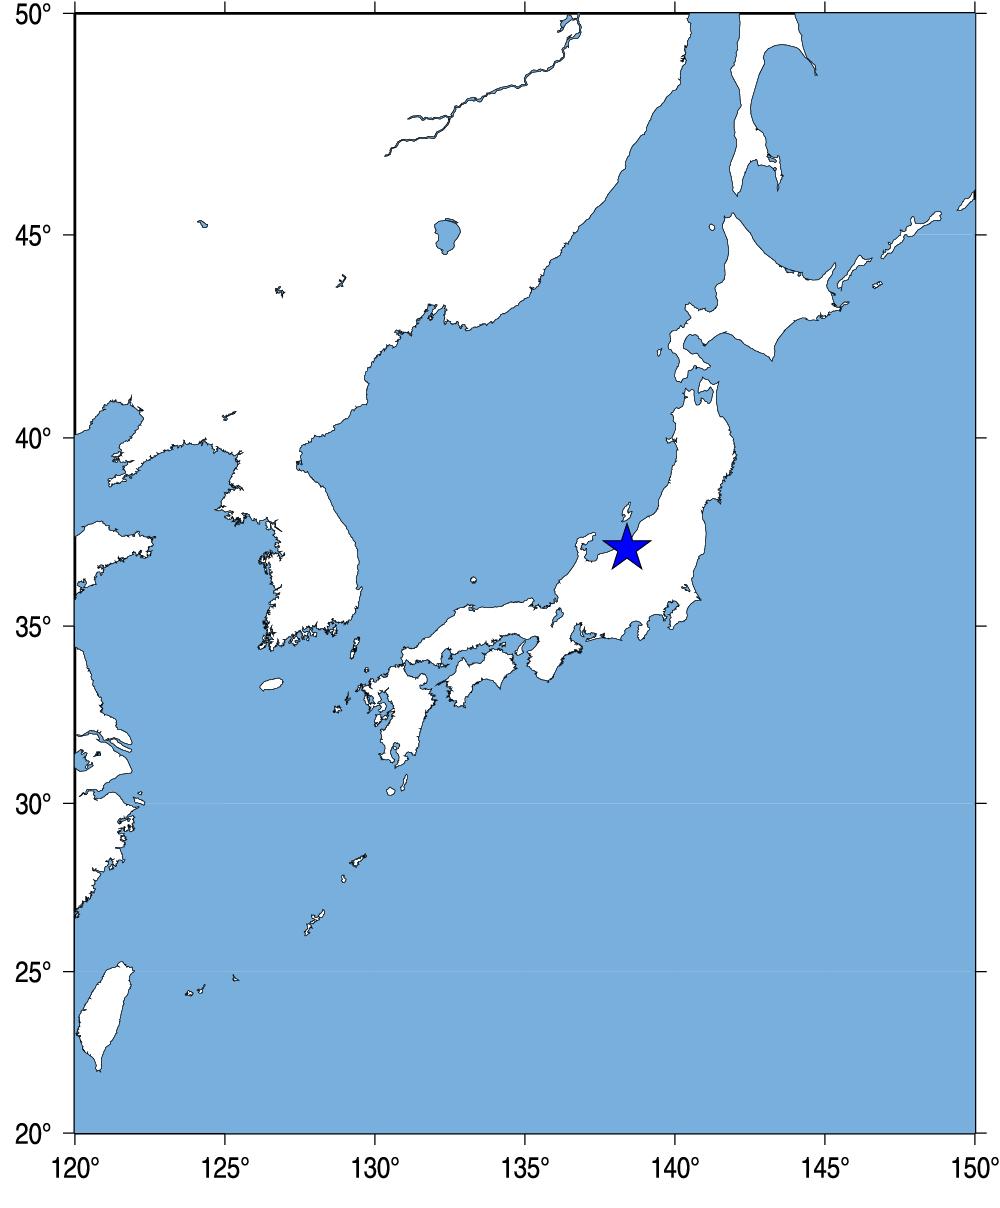
Fig.1. Event location.
2.観測点分布 (Station Distribution)
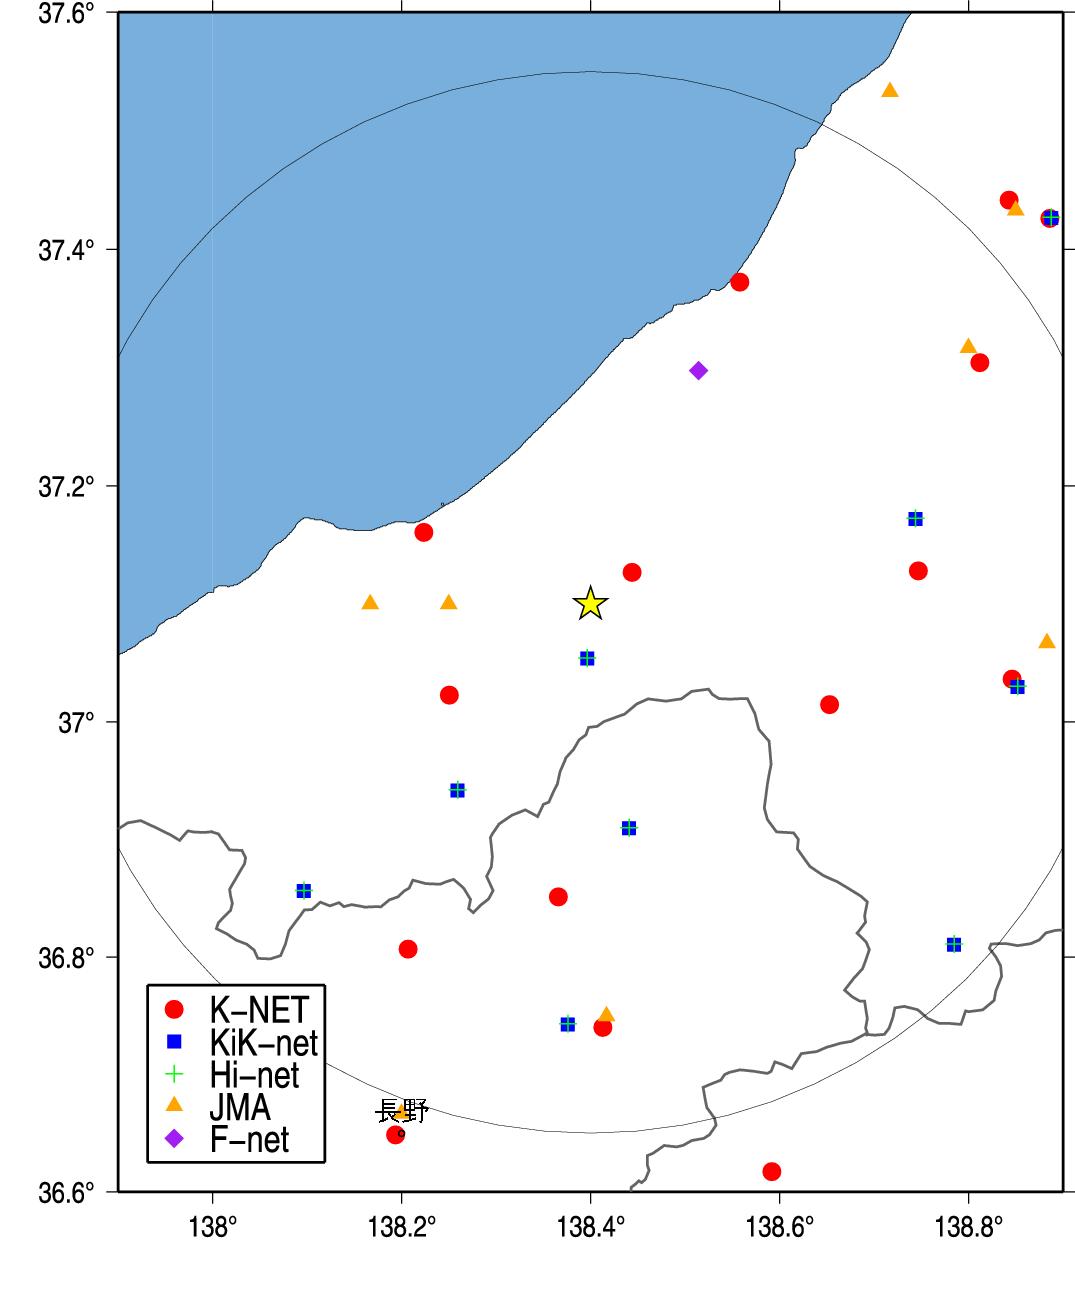
Fig.2. Station Distribution.
3.緊急地震速報発信状況 (Earthquake Early Warning Report)
-------------------------------------------------------------------[02] 10/10/03-09:26:52 5- M5.8 37.1N 138.5E 010km (10/10/03-09:27:04)
[05] 10/10/03-09:26:52 03 M4.7 37.1N 138.4E 020km (10/10/03-09:27:15)
[06] 10/10/03-09:26:52 04 M4.8 37.2N 138.4E 010km (10/10/03-09:27:27)
[08] 10/10/03-09:26:52 04 M4.8 37.2N 138.4E 010km (10/10/03-09:27:48)
[09] 10/10/03-09:26:52 04 M4.8 37.2N 138.4E 010km (10/10/03-09:27:49)
---------------------------------------------------------------------
(左から順に情報番号,震源時,最大予測震度,マグニチュード, 震央緯度,震央経度,震源深さ,電文発表時刻) from CEORKA
-------------------------------------------------------------------
Table2. Earthquake early warning reports. Information ID, Origin time, Maximum Intensity, JMA magnitude, Epicentral latitude, longitude, depth, and time to issue the report from the left.(ref. The Committee of Earthquake Observation and Research in the Kansai Area)
--> 気象庁による緊急地震速報の内容
4.解析結果 (Analytical Result)
-------------------------------------------------------
NIG0241010030926 138.444 37.127 0.859 -0.514 4.914 4.7 5.3
NIGH131010030926 138.400 37.051 0.723 -0.004 5.394 4.7 5.2
NIG0261010030926 138.251 37.023 0.480 0.986 15.802 4.7 4.8
NIG0251010030926 138.223 37.161 0.730 0.776 17.069 4.7 5.2
NIGH181010030926 138.262 36.939 0.648 2.136 21.619 4.7 5.1
NGNH291010030926 138.444 36.907 0.630 1.686 21.750 4.7 5.1
NIG0231010030926 138.653 37.015 1.243 1.896 24.405 4.7 5.7
NGN0011010030926 138.366 36.851 0.447 3.066 27.755 4.7 4.7
NIG0211010030926 138.747 37.128 0.834 2.786 30.981 4.7 5.3
NIGH111010030926 138.747 37.170 0.796 2.776 31.805 4.7 5.3
NIG0181010030926 138.558 37.372 0.339 1.346 33.321 4.7 4.5
NGN0021010030926 138.207 36.807 0.367 4.666 36.794 4.7 4.6
NIGH171010030926 138.100 36.854 0.420 4.276 38.221 4.7 4.7
NGN0031010030926 138.413 36.740 0.543 4.156 39.935 4.7 4.9
NGNH071010030926 138.379 36.740 0.403 4.216 39.961 4.7 4.6
NIG0221010030926 138.846 37.036 0.668 3.666 40.306 4.7 5.1
NIGH141010030926 138.855 37.027 0.612 3.746 41.292 4.7 5.0
NIG0191010030926 138.812 37.304 0.463 4.276 43.042 4.7 4.8
NIGH191010030926 138.788 36.808 0.397 4.806 47.358 4.7 4.6
NIG0271010030926 137.862 37.023 0.299 5.356 48.562 4.7 4.4
Observed/Estimated Mw(median) 4.7 4.95
-------------------------------------------------------
Table3. Analytical results using Tau_c method (Wu and Kanamori, 2005). Station ID, Station longitude, latitude, tauc, P-arrival time, epicentral distance(km) , magnitude, and estimated magnitude from the left.
5.観測記録 (Observed Records)
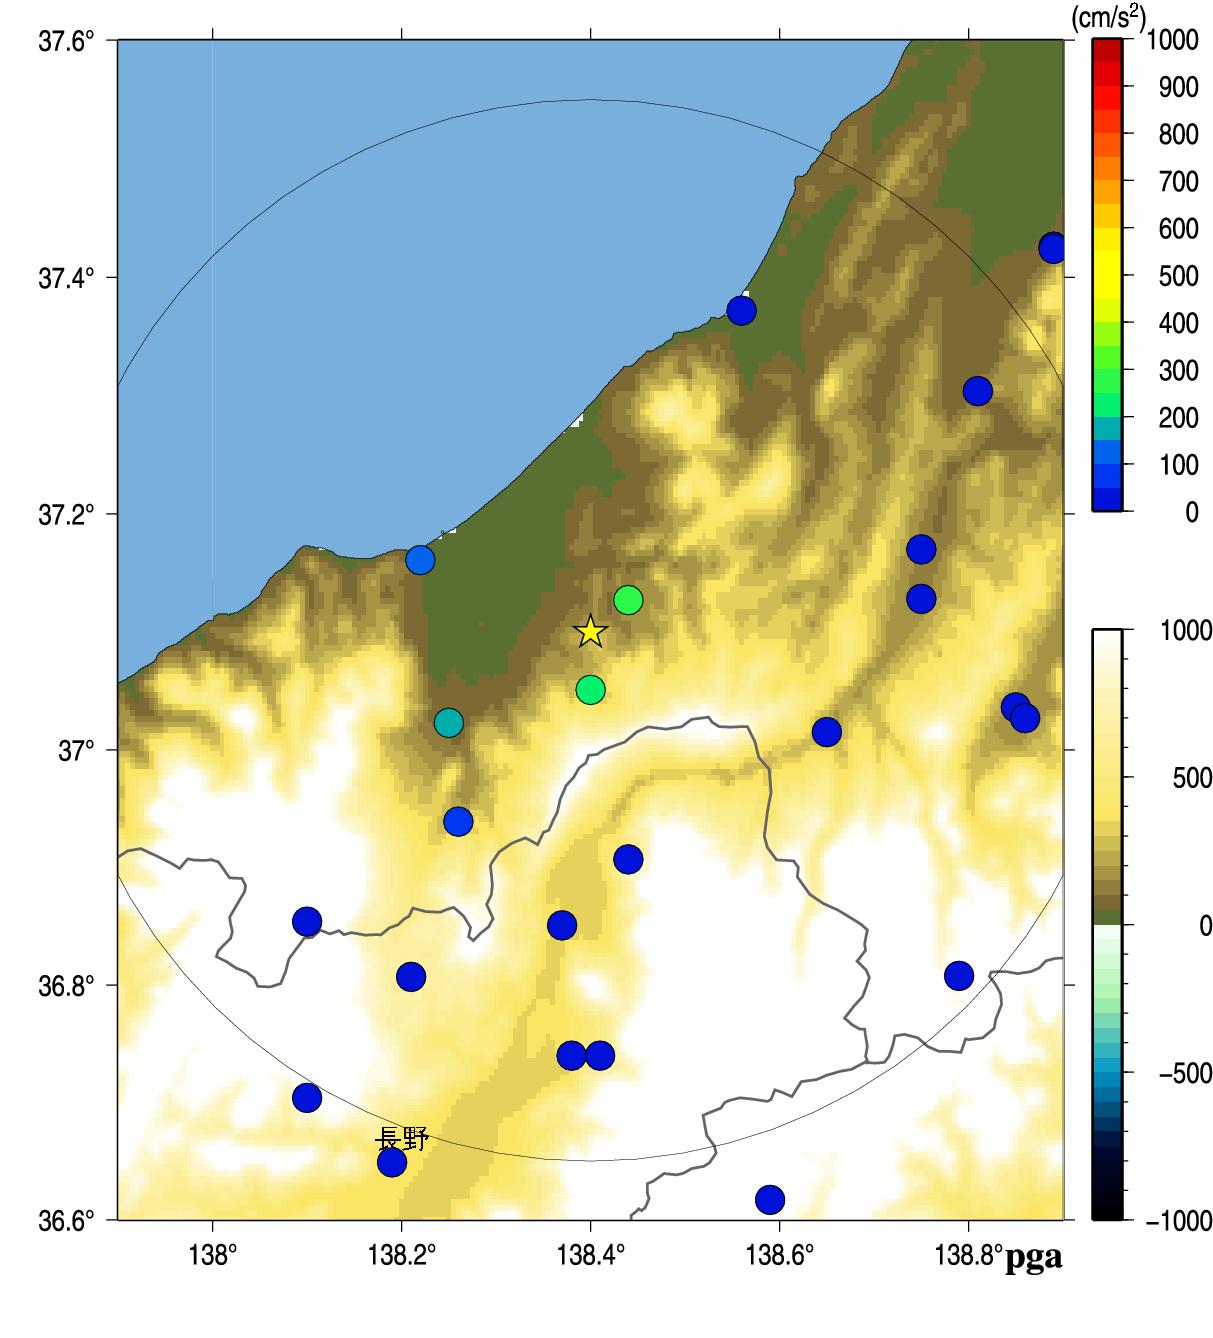
Fig.3. Peak Ground Acceleration.
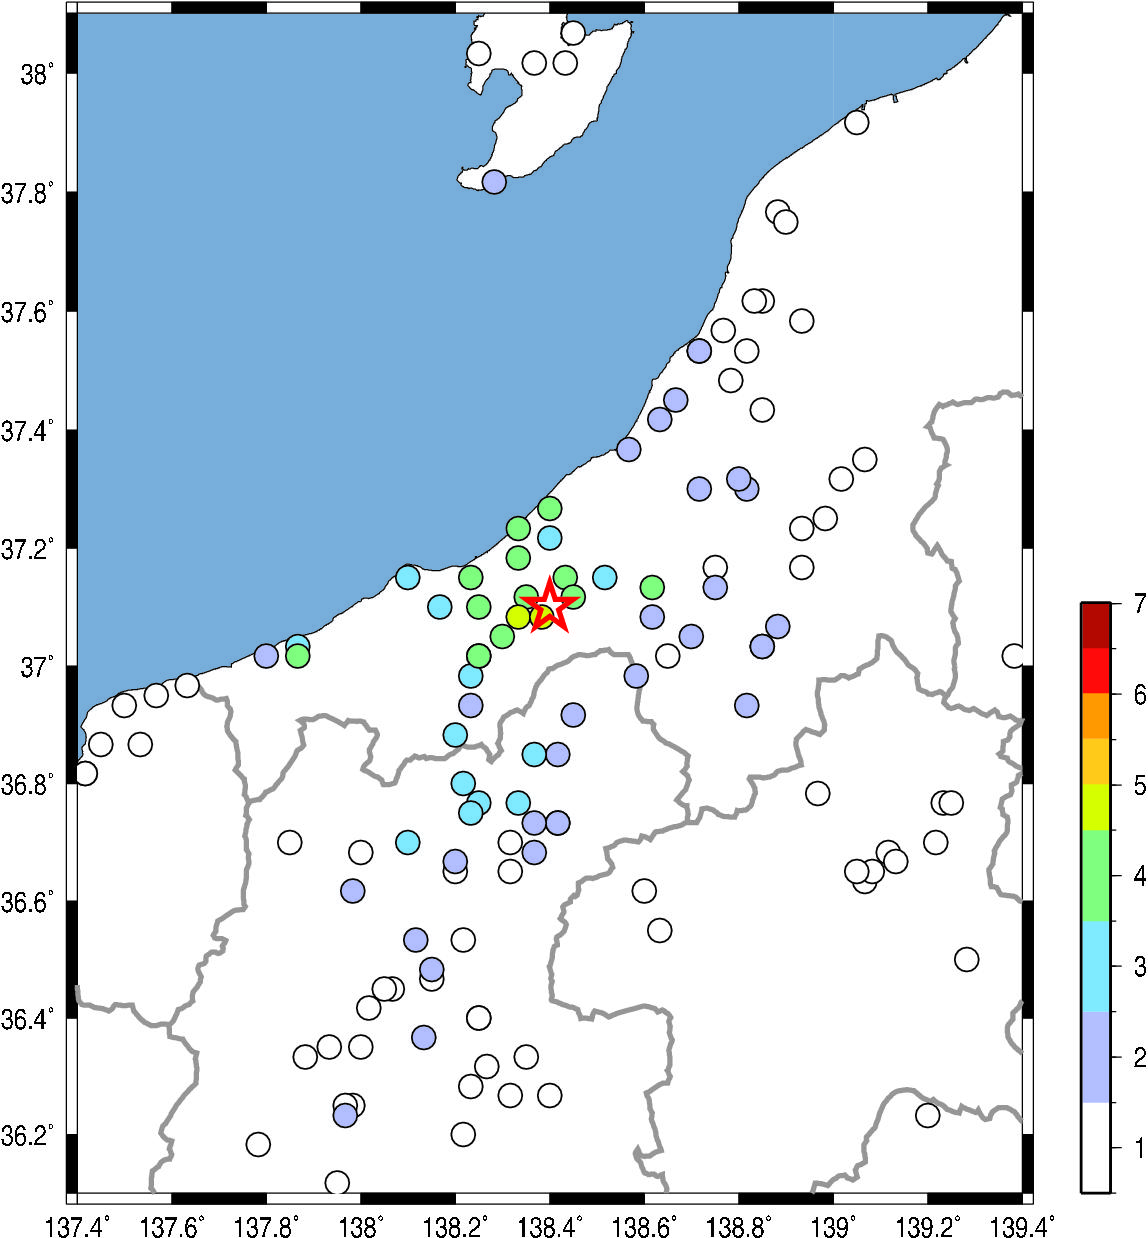
Fig.4. JMA seismic intensity.
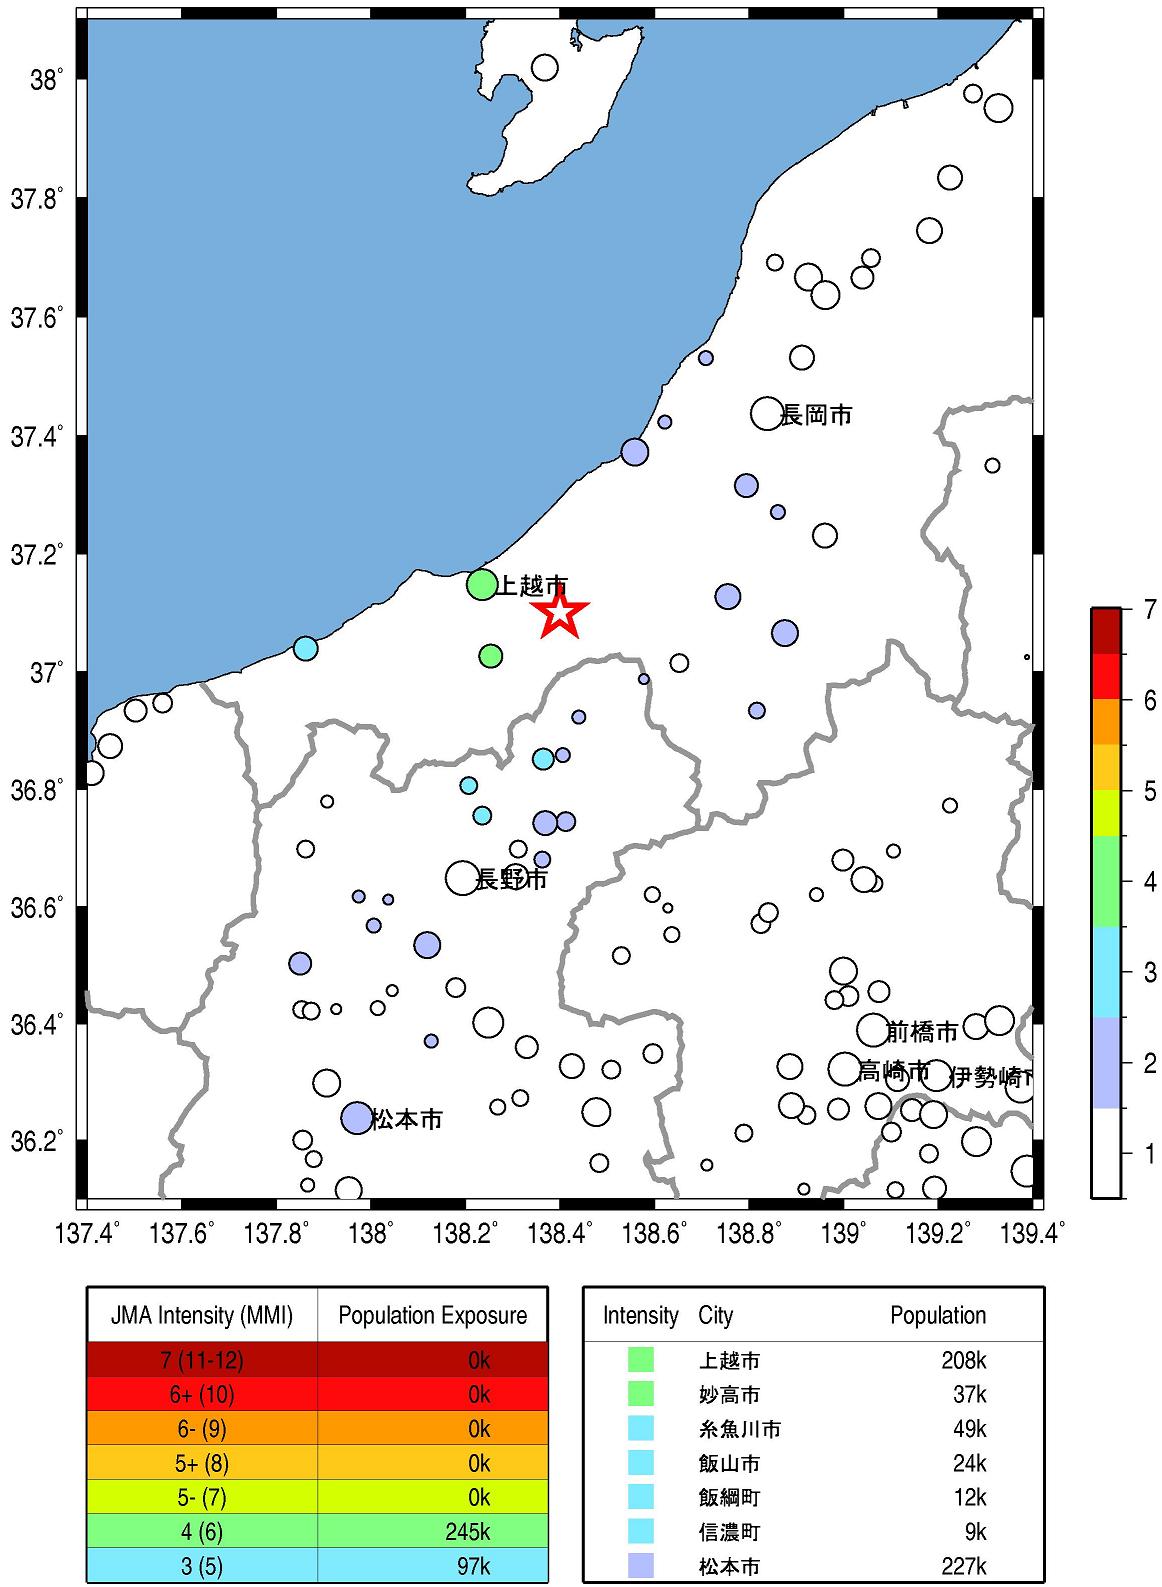
Fig.5. Population exposure. A circle size shows the population at the town, and a circle color shows the seismic intensity at the town.
Wu, Y. M. and H. Kanamori (2005). Experiment on an onsite early warning method for the Taiwan early warning system, Bull. Seism. Soc. Am., 95, 347-353.
気象庁の震度情報、防災科学技術研究所のK-NET,KiK-netの波形を利用しました。
緊急地震速報を発表した地震の解析結果
山田真澄 ホーム