━━━━━━━━━━━━━━━━━━━━━━━━
2010年9月29日 福島県の地震
━━━━━━━━━━━━━━━━━━━━━━━━
1.地震について (Earthquake Information)
----------------------------------------------------
2010/09/29,16:59:55.98 37.285 140.025 7.6 5.7
----------------------------------------------------
Table1. Earthquake information. Origin time, Epicentral latitude, longitude, depth, and JMA magnitude from the left.(ref. JMA source mechanism)
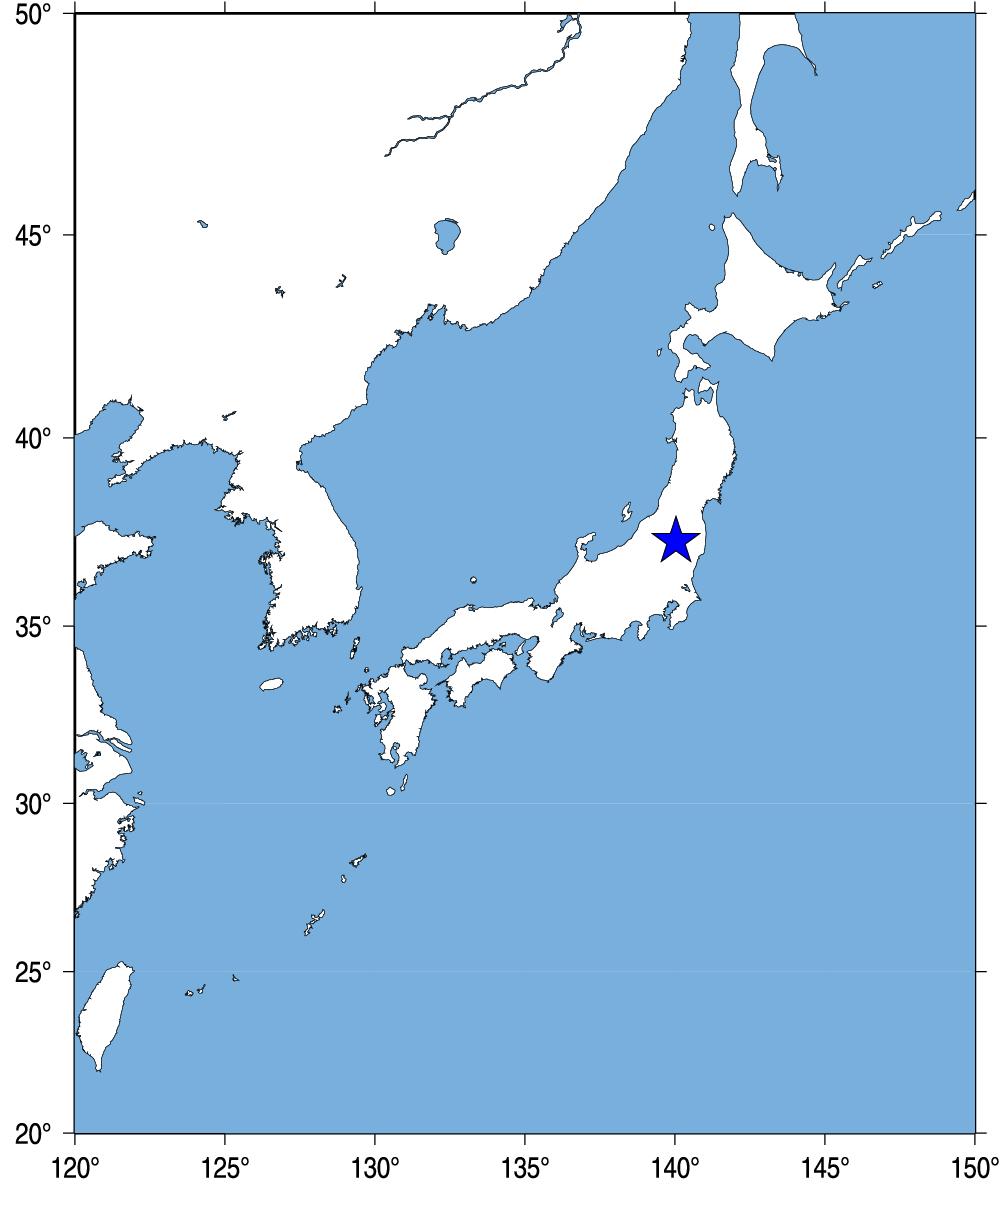
Fig.1. Event location.
2.観測点分布 (Station Distribution)
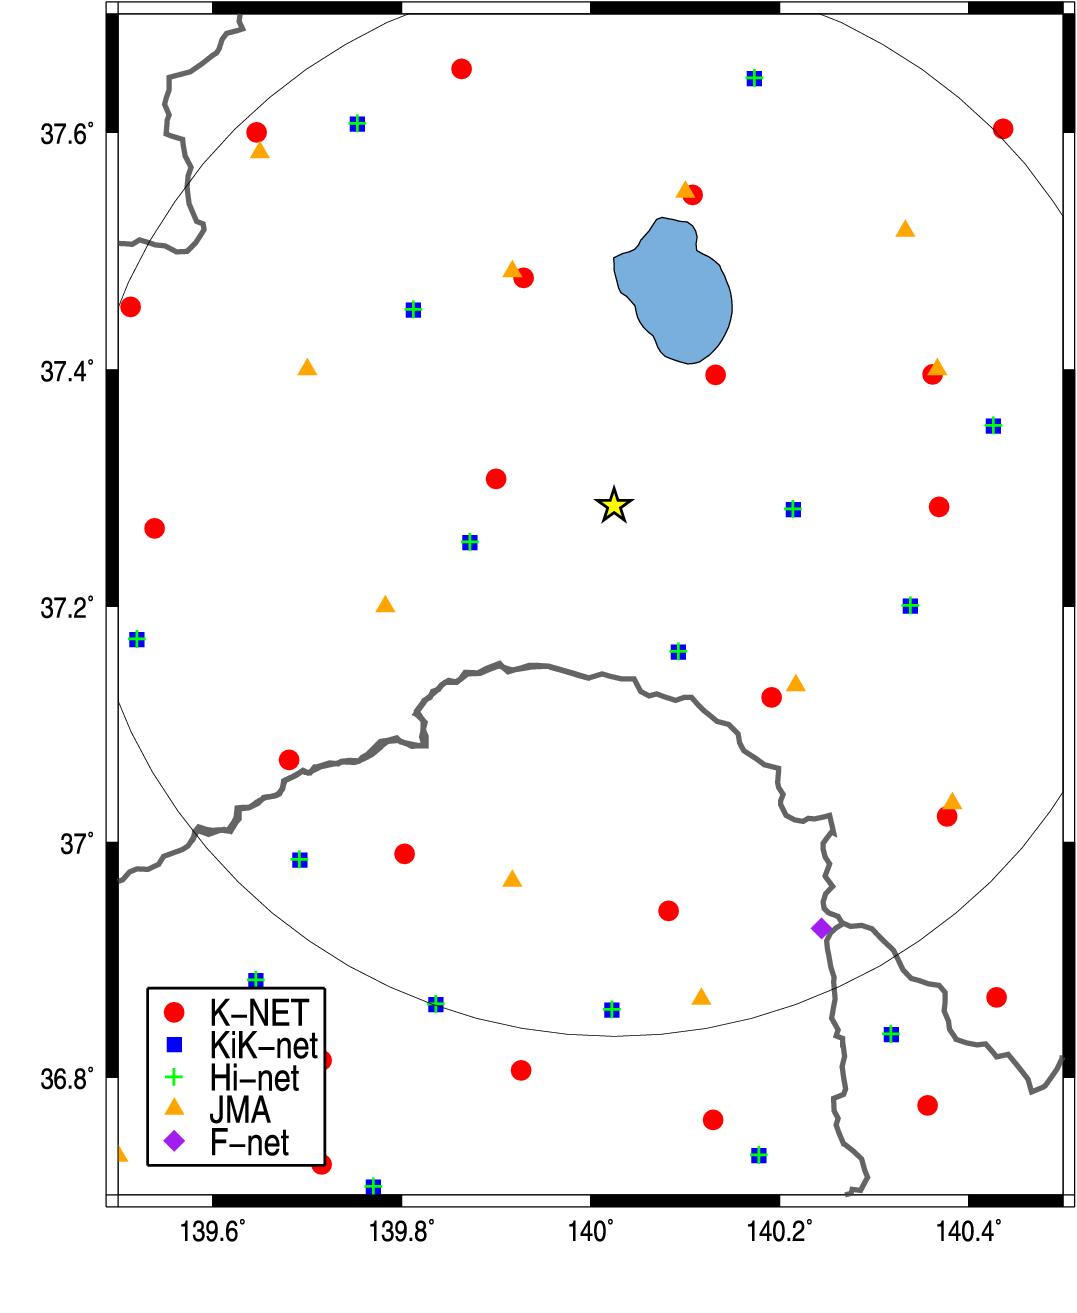
Fig.2. Station Distribution.
3.緊急地震速報発信状況 (Earthquake Early Warning Report)
-------------------------------------------------------------------[01] 10/09/29-16:59:45 04 M6.0 37.4N 139.9E 120km (10/09/29-17:00:04)
[04] 10/09/29-16:59:56 5- M5.6 37.3N 140.0E 010km (10/09/29-17:00:10)
[10] 10/09/29-16:59:55 5- M5.8 37.3N 140.0E 010km (10/09/29-17:00:24)
[11] 10/09/29-16:59:55 5- M5.8 37.3N 140.0E 010km (10/09/29-17:00:32)
[13] 10/09/29-16:59:55 5- M5.8 37.3N 140.0E 010km (10/09/29-17:00:52)
---------------------------------------------------------------------
(左から順に情報番号,震源時,最大予測震度,マグニチュード, 震央緯度,震央経度,震源深さ,電文発表時刻) from CEORKA
-------------------------------------------------------------------
Table2. Earthquake early warning reports. Information ID, Origin time, Maximum Intensity, JMA magnitude, Epicentral latitude, longitude, depth, and time to issue the report from the left.(ref. The Committee of Earthquake Observation and Research in the Kansai Area)
--> 気象庁による緊急地震速報の内容
4.解析結果 (Analytical Result)
-------------------------------------------------------
FKS0251009291700 139.900 37.308 1.778 2.330 11.366 5.7 6.0
FKS0241009291700 140.133 37.396 1.695 2.970 15.547 5.7 6.0
FKSH051009291700 139.876 37.251 3.047 2.880 13.752 5.7 6.5
FKSH101009291700 140.096 37.159 0.781 3.200 15.400 5.7 5.3
FKSH081009291700 140.218 37.279 2.484 3.330 17.111 5.7 6.3
FKS0231009291700 139.929 37.477 0.939 4.590 22.971 5.7 5.4
FKS0161009291700 140.191 37.123 2.233 4.610 23.287 5.7 6.2
FKSH041009291700 139.816 37.448 1.255 5.080 25.875 5.7 5.7
FKS0201009291700 140.108 37.547 1.229 5.720 30.031 5.7 5.7
FKSH111009291700 140.342 37.198 2.626 3.420 29.753 5.7 6.4
FKS0171009291700 140.369 37.284 1.824 5.650 30.497 5.7 6.0
FKS0181009291700 140.362 37.396 0.961 5.750 32.325 5.7 5.4
FKSH091009291700 140.430 37.350 2.406 5.330 36.592 5.7 6.3
TCG0011009291700 140.083 36.942 0.873 7.240 38.444 5.7 5.4
TCG0021009291700 139.803 36.990 1.213 7.020 38.208 5.7 5.7
FKS0271009291700 139.681 37.070 2.142 7.070 38.777 5.7 6.2
FKSH151009291700 140.177 37.643 2.482 7.410 41.952 5.7 6.3
FKSH031009291700 139.757 37.605 1.131 8.100 42.706 5.7 5.6
FKS0211009291700 139.863 37.653 1.518 8.040 43.328 5.7 5.9
FKS0151009291700 140.378 37.022 1.720 7.810 42.831 5.7 6.0
Observed/Estimated Mw(median) 5.7 6
-------------------------------------------------------
Table3. Analytical results using Tau_c method (Wu and Kanamori, 2005). Station ID, Station longitude, latitude, tauc, P-arrival time, epicentral distance(km) , magnitude, and estimated magnitude from the left.
5.観測記録 (Observed Records)
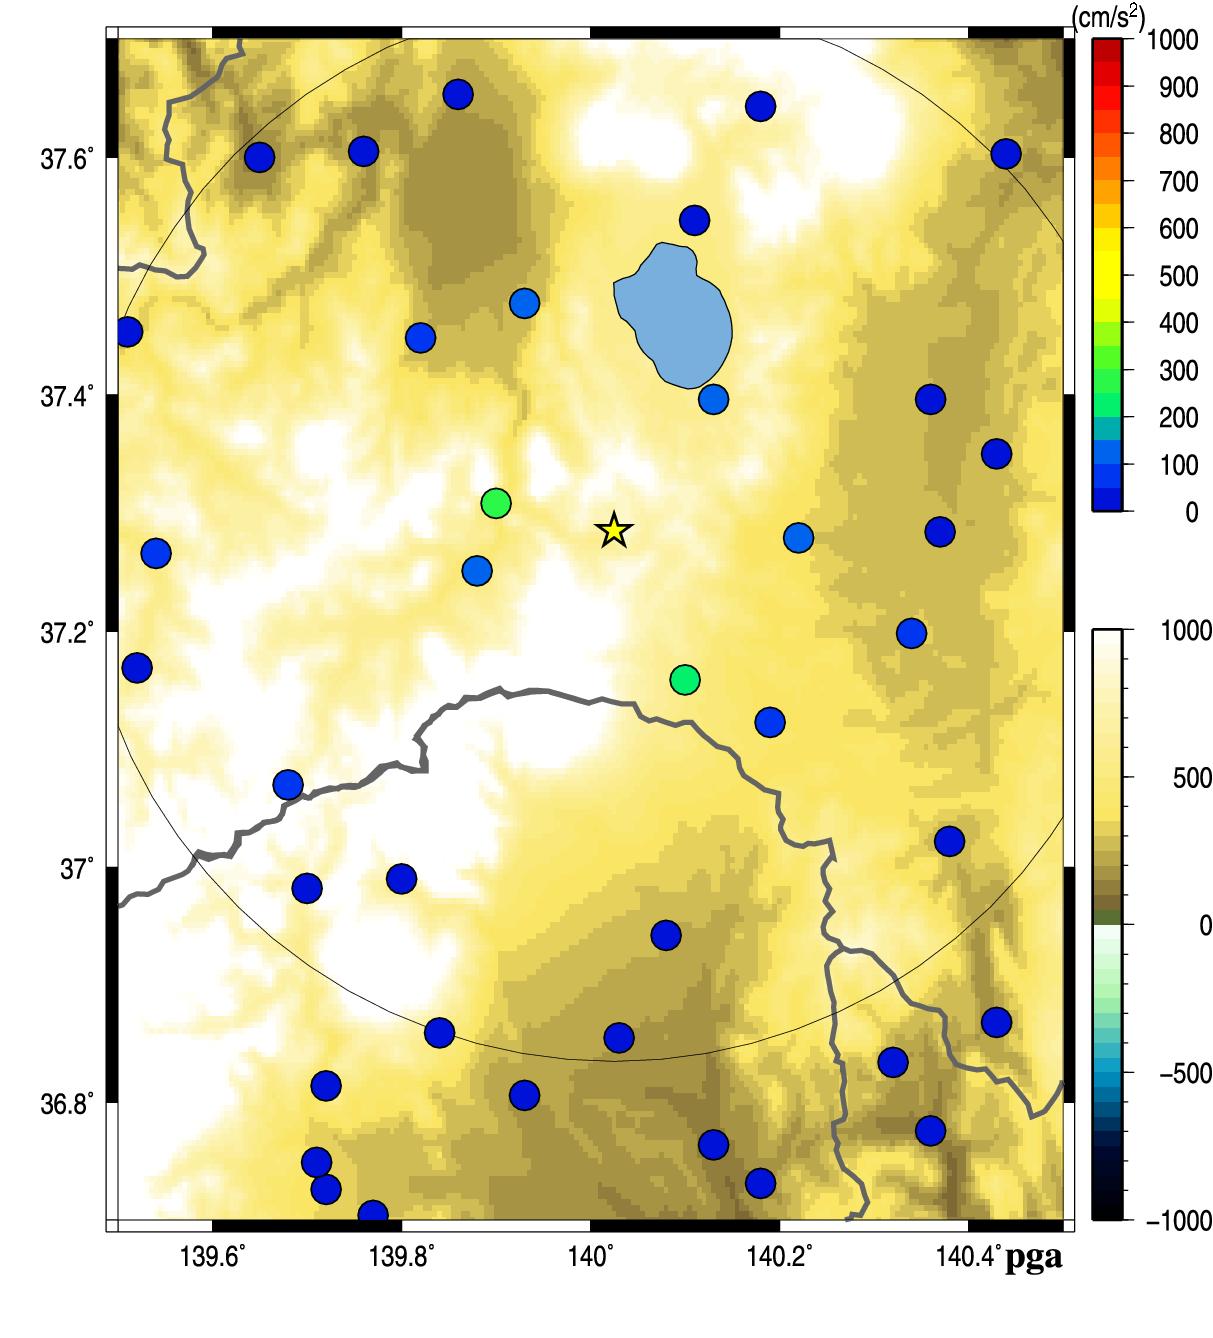
Fig.3. Peak Ground Acceleration.
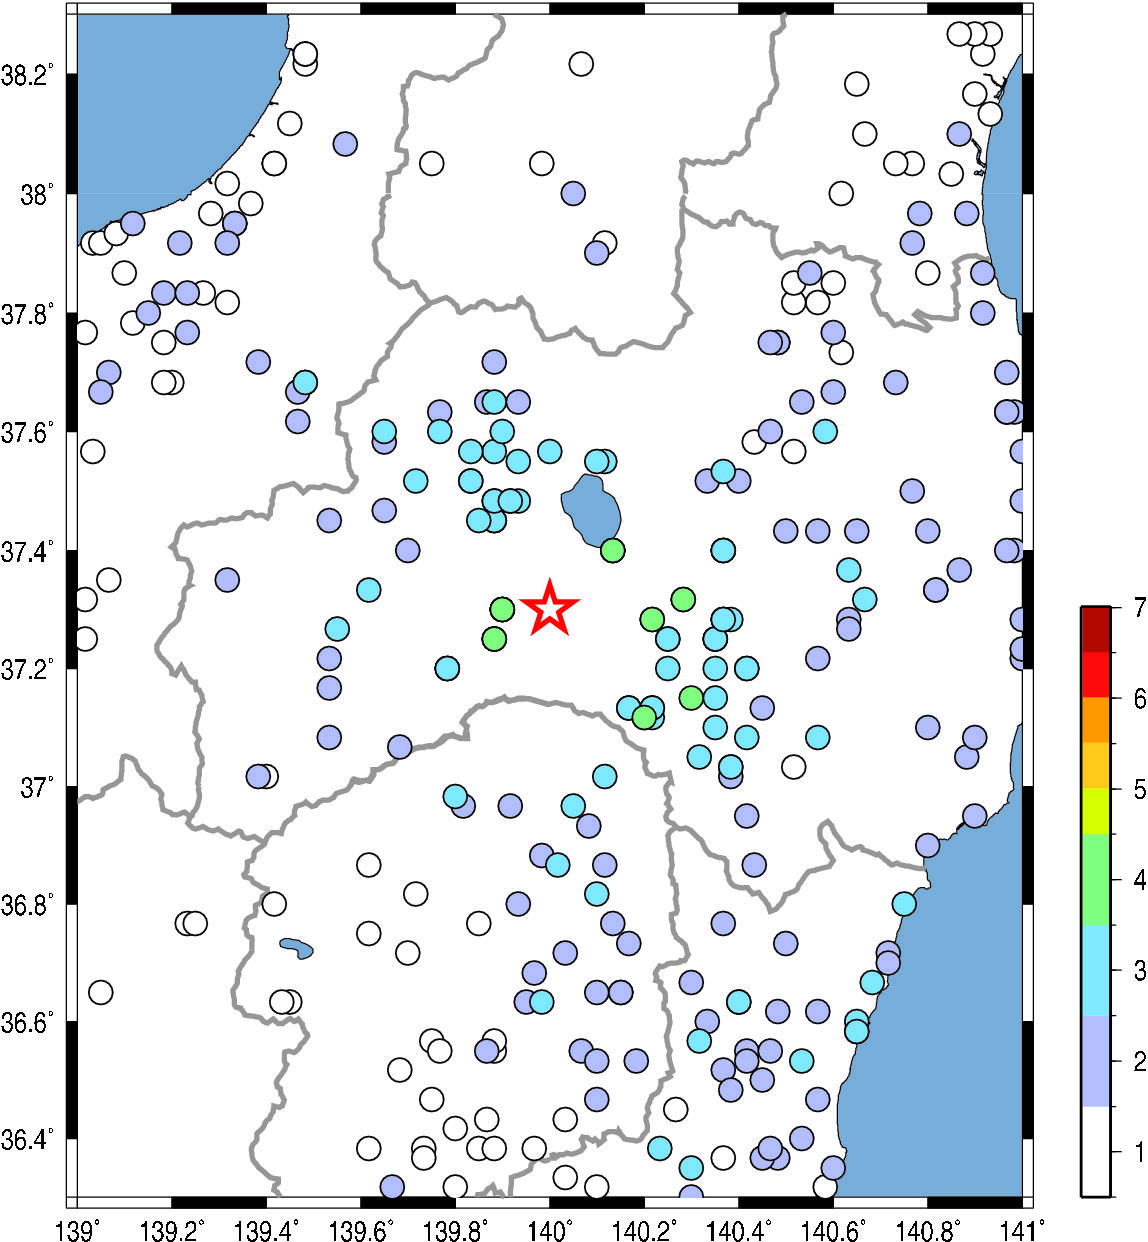
Fig.4. JMA seismic intensity.
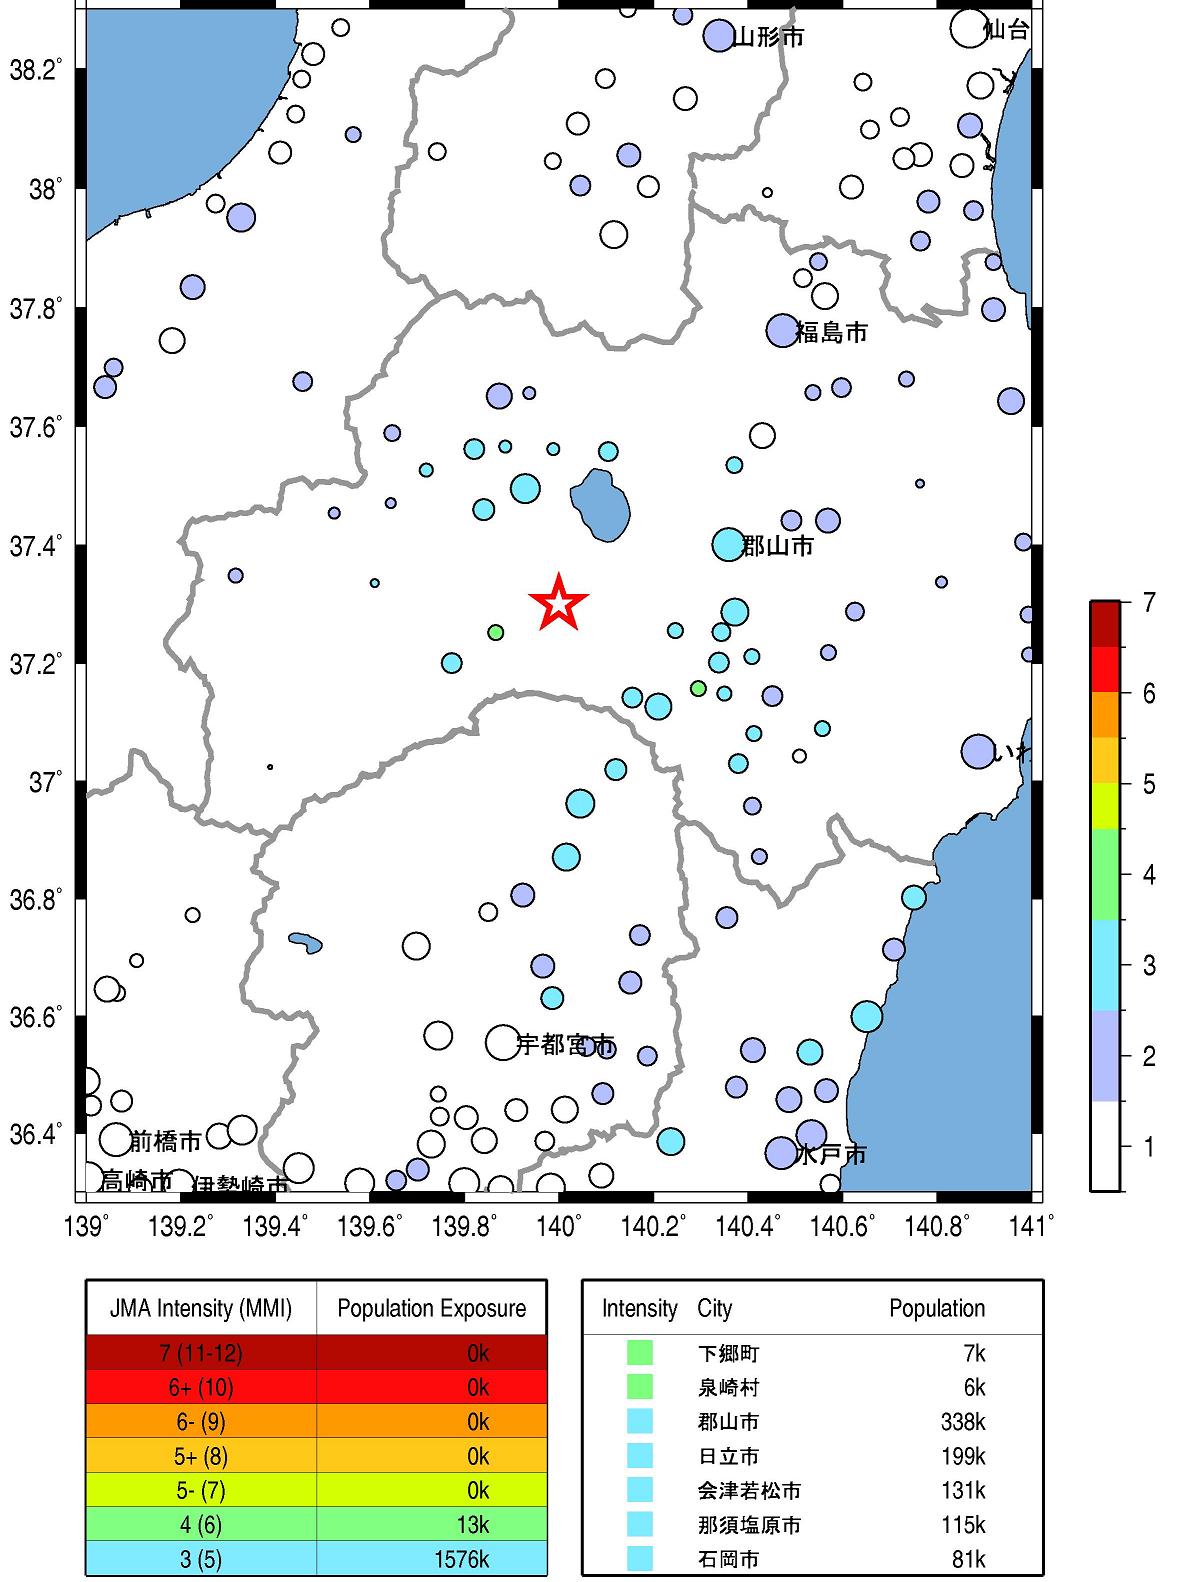
Fig.5. Population exposure. A circle size shows the population at the town, and a circle color shows the seismic intensity at the town.
Wu, Y. M. and H. Kanamori (2005). Experiment on an onsite early warning method for the Taiwan early warning system, Bull. Seism. Soc. Am., 95, 347-353.
気象庁の震度情報、防災科学技術研究所のK-NET,KiK-netの波形を利用しました。
緊急地震速報を発表した地震の解析結果
山田真澄 ホーム