━━━━━━━━━━━━━━━━━━━━━━━━
2010年7月23日 千葉県の地震
━━━━━━━━━━━━━━━━━━━━━━━━
1.地震について (Earthquake Information)
----------------------------------------------------
2010/07/23,06:06:31.928 35.8806 140.4953 33.7 5.1
----------------------------------------------------
Table1. Earthquake information. Origin time, Epicentral latitude, longitude, depth, and JMA magnitude from the left.(ref. JMA source mechanism)
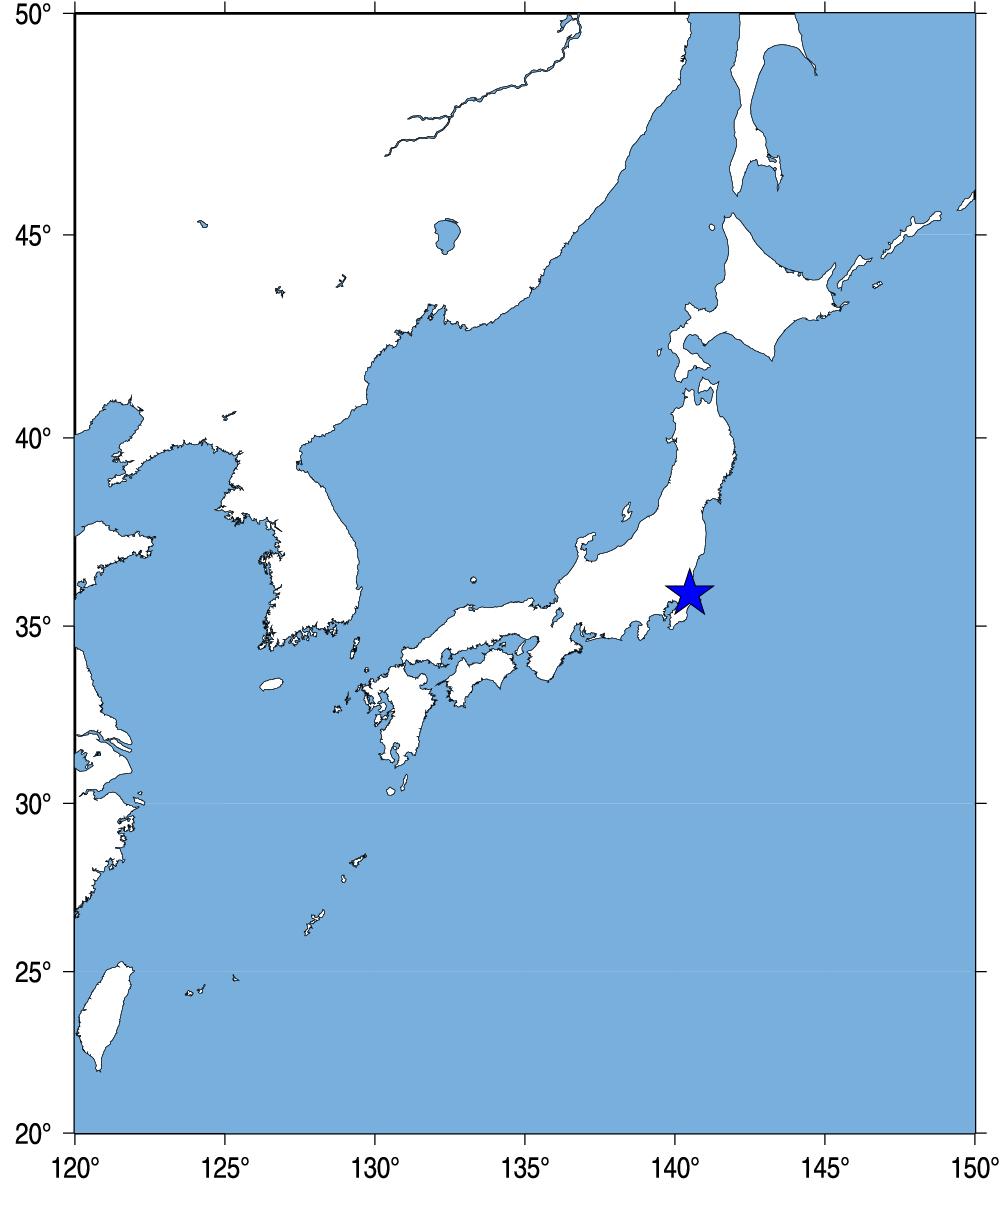
Fig.1. Event location.
2.観測点分布 (Station Distribution)
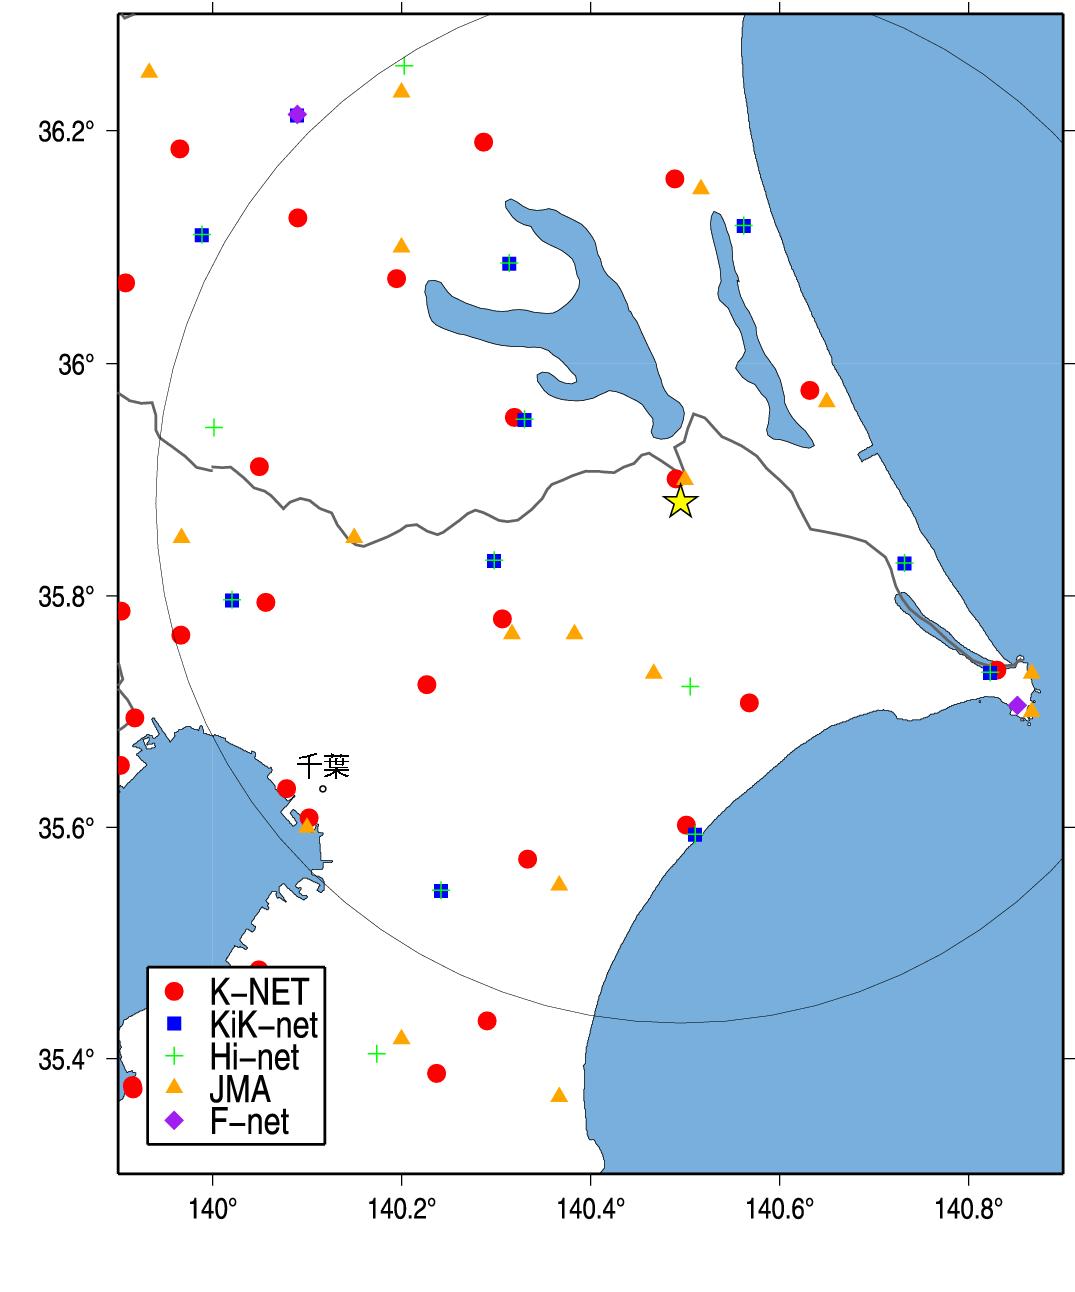
Fig.2. Station Distribution.
3.緊急地震速報発信状況 (Earthquake Early Warning Report)
-------------------------------------------------------------------[01] 10/07/23-06:06:33 04 M4.9 35.9N 140.6E 010km (10/07/23-06:06:42)
[04] 10/07/23-06:06:31 04 M5.0 35.9N 140.5E 030km (10/07/23-06:06:51)
[05] 10/07/23-06:06:32 04 M5.0 35.9N 140.5E 030km (10/07/23-06:06:55)
[06] 10/07/23-06:06:32 04 M5.0 35.9N 140.5E 030km (10/07/23-06:07:10)
[07] 10/07/23-06:06:32 04 M5.0 35.9N 140.5E 030km (10/07/23-06:07:26)
---------------------------------------------------------------------
(左から順に情報番号,震源時,最大予測震度,マグニチュード, 震央緯度,震央経度,震源深さ,電文発表時刻) from CEORKA
-------------------------------------------------------------------
Table2. Earthquake early warning reports. Information ID, Origin time, Maximum Intensity, JMA magnitude, Epicentral latitude, longitude, depth, and time to issue the report from the left.(ref. The Committee of Earthquake Observation and Research in the Kansai Area)
--> 気象庁による緊急地震速報の内容
4.解析結果 (Analytical Result)
-------------------------------------------------------
CHB0041007230606 140.490 35.901 0.542 5.792 2.272 5.1 4.9
IBR0181007230606 140.632 35.977 0.514 6.632 16.342 5.1 4.9
IBRH071007230606 140.333 35.949 0.459 6.122 16.461 5.1 4.8
IBR0171007230606 140.319 35.954 0.319 6.212 17.829 5.1 4.4
CHB0101007230606 140.568 35.708 1.026 6.382 20.279 5.1 5.5
CHB0061007230606 140.307 35.780 0.344 6.592 20.365 5.1 4.5
IBRH171007230606 140.317 36.083 0.368 7.232 27.623 5.1 4.6
CHB0071007230606 140.227 35.723 0.424 7.402 29.894 5.1 4.7
IBR0131007230606 140.489 36.159 0.297 7.542 30.863 5.1 4.4
CHB0111007230606 140.501 35.602 0.807 7.572 30.906 5.1 5.3
Observed/Estimated Mw(median) 4.8
-------------------------------------------------------
Table3. Analytical results using Tau_c method (Wu and Kanamori, 2005). Station ID, Station longitude, latitude, tauc, P-arrival time, epicentral distance(km) , magnitude, and estimated magnitude from the left.
5.観測記録 (Observed Records)
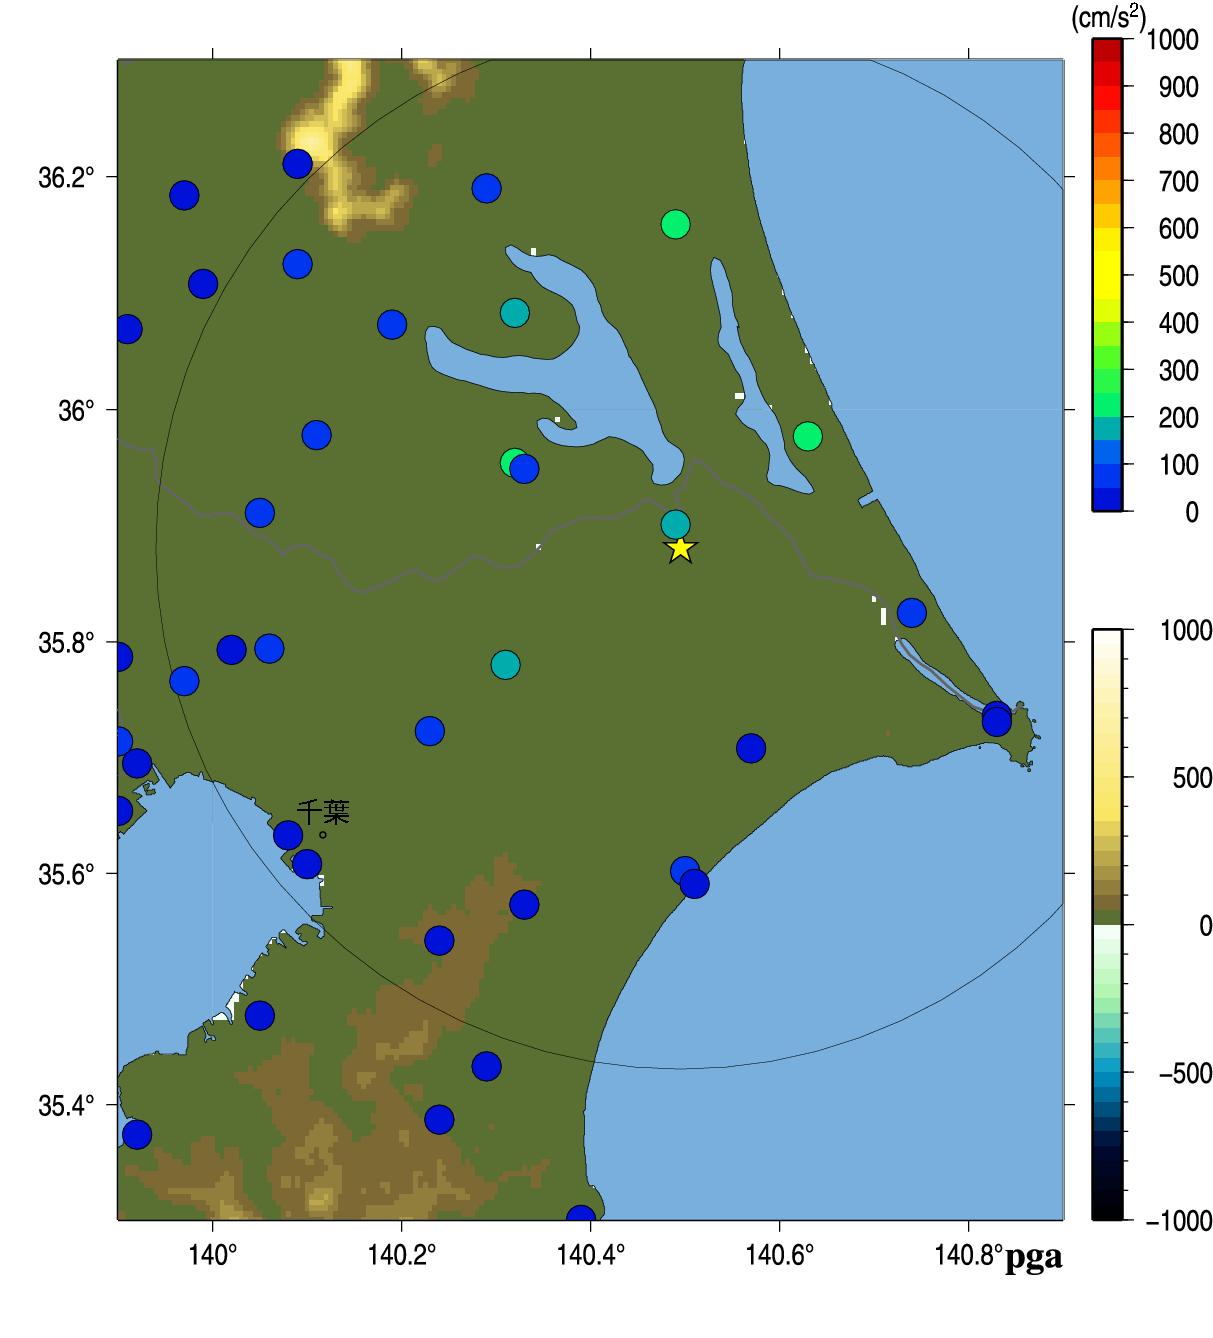
Fig.3. Peak Ground Acceleration.
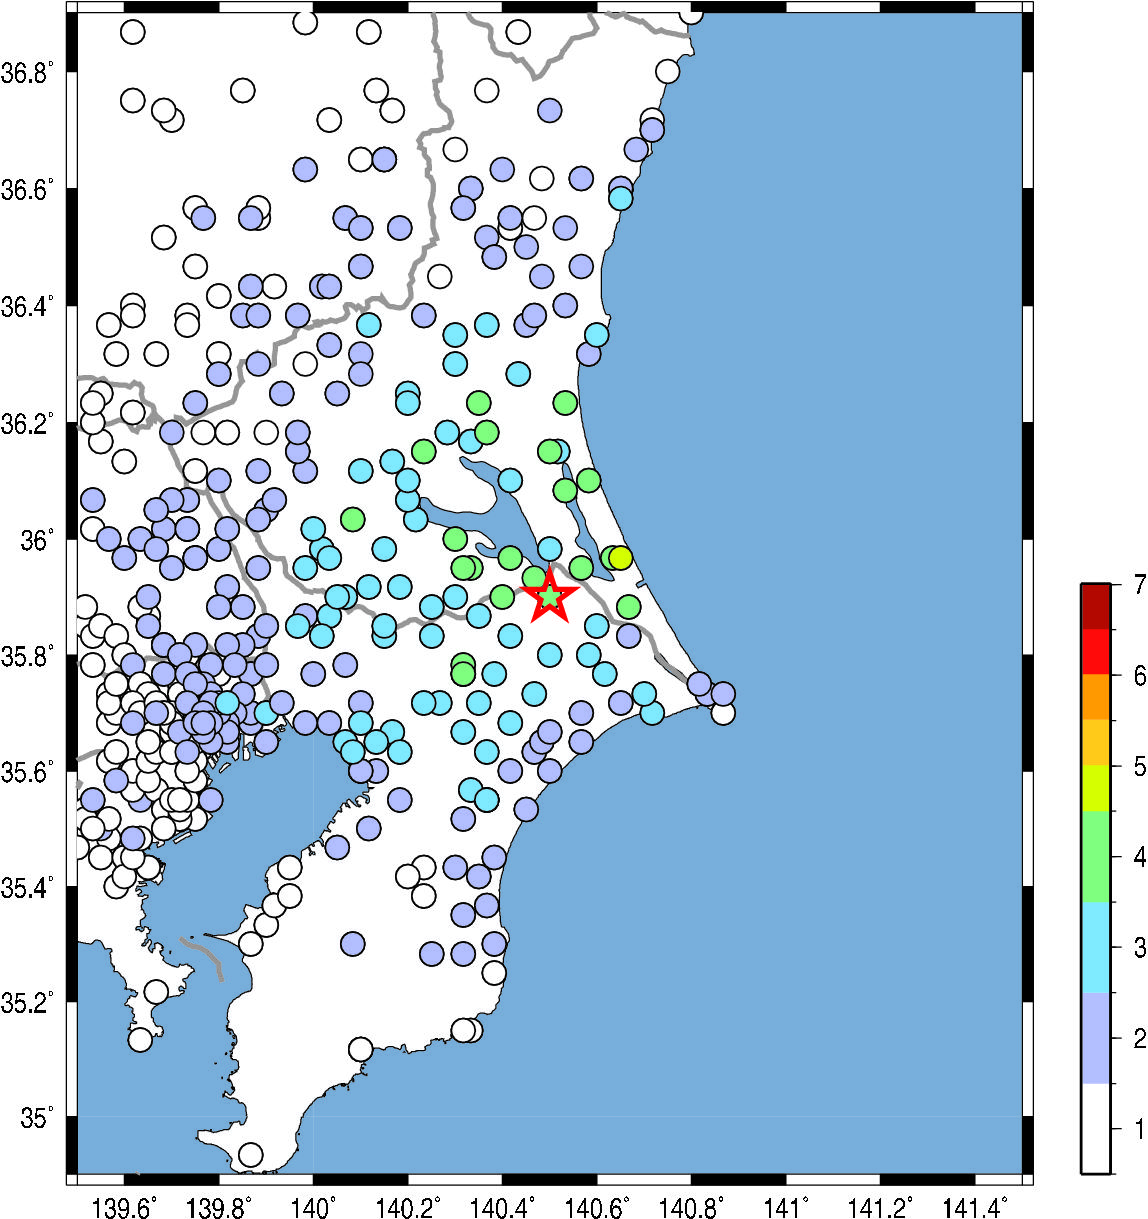
Fig.4. JMA seismic intensity.
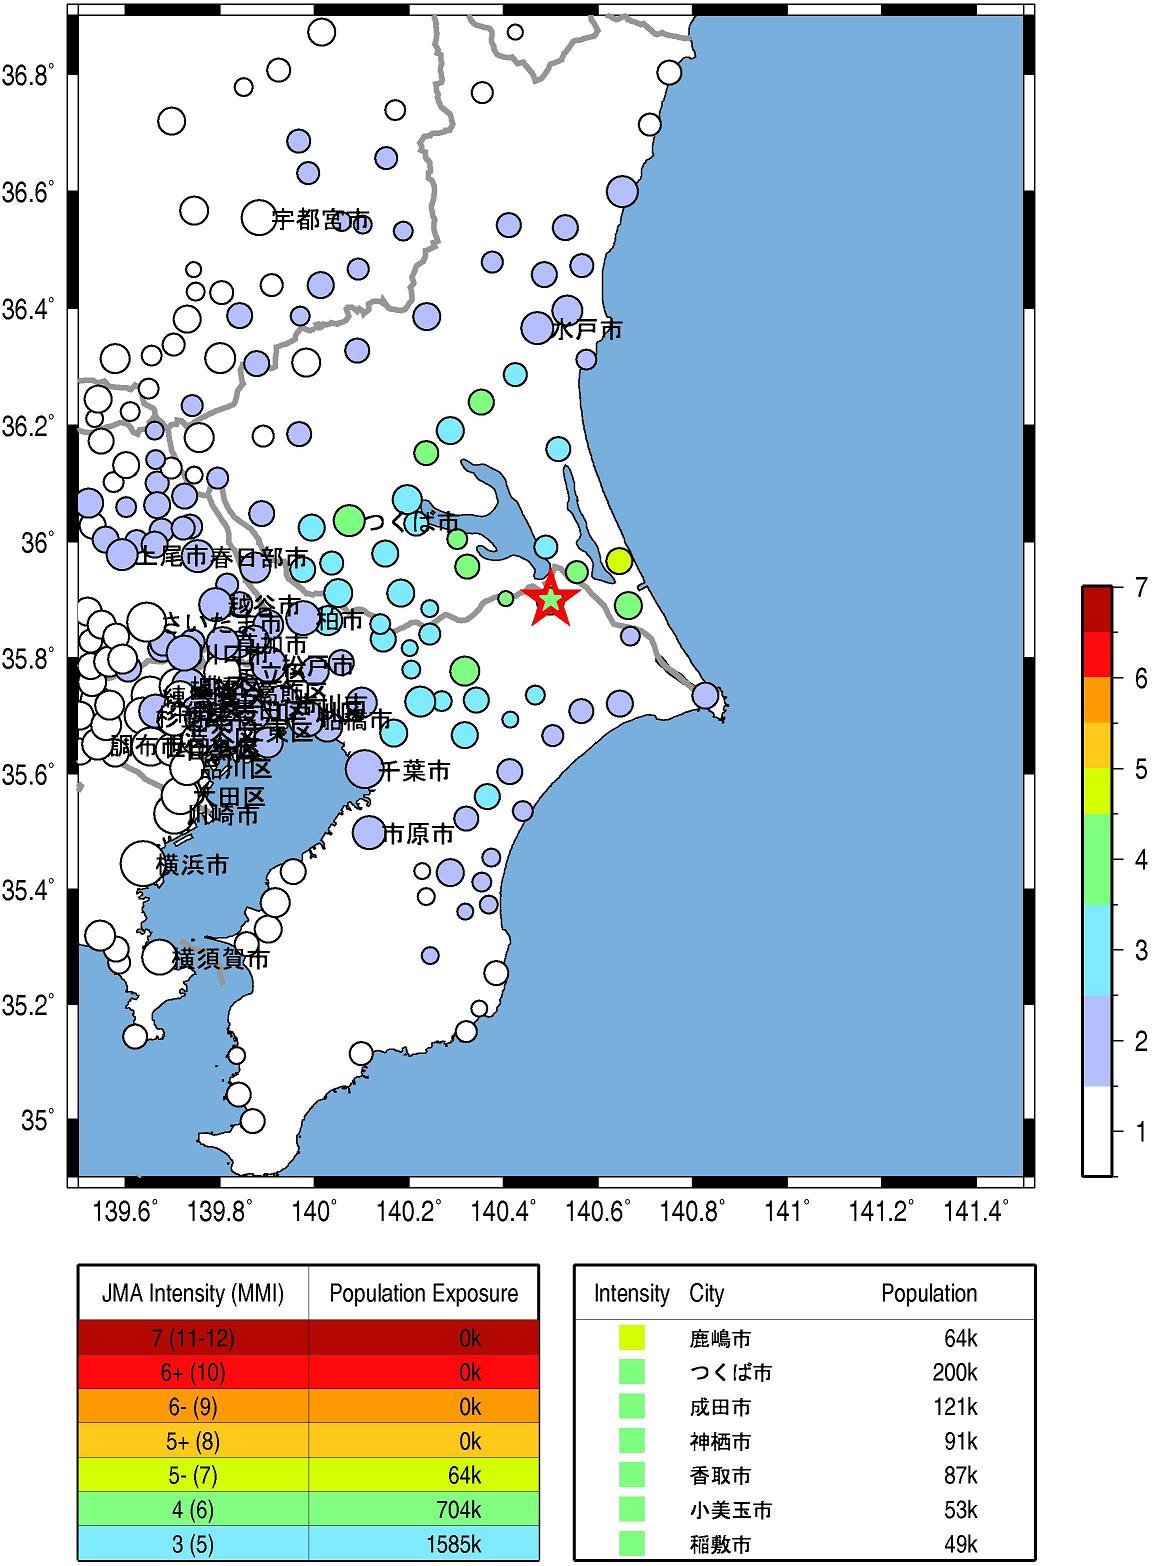
Fig.5. Population exposure. A circle size shows the population at the town, and a circle color shows the seismic intensity at the town.
Wu, Y. M. and H. Kanamori (2005). Experiment on an onsite early warning method for the Taiwan early warning system, Bull. Seism. Soc. Am., 95, 347-353.
気象庁の震度情報、防災科学技術研究所のK-NET,KiK-netの波形を利用しました。
緊急地震速報を発表した地震の解析結果
山田真澄 ホーム