━━━━━━━━━━━━━━━━━━━━━━━━
2010年7月21日 奈良県の地震
━━━━━━━━━━━━━━━━━━━━━━━━
1.地震について (Earthquake Information)
----------------------------------------------------
2010/07/21,06:19:18.978 34.2079 135.6953 56.2 5.1
----------------------------------------------------
Table1. Earthquake information. Origin time, Epicentral latitude, longitude, depth, and JMA magnitude from the left.(ref. JMA source mechanism)
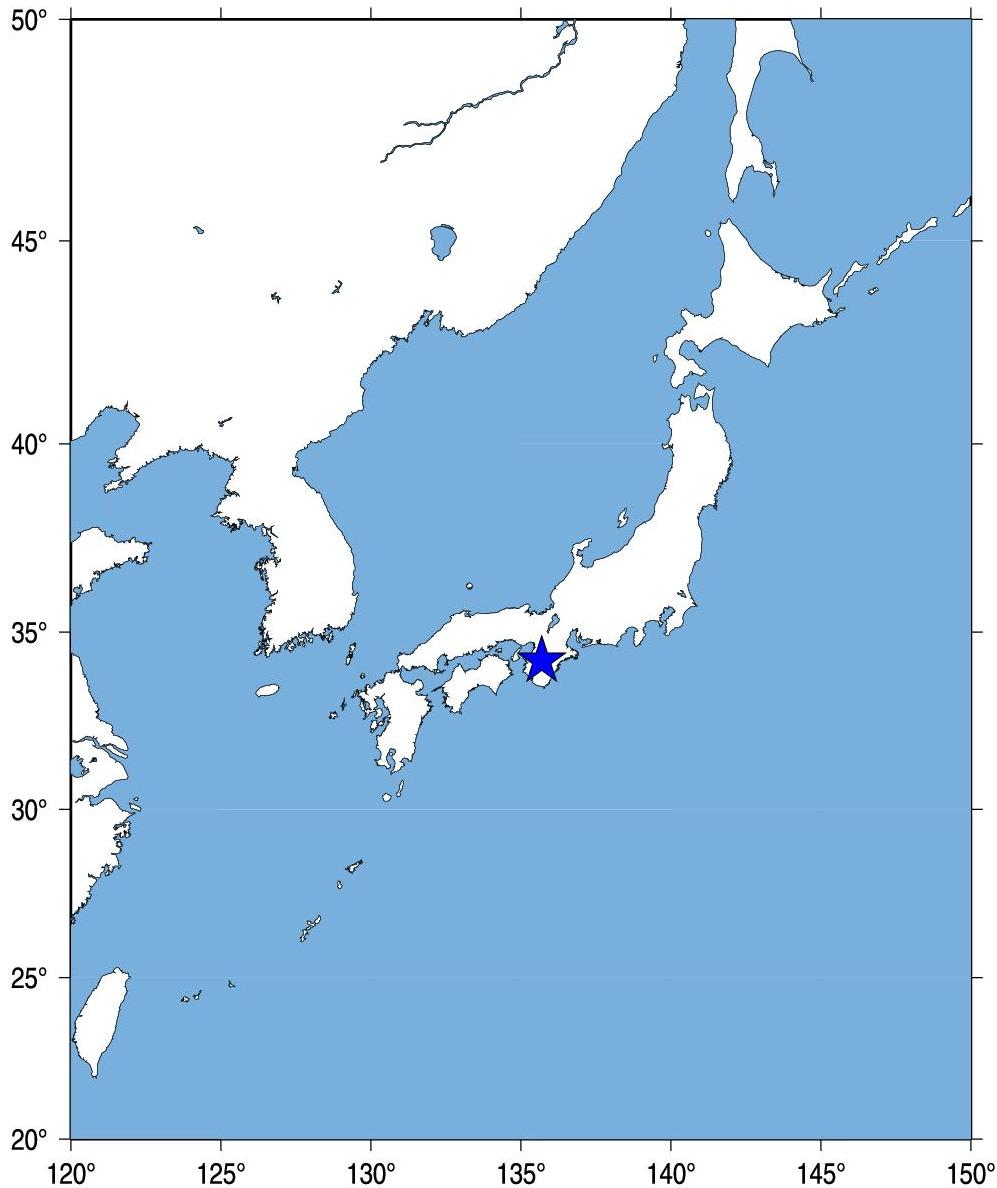
Fig.1. Event location.
2.観測点分布 (Station Distribution)
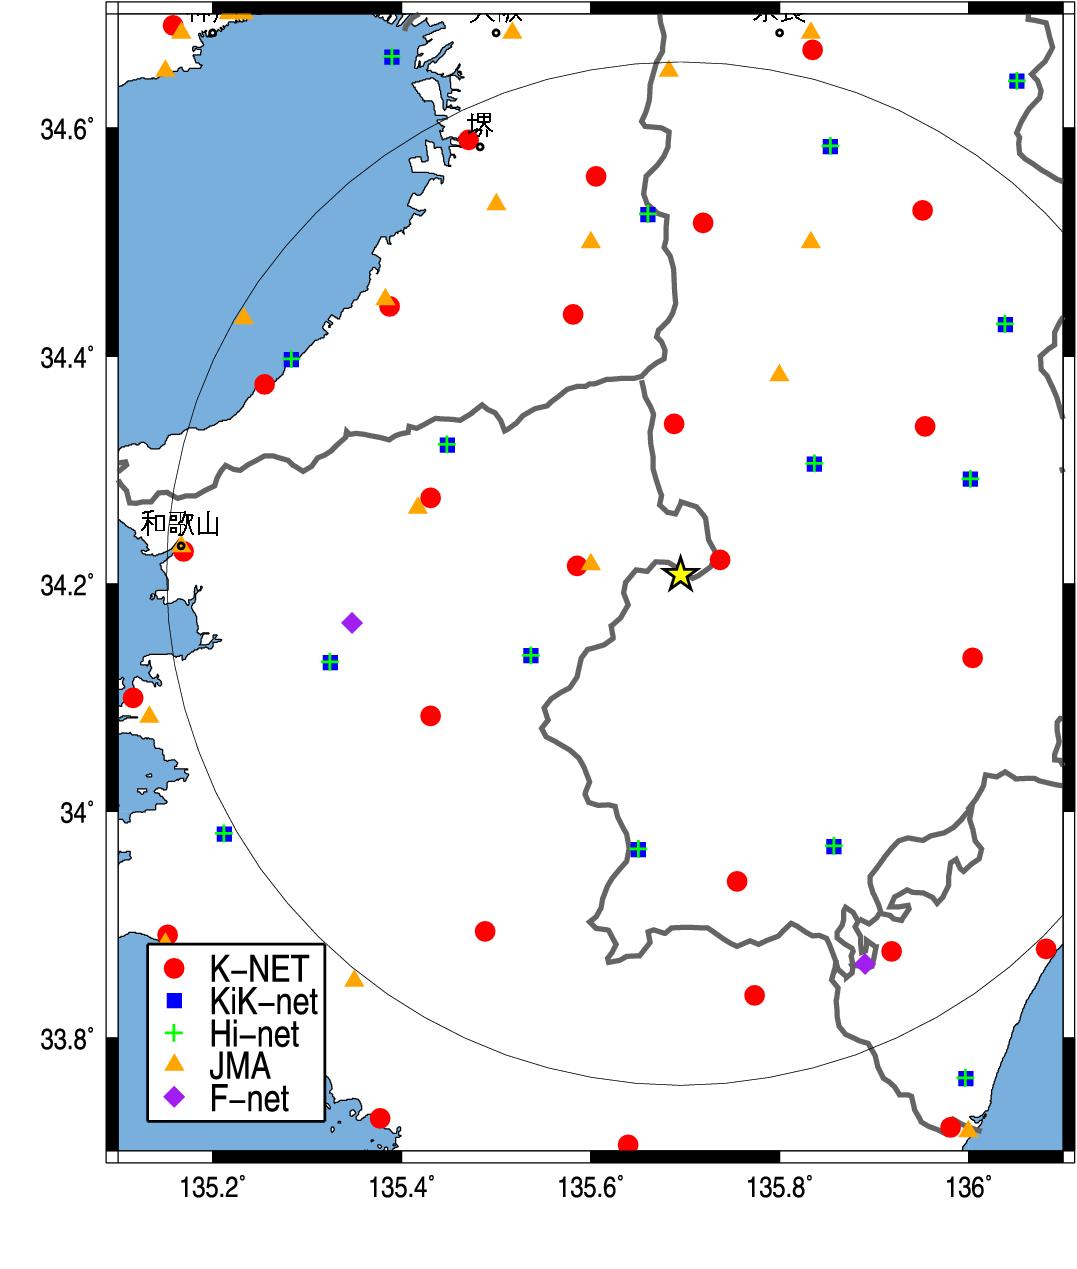
Fig.2. Station Distribution.
3.緊急地震速報発信状況 (Earthquake Early Warning Report)
-------------------------------------------------------------------[01] 10/07/21-06:19:18 03 M4.6 34.2N 135.7E 060km (10/07/21-06:19:31)
[04] 10/07/21-06:19:18 03 M4.5 34.2N 135.7E 060km (10/07/21-06:19:38)
[05] 10/07/21-06:19:18 03 M4.9 34.2N 135.7E 060km (10/07/21-06:19:40)
[06] 10/07/21-06:19:18 03 M5.1 34.2N 135.7E 060km (10/07/21-06:19:57)
[07] 10/07/21-06:19:18 03 M5.1 34.2N 135.7E 060km (10/07/21-06:20:11)
---------------------------------------------------------------------
(左から順に情報番号,震源時,最大予測震度,マグニチュード, 震央緯度,震央経度,震源深さ,電文発表時刻) from CEORKA
-------------------------------------------------------------------
Table2. Earthquake early warning reports. Information ID, Origin time, Maximum Intensity, JMA magnitude, Epicentral latitude, longitude, depth, and time to issue the report from the left.(ref. The Committee of Earthquake Observation and Research in the Kansai Area)
--> 気象庁による緊急地震速報の内容
4.解析結果 (Analytical Result)
-------------------------------------------------------
NAR0071007210619 135.737 34.221 0.382 8.362 4.111 5.1 4.6
WKY0131007210619 135.586 34.216 0.588 8.532 10.112 5.1 5.0
NAR0051007210619 135.688 34.341 0.467 8.662 14.756 5.1 4.8
NARH041007210619 135.840 34.303 0.517 8.682 16.963 5.1 4.9
WKY0021007210619 135.430 34.276 0.532 9.212 25.521 5.1 4.9
WKYH081007210619 135.451 34.319 1.107 9.442 25.667 5.1 5.6
NARH011007210619 135.652 33.963 0.469 9.002 27.428 5.1 4.8
OSK0091007210619 135.582 34.437 0.483 9.212 27.442 5.1 4.8
NAR0061007210619 135.954 34.338 0.285 9.142 27.879 5.1 4.3
WKY0041007210619 135.431 34.084 0.526 9.142 27.986 5.1 4.9
Observed/Estimated Mw(median) 4.9
-------------------------------------------------------
Table3. Analytical results using Tau_c method (Wu and Kanamori, 2005). Station ID, Station longitude, latitude, tauc, P-arrival time, epicentral distance(km) , magnitude, and estimated magnitude from the left.
5.観測記録 (Observed Records)
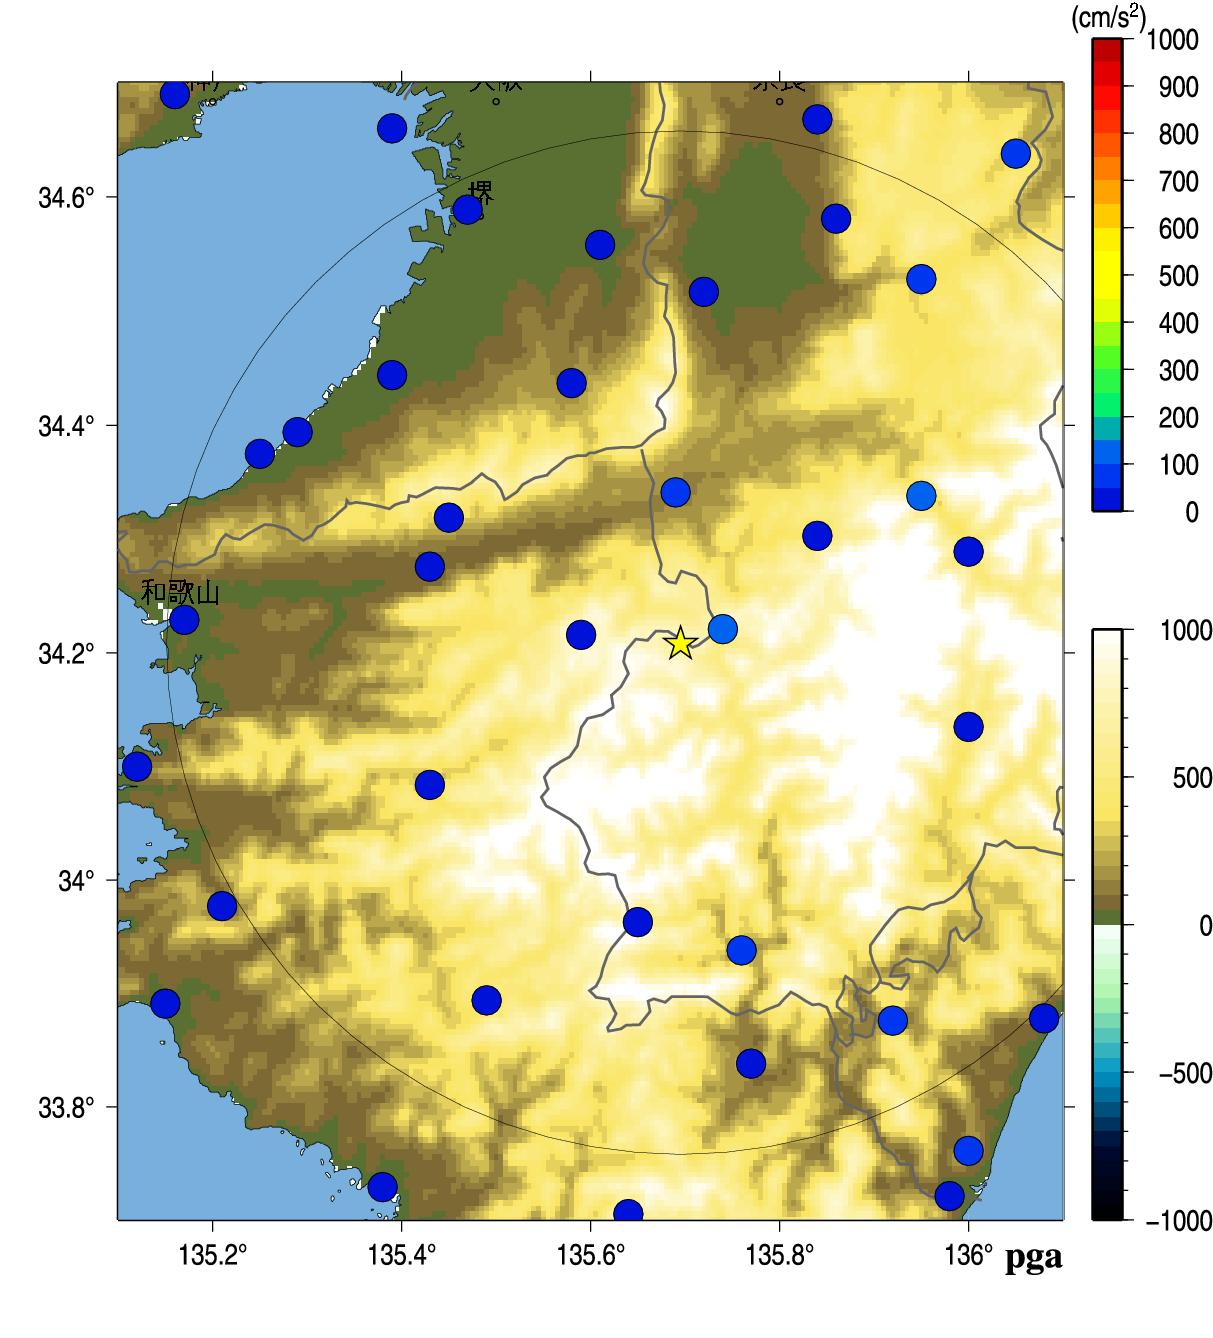
Fig.3. Peak Ground Acceleration.
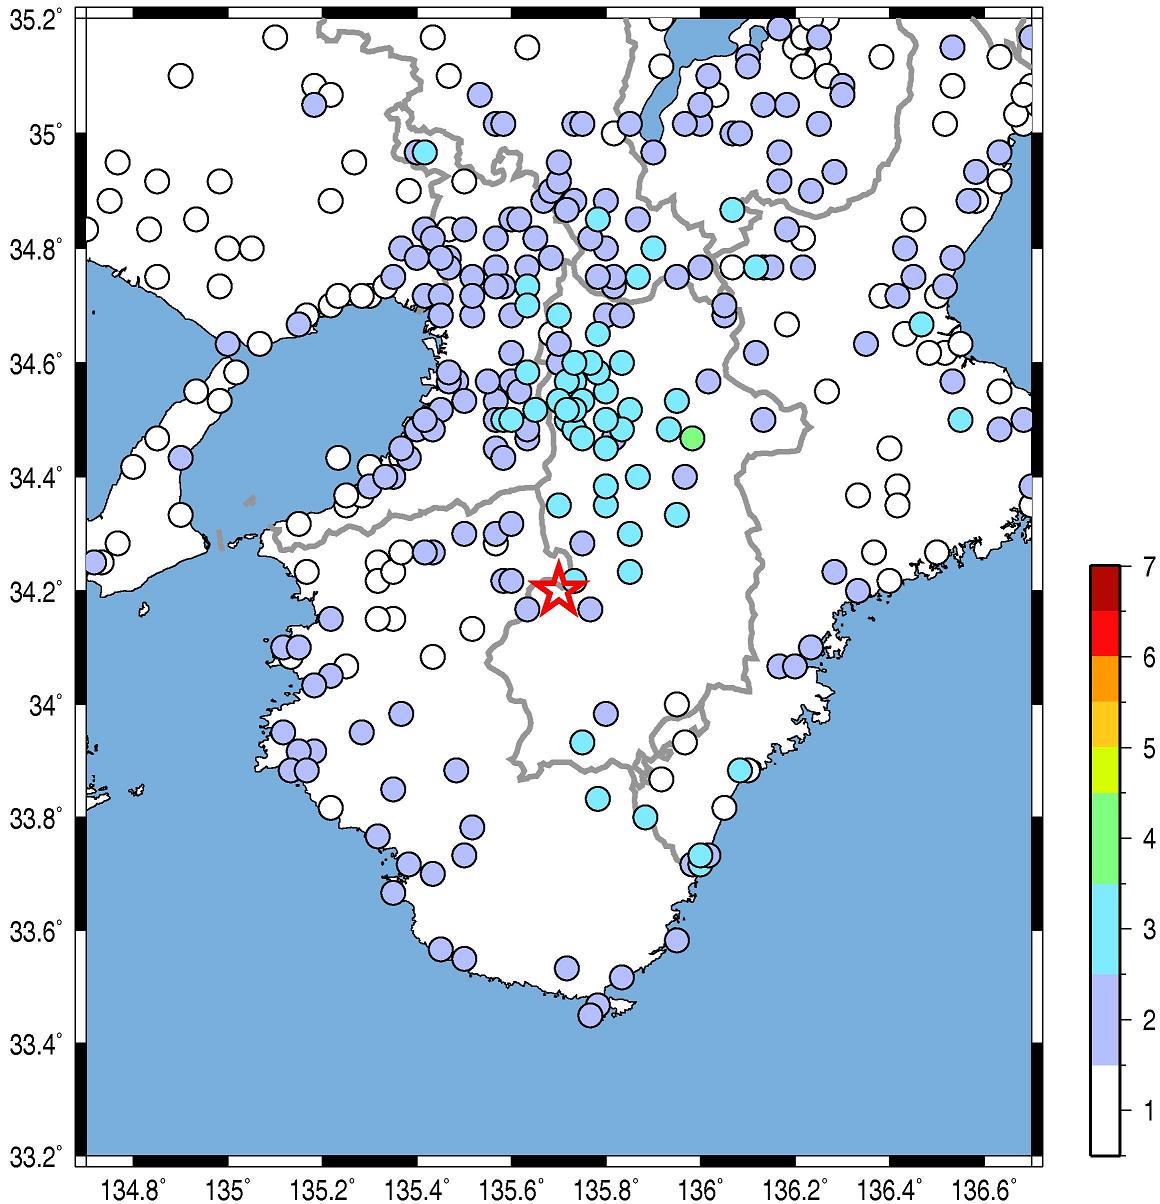
Fig.4. JMA seismic intensity.
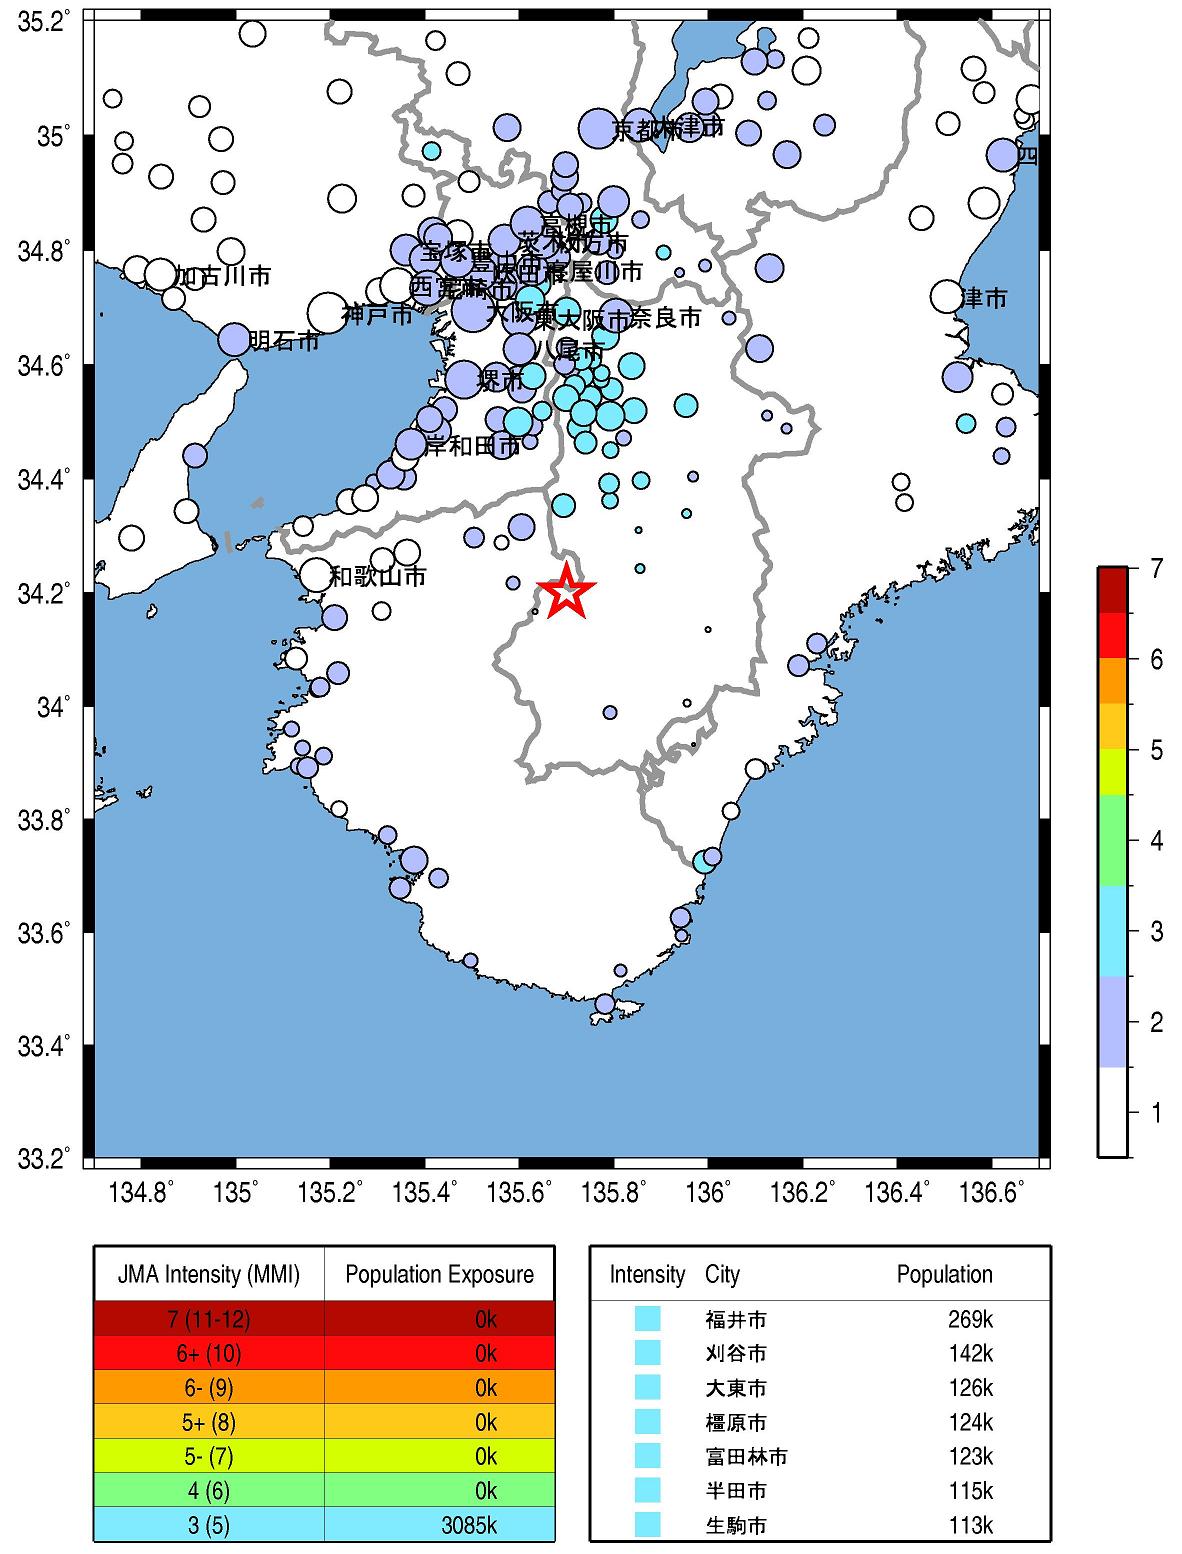
Fig.5. Population exposure. A circle size shows the population at the town, and a circle color shows the seismic intensity at the town.
Wu, Y. M. and H. Kanamori (2005). Experiment on an onsite early warning method for the Taiwan early warning system, Bull. Seism. Soc. Am., 95, 347-353.
気象庁の震度情報、防災科学技術研究所のK-NET,KiK-netの波形を利用しました。
緊急地震速報を発表した地震の解析結果
山田真澄 ホーム