━━━━━━━━━━━━━━━━━━━━━━━━
2010年3月14日 福島沖の地震
━━━━━━━━━━━━━━━━━━━━━━━━
1.地震について (Earthquake Information)
----------------------------------------------------
2010/03/14,17:08:04.18 37.724 141.818 39.8 6.7
----------------------------------------------------
Table1. Earthquake information. Origin time, Epicentral latitude, longitude, depth, and JMA magnitude from the left.(ref. JMA source mechanism)
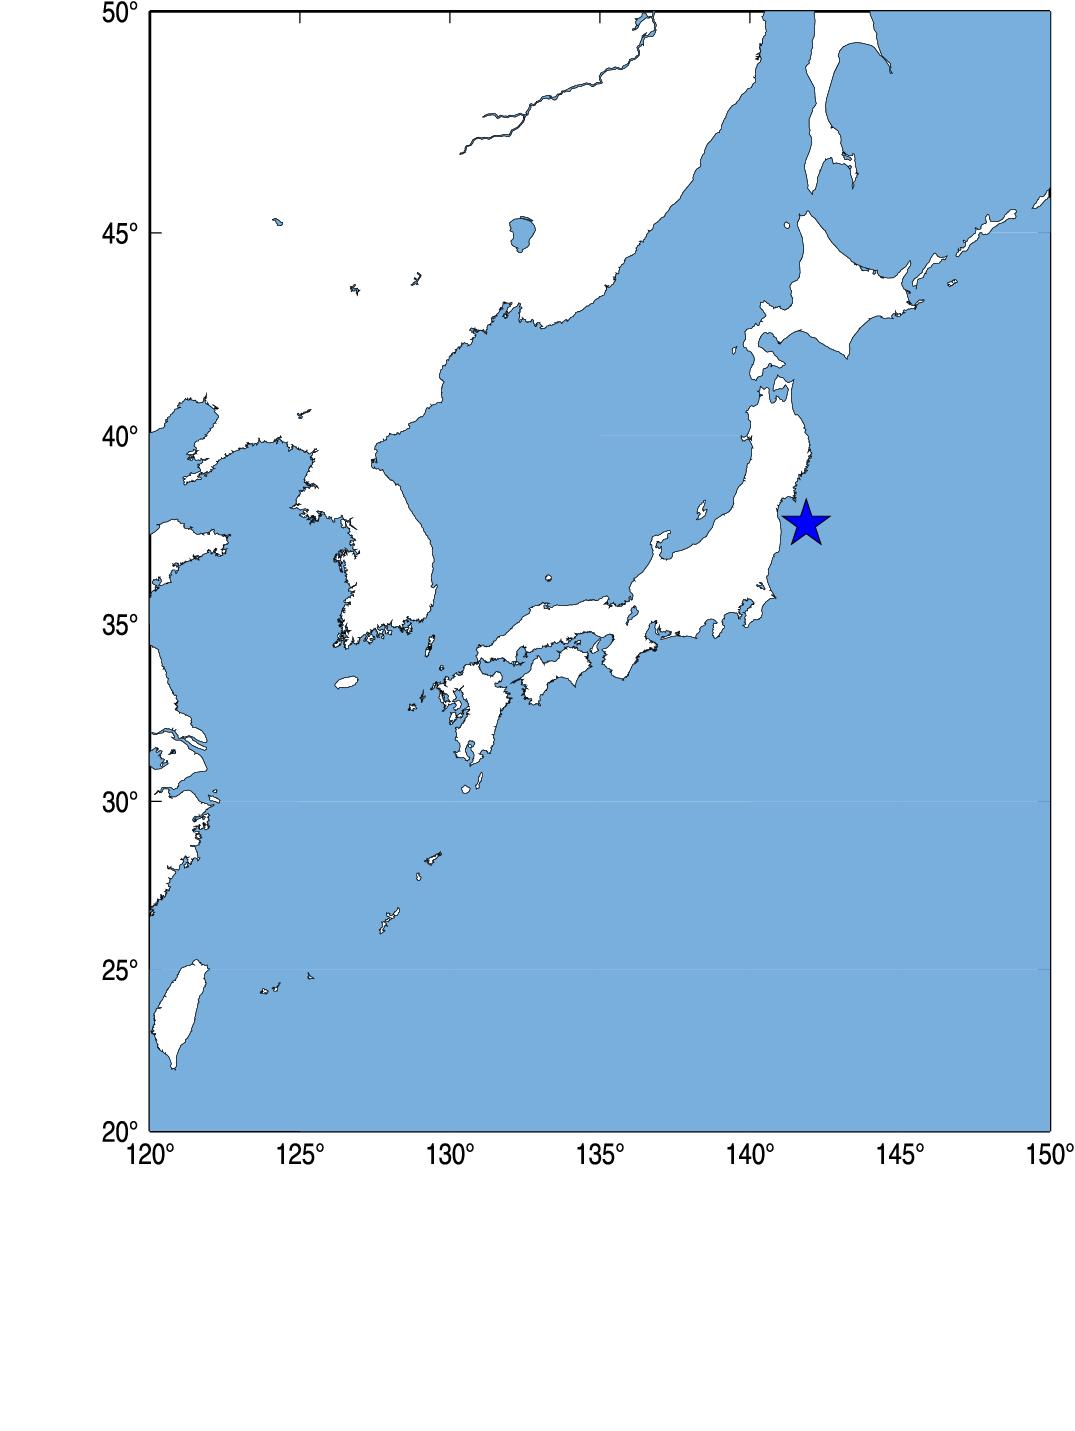
Fig.1. Event location.
2.観測点分布 (Station Distribution)
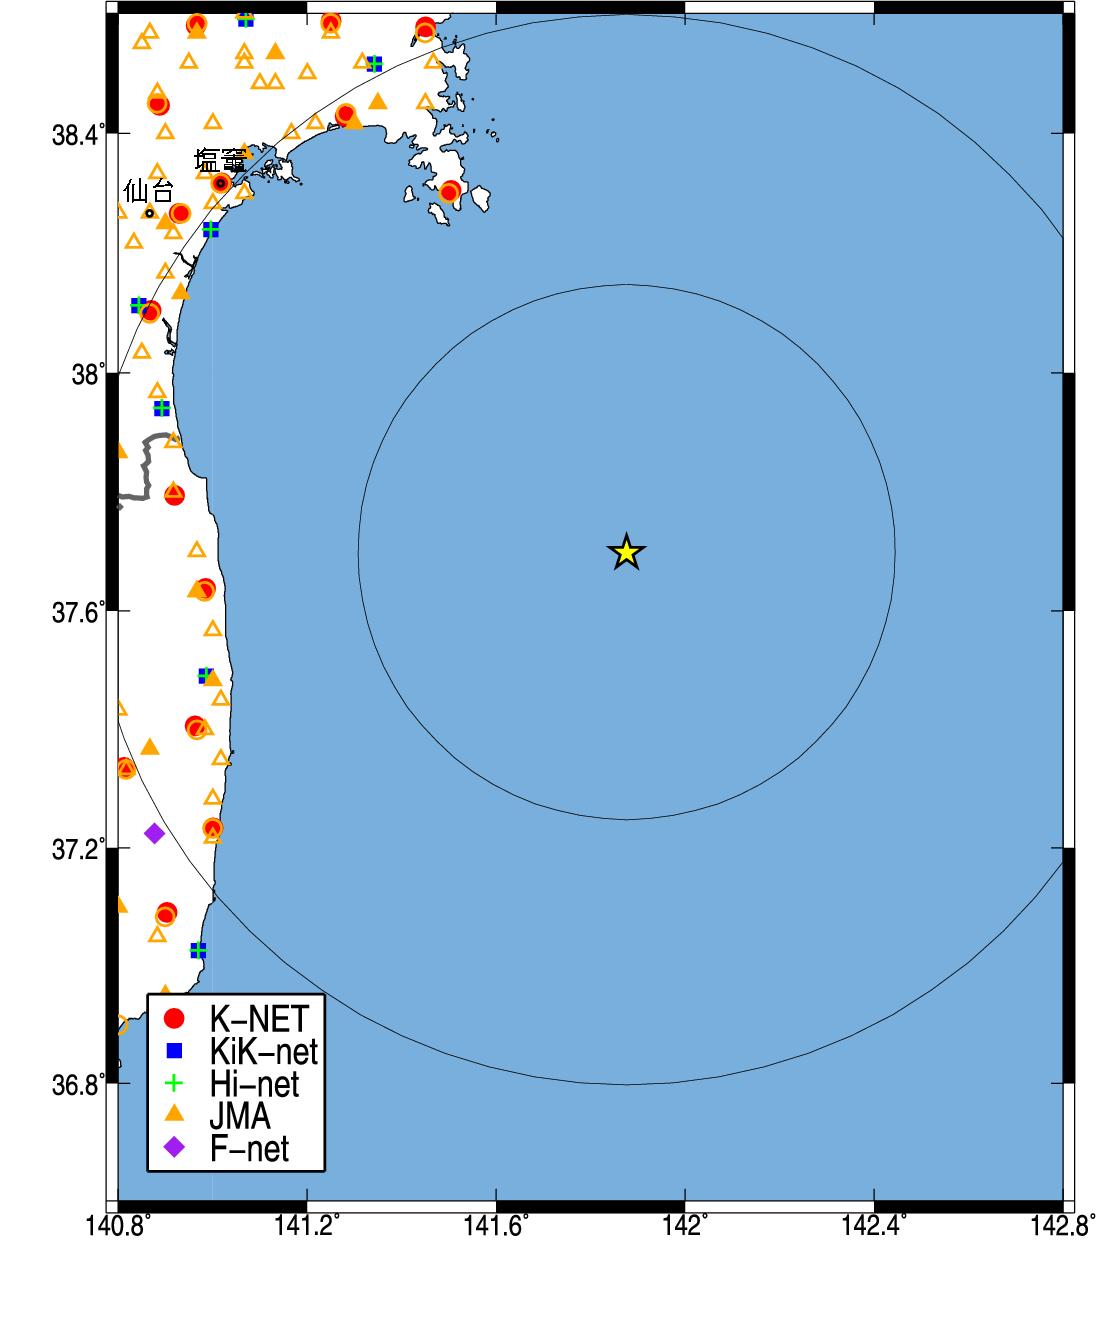
Fig.2. Station Distribution.
3.緊急地震速報発信状況 (Earthquake Early Warning Report)
-------------------------------------------------------------------[01] 10/03/14-17:08:04 4 M6.7 37.7N 141.9E 40km (10/03/14-17:08:22.5)
[02] 10/03/14-17:08:04 5- M6.9 37.7N 141.9E 10km (10/03/14-17:08:22.9)
[03] 10/03/14-17:08:04 4 M6.7 37.7N 141.9E 40km (10/03/14-17:08:24.1)
[04] 10/03/14-17:08:04 5- M6.8 37.7N 141.9E 20km (10/03/14-17:08:27.6)
[05] 10/03/14-17:08:04 5- M6.8 37.7N 141.9E 20km (10/03/14-17:08:30.1)
[06] 10/03/14-17:08:04 4 M6.5 37.7N 141.9E 20km (10/03/14-17:08:38.6)
[07] 10/03/14-17:08:04 4 M6.6 37.7N 142.0E 20km (10/03/14-17:08:49.2)
[08] 10/03/14-17:09:04 4 M6.6 37.7N 141.9E 10km (10/03/14-17:09:09.3)
[09] 10/03/14-17:09:04 4 M6.6 37.7N 141.9E 10km (10/03/14-17:09:16.6)
---------------------------------------------------------------------
(左から順に情報番号,震源時,最大予測震度,マグニチュード, 震央緯度,震央経度,震源深さ,電文発表時刻) from CEORKA
-------------------------------------------------------------------
Table2. Earthquake early warning reports. Information ID, Origin time, Maximum Intensity, JMA magnitude, Epicentral latitude, longitude, depth, and time to issue the report from the left.(ref. The Committee of Earthquake Observation and Research in the Kansai Area)
--> 気象庁による緊急地震速報の内容
4.解析結果 (Analytical Result)
-------------------------------------------------------
MYG0111003141708.z 141.504 38.305 2.853 12.408 74.920 6.7
FKS0051003141708.z 140.985 37.639 1.445 13.268 78.930 6.7
FKSH201003141708.z 140.991 37.488 0.468 10.488 81.619 6.7
FKS0011003141708.z 140.920 37.795 1.605 13.898 85.013 6.7
FKS0071003141708.z 140.963 37.406 2.397 14.228 86.947 6.7
MYGH101003141708.z 140.896 37.938 2.043 5.308 90.367 6.7
FKS0101003141708.z 141.002 37.234 2.497 15.518 92.933 6.7
MYG0101003141708.z 141.281 38.428 1.659 15.458 96.456 6.7
MYGH011003141708.z 141.000 38.237 1.098 15.598 97.511 6.7
MYG0151003141708.z 140.870 38.105 1.309 15.798 99.387 6.7
-------------------------------------------------------
Table3. Analytical results using Tau_c method (Wu and Kanamori, 2005). Station ID, Station longitude, latitude, tauc, P-arrival time, epicentral distance(km) , and magnitude from the left.
5.観測記録 (Observed Records)
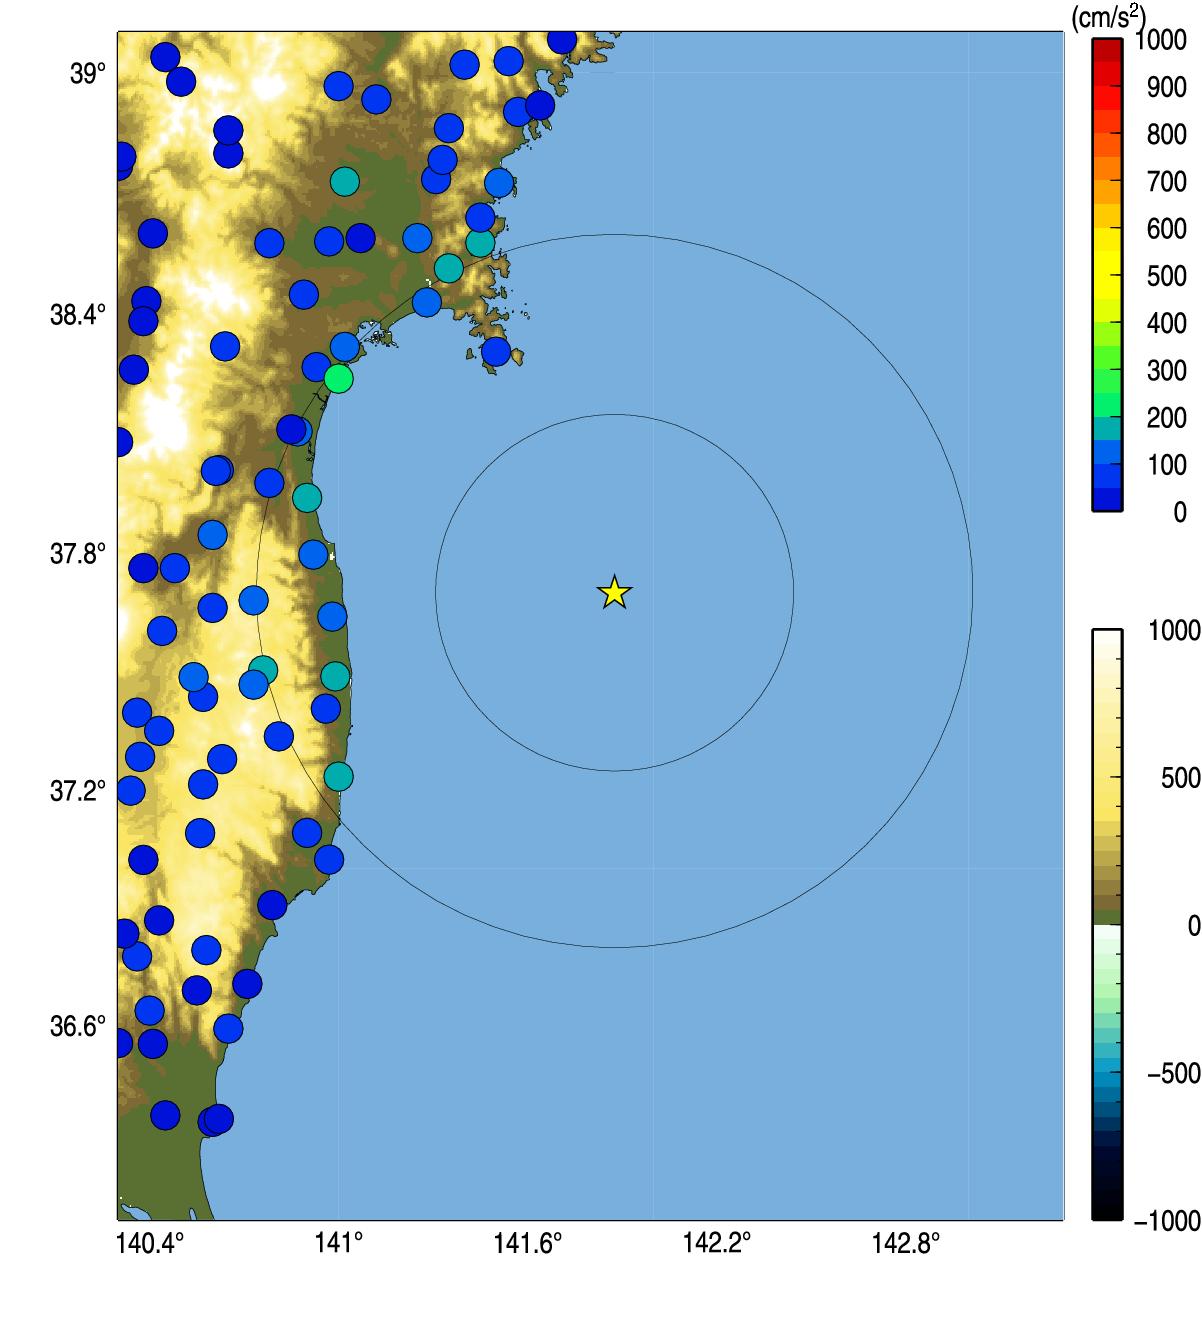
Fig.3. Peak Ground Acceleration.
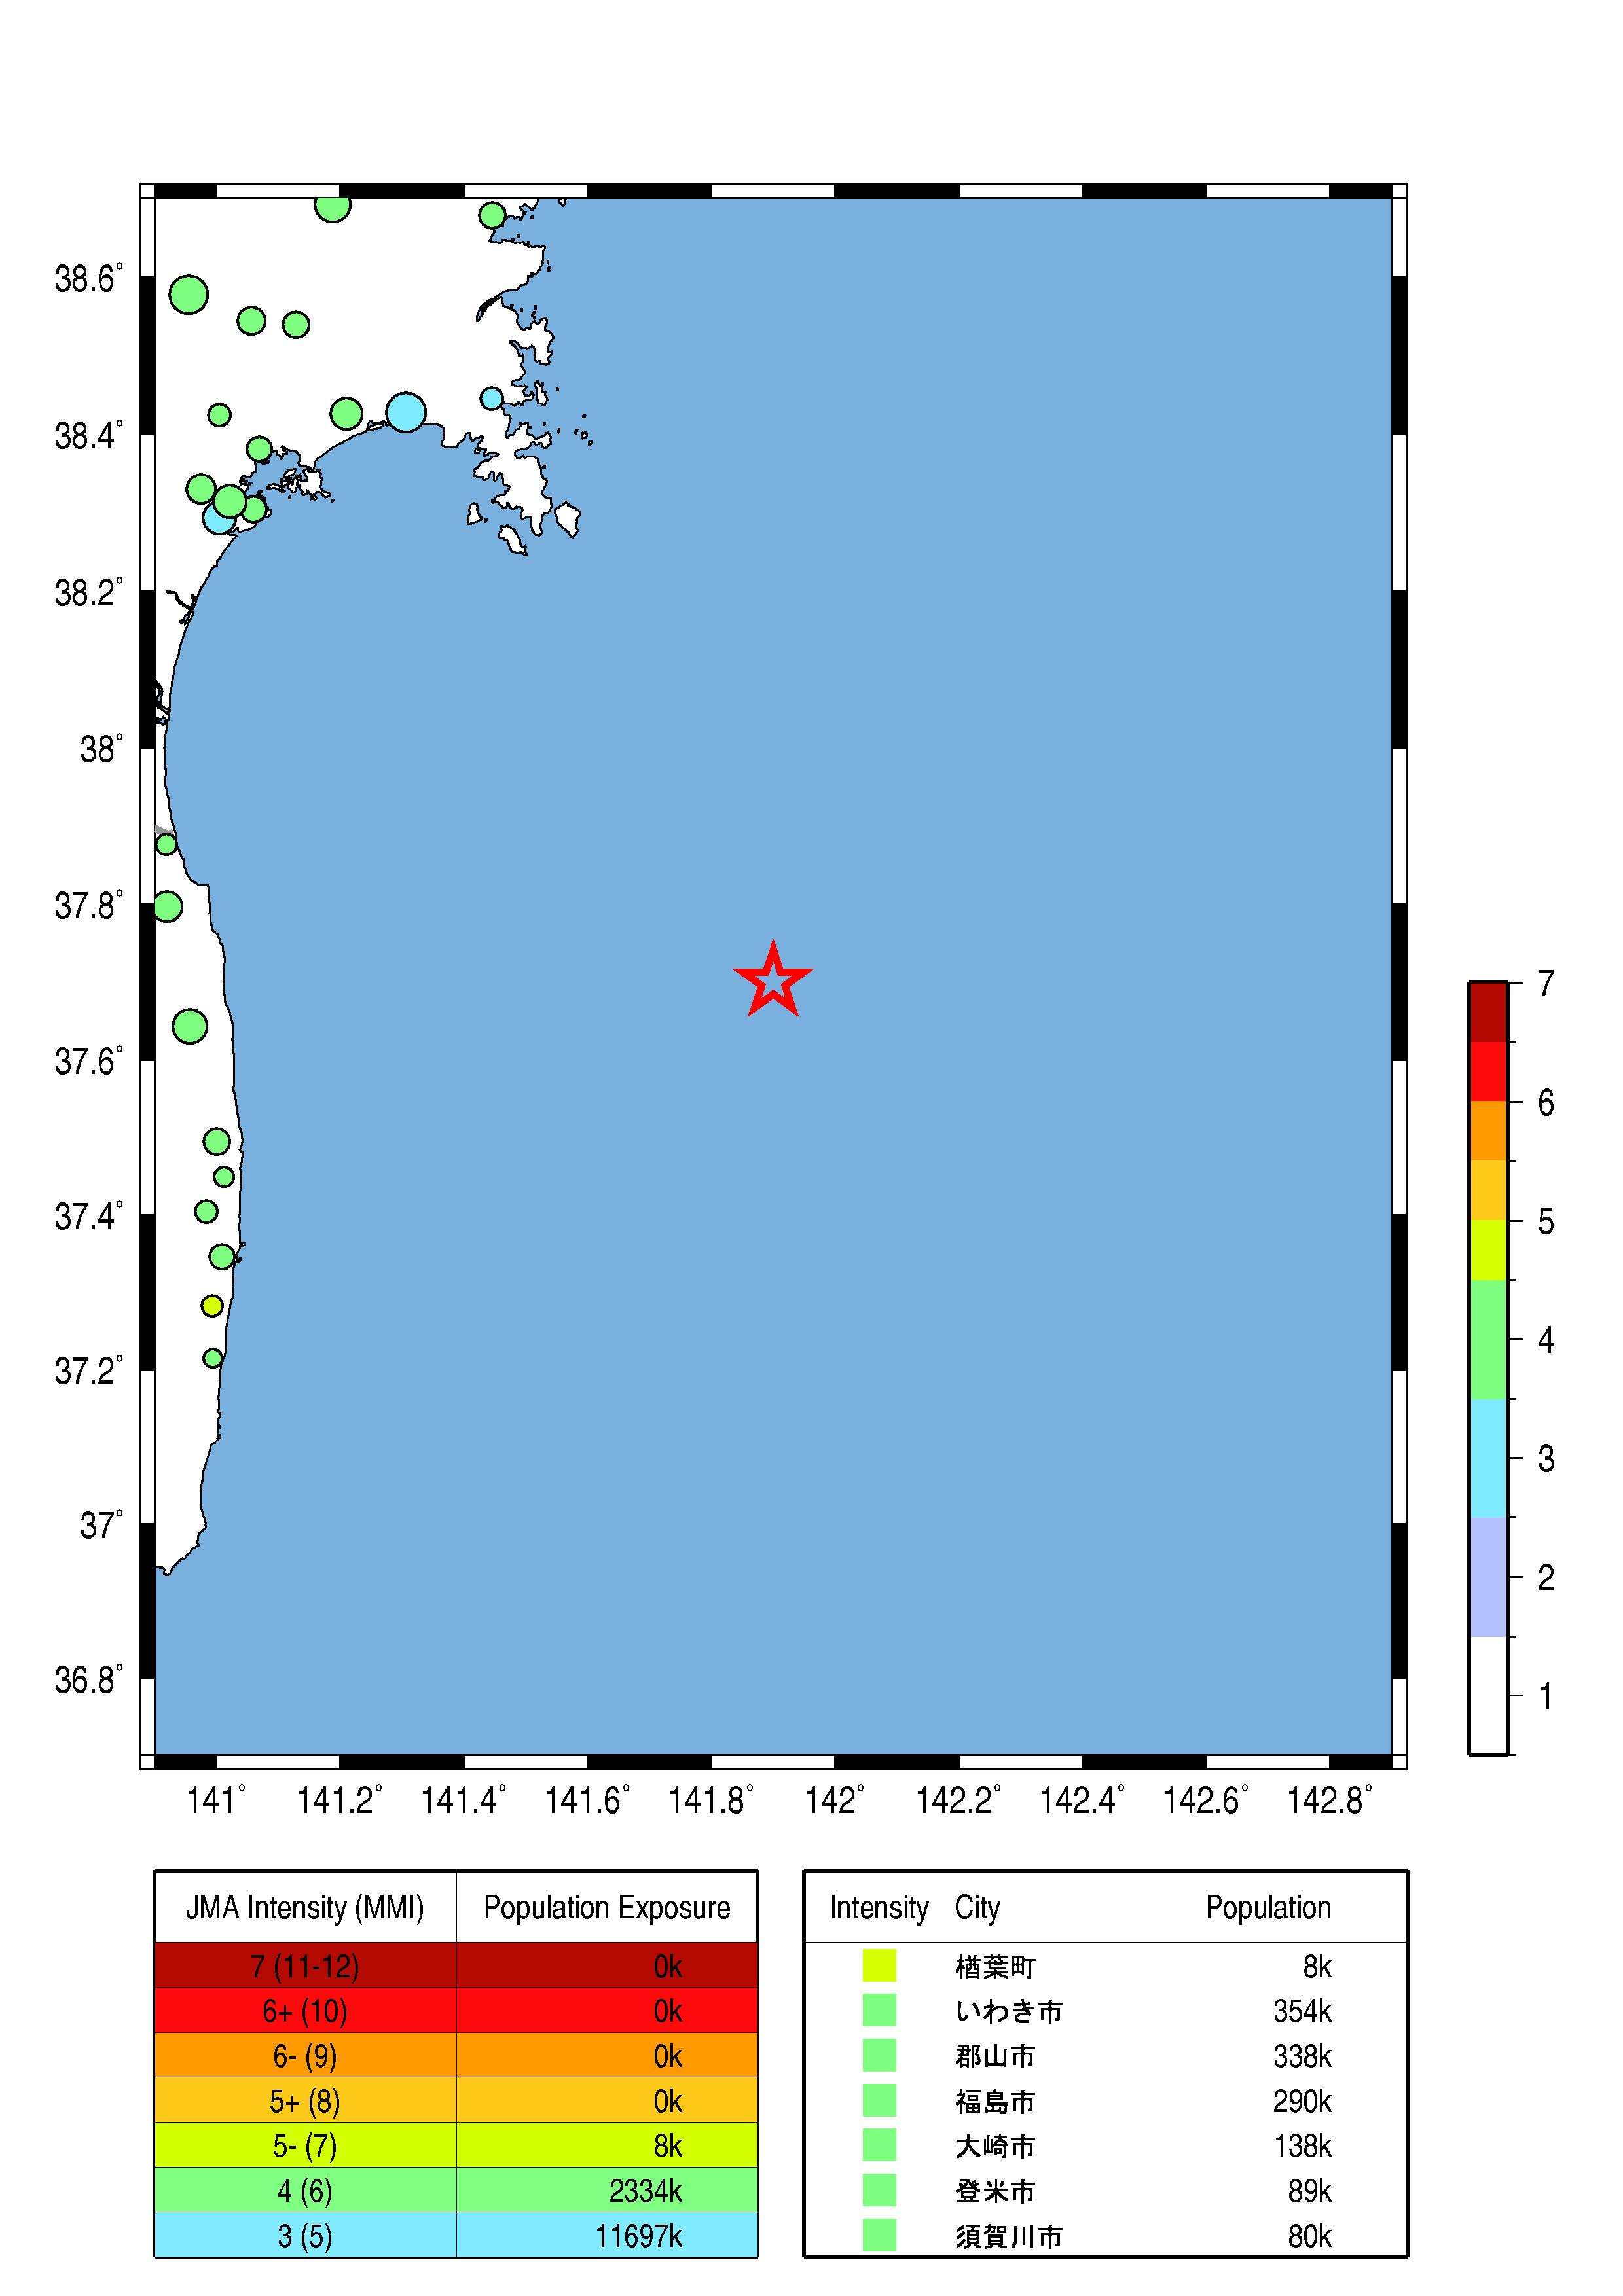
Fig.4. Population exposure. A circle size shows the population at the town, and a circle color shows the seismic intensity at the town.
Wu, Y. M. and H. Kanamori (2005). Experiment on an onsite early warning method for the Taiwan early warning system, Bull. Seism. Soc. Am., 95, 347-353.
気象庁の震度情報、防災科学技術研究所のK-NET,KiK-netの波形を利用しました。
緊急地震速報を発表した地震の解析結果
山田真澄 ホーム