━━━━━━━━━━━━━━━━━━━━━━━━
2024年4月2日 台湾花蓮地方の地震 (ML7.2)
━━━━━━━━━━━━━━━━━━━━━━━━
1.地震について (Earthquake Information)
-------------------------------------------------------------------2024/04/02,23:58:09 23.77 121.66 15.5 7.2
-------------------------------------------------------------------
Table1. Earthquake information. Origin time, Epicentral latitude, longitude, depth, and JMA magnitude from the left.
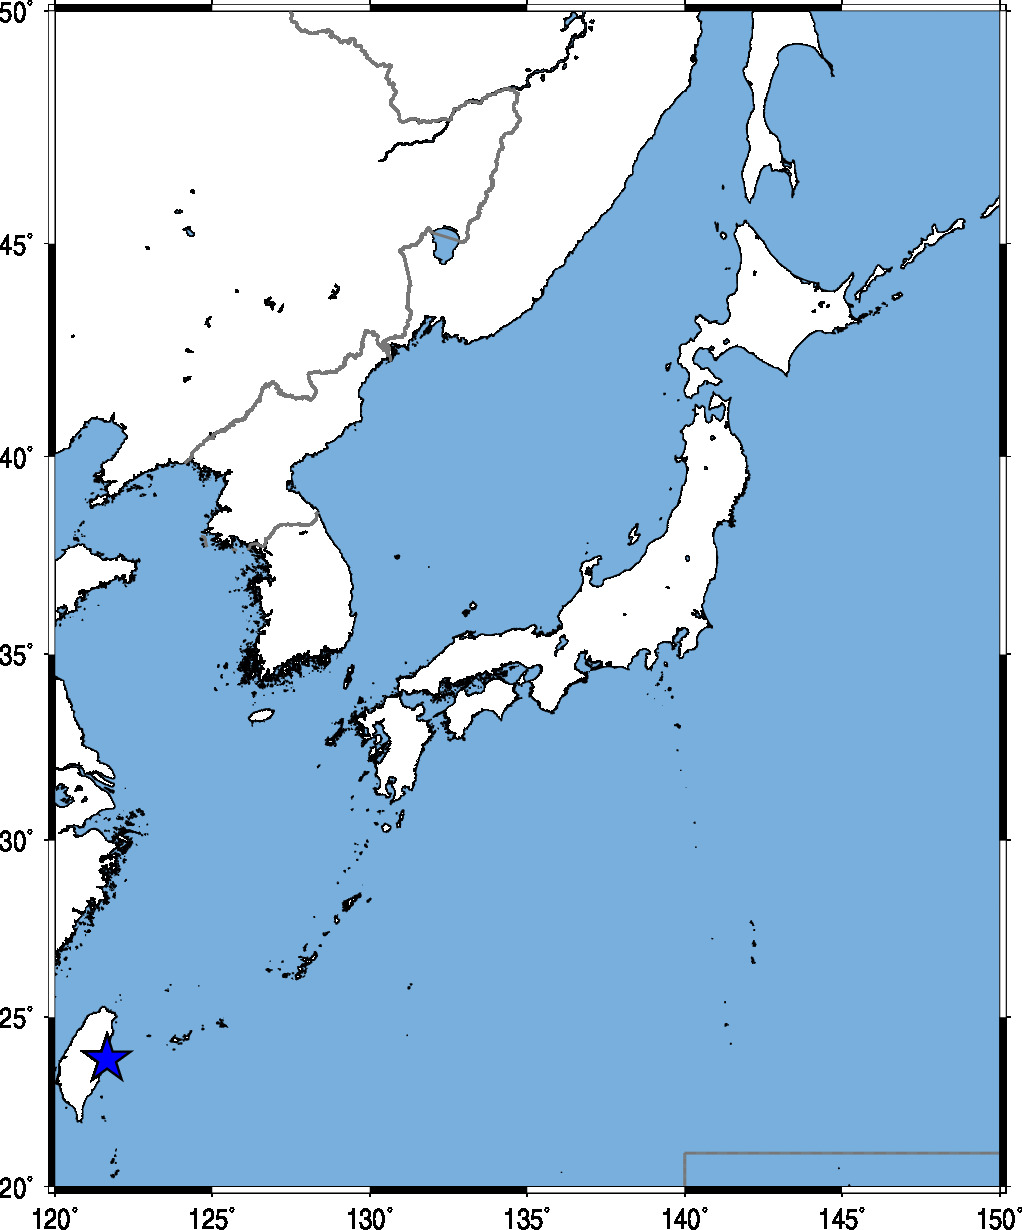
Fig.1. Event location.
台湾中央気象署による地震情報: Earthquake Information
2.観測記録 (Observed Records)
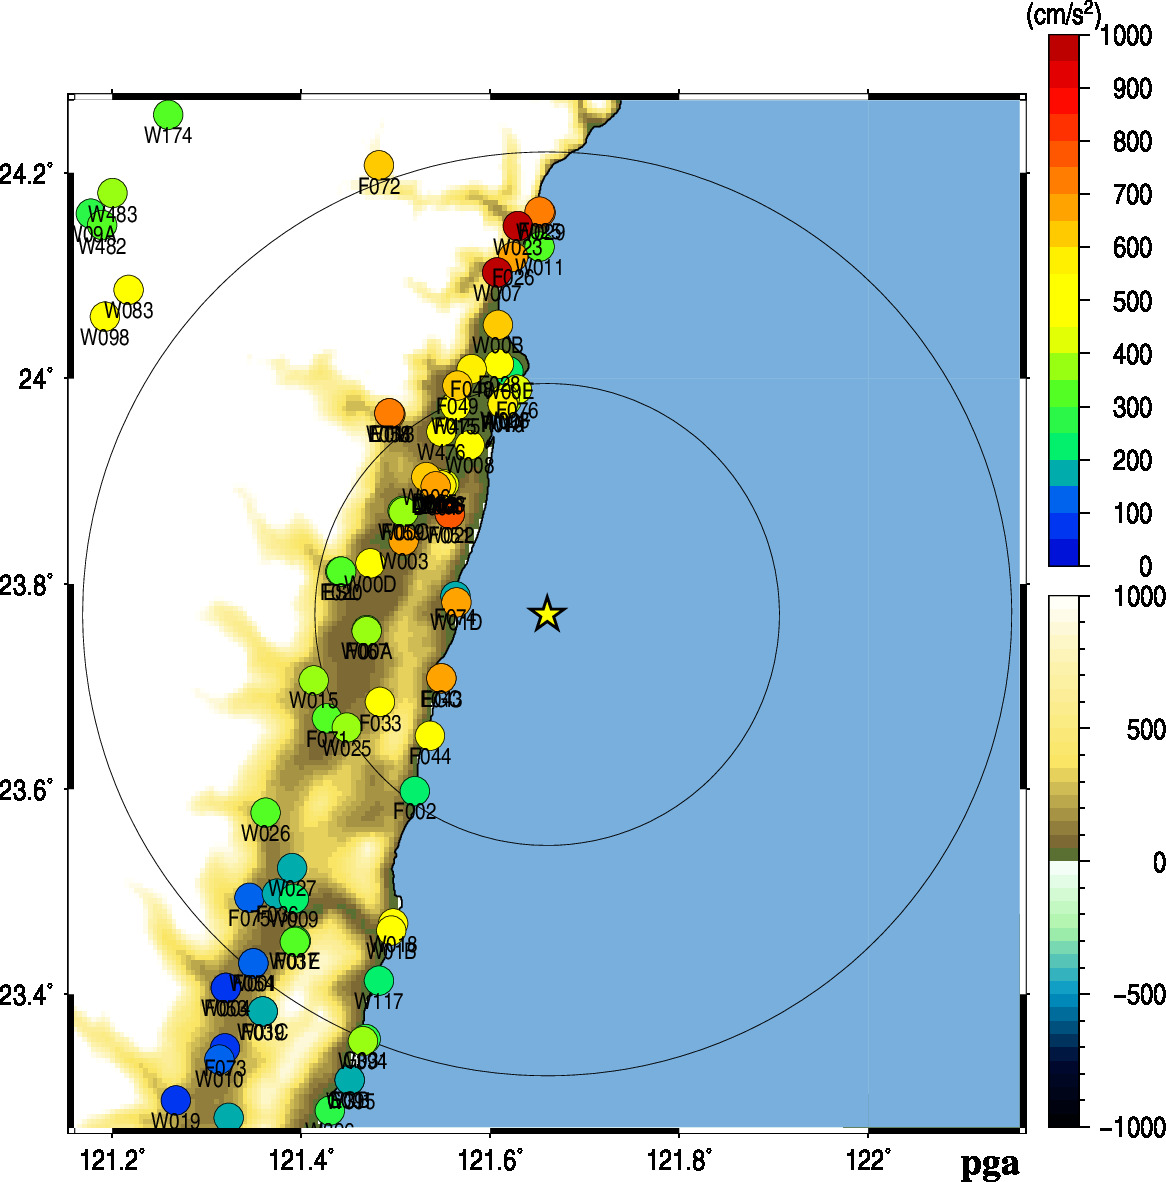

Fig.2. Peak Ground Acceleration (left) and Peak Ground Velocity (right).
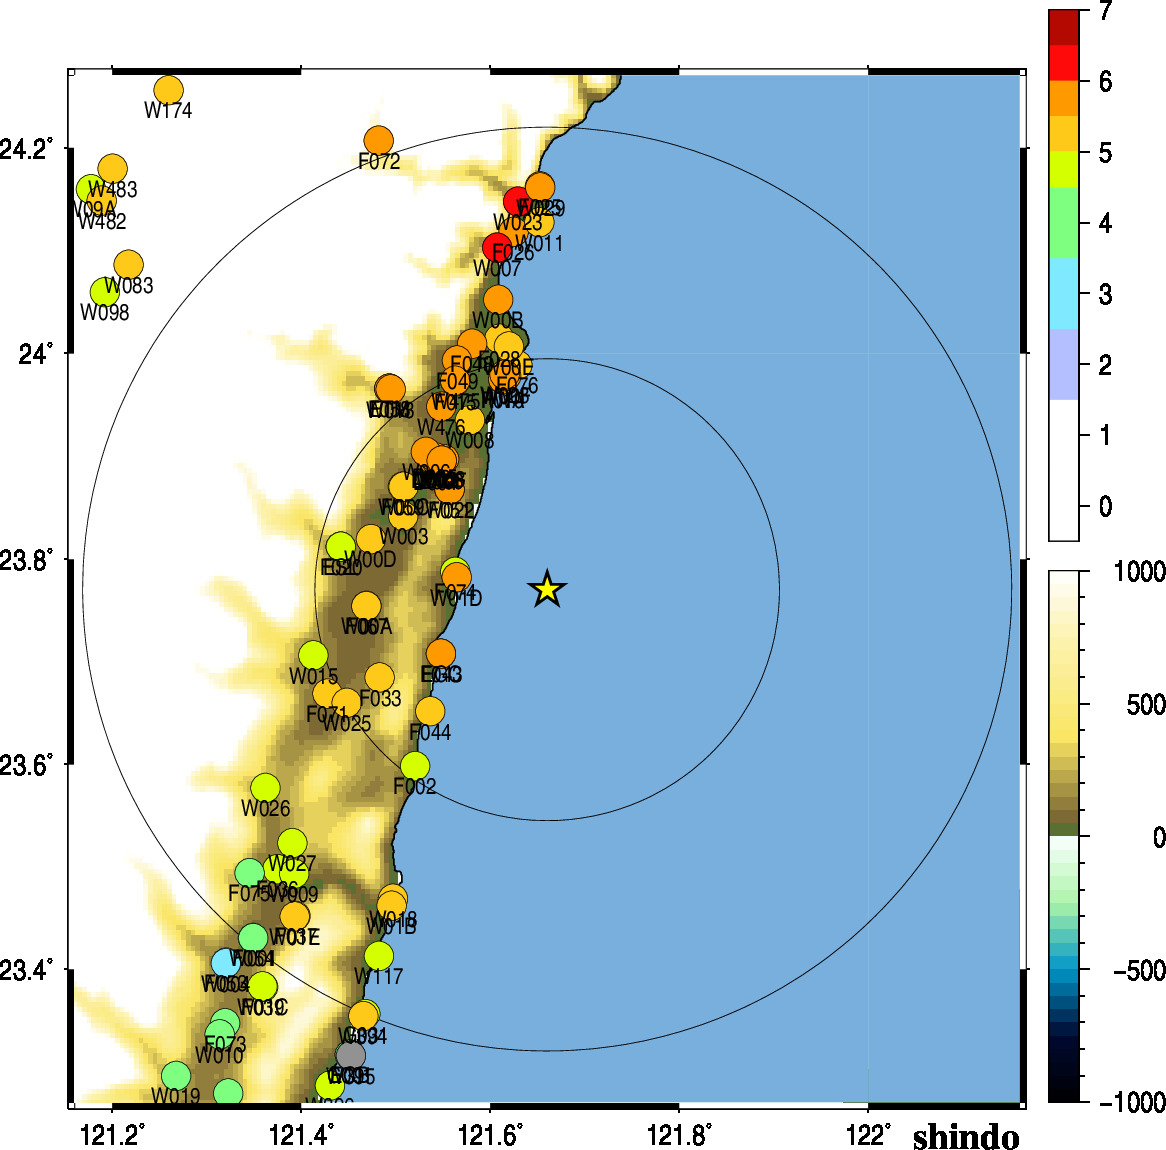
Fig.3. JMA shaking intensity.
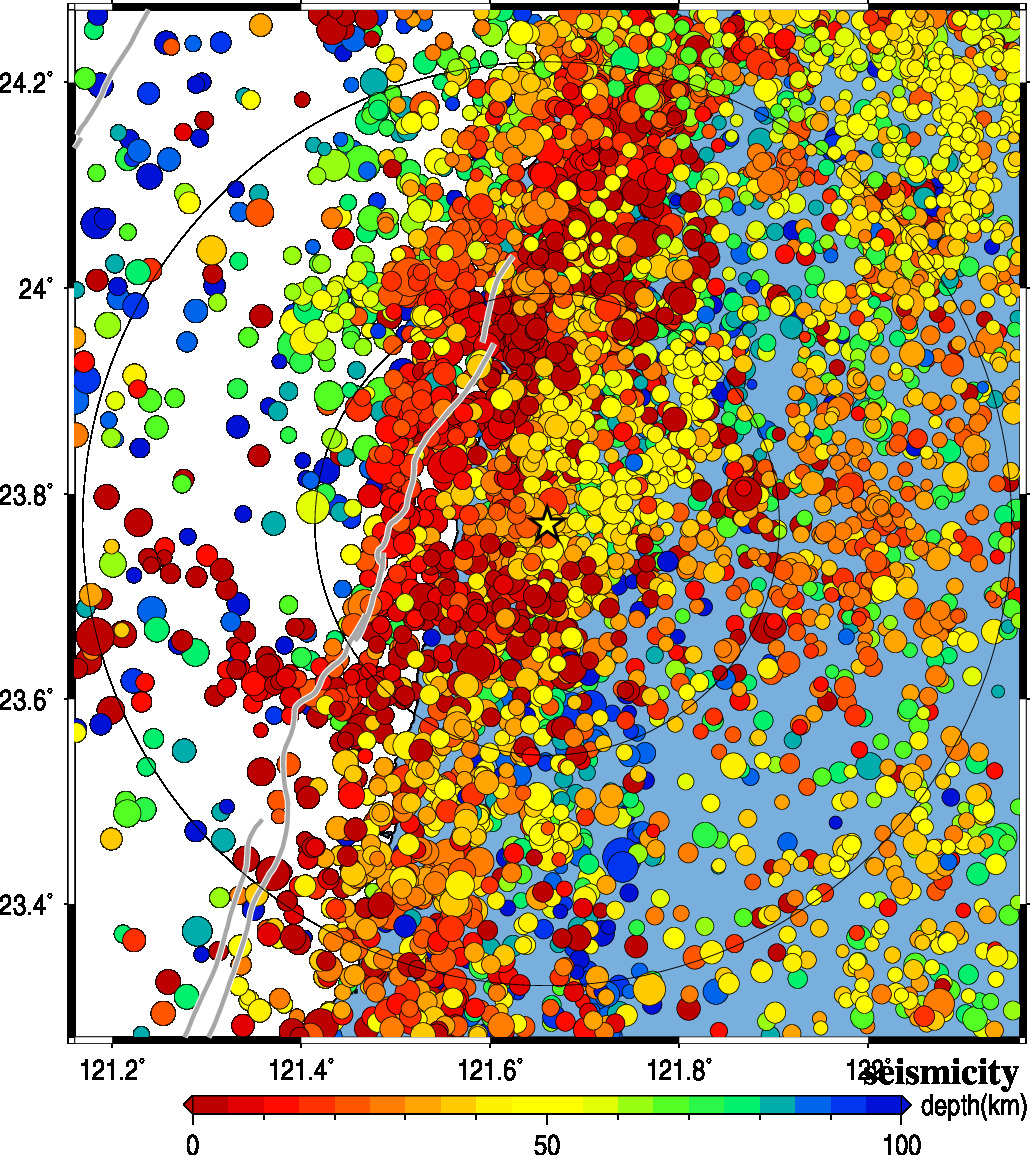
Fig.4. Seismic activity of past 40 years.
3.解析結果 (Analytical Result)
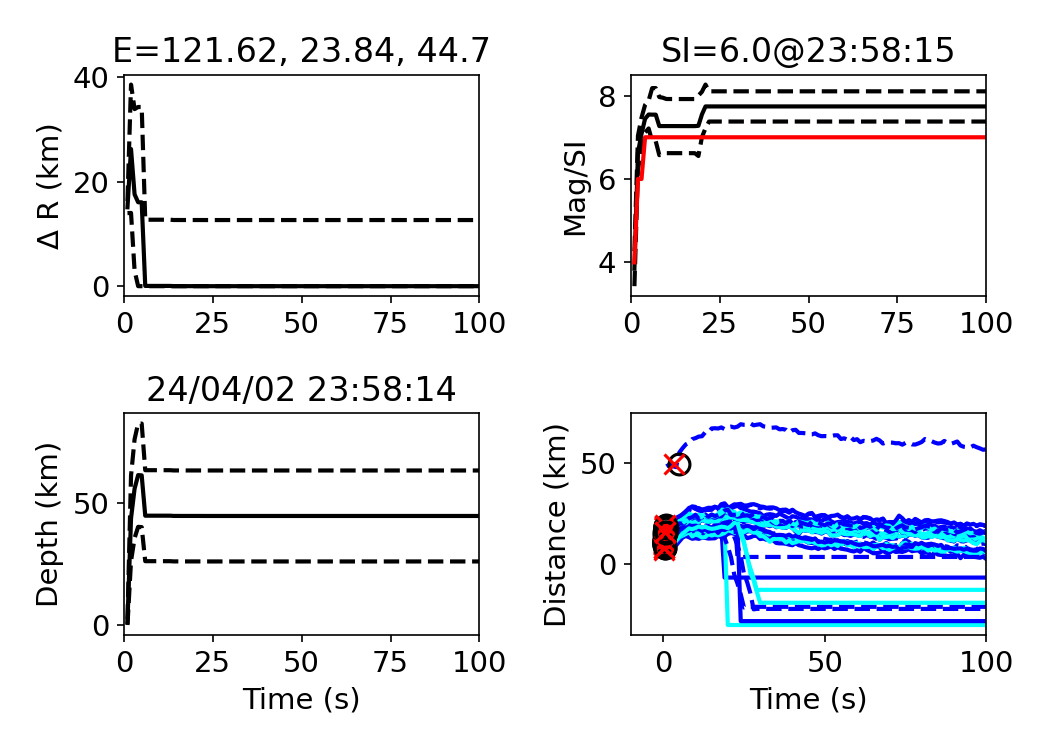
Fig.5. Time history of the estimates for source parameters by the IPFx method. The horizontal axis shows the time of processing.
- upper left: error of epicenter against the final estimation
- upper right: JMA magnitude (black) and maximum estimated shaking intensity (red)
- lower left: epicenter depth
- lower right: automatic picking time (black) and theoretical arrival time (red)
Fig.6. Simulation of the IPFx method. The triangles show seismic stations, and colored triangles are triggered stations. The star shows the estimated location of an earthquake. The color of the samples is proportional to the likelihood of the hypocenter location.

Fig.7. The waveforms aligned from the epicenter estimated by the IPFx method.
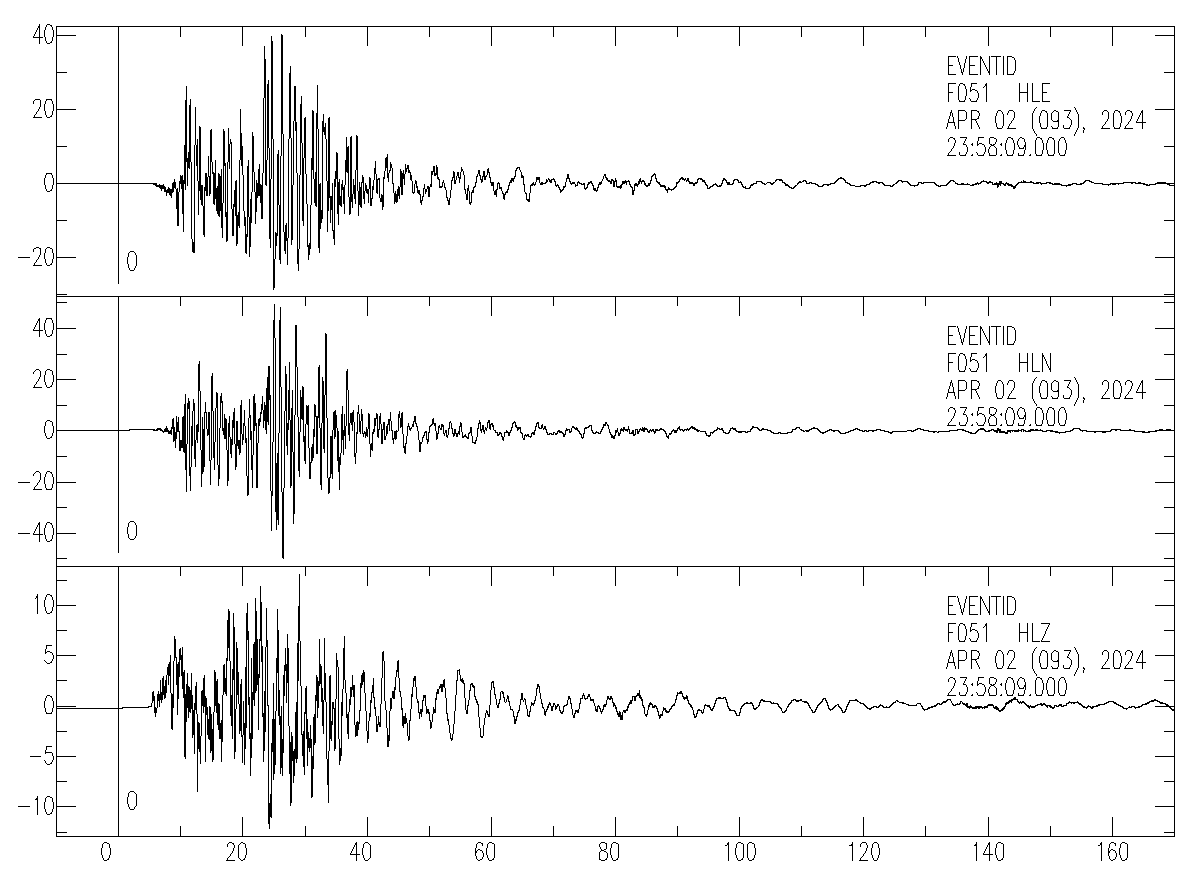
Fig.8. Velocity waveforms at the station F051 (R=15km).
Acknowledgements:
気象庁の震度情報、防災科学技術研究所のK-NET,KiK-net,Hi-net,S-netの波形、気象庁の強震波形、一元化震源カタログを利用しました。
緊急地震速報を発表した地震の解析結果
山田真澄 ホーム